-

-

-
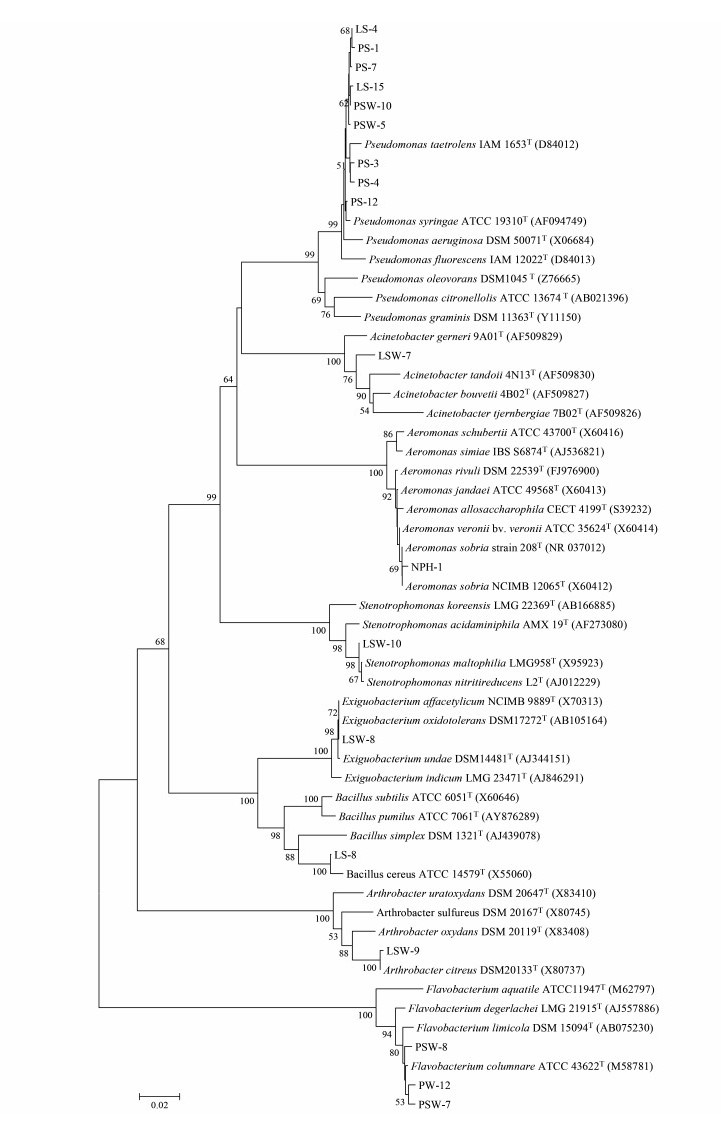
Phylum Class Order Family Genus Gram staining Morphology PhageFamily Host trains Actinobacteria Actinobacteria Actinomycetales Micrococcaceae Arthrobacter G+ rod Siphovirus LSW-9 Bacteroidetes Flavobacteria Flavobacteriales Flavobacteriaceae Flavobacterium G- rod Siphovirus PSW-7, PSW-12 Proteobacteria Gammaproteobacteria Pseudomonadales Pseudomonadaceae Pseudomonas G- rod Siphovirus LS-15; LS-4; PS-7; PSW-10 Firmicutes Bacilli Bacillales Bacillaceae Exiguobacterium G+ rod Siphovirus LSW-8 Firmicutes Bacilli Bacillales Bacillaceae Bacillus G+ rod Podoviridae LS-8 Proteobacteria Gammaproteobacteria Pseudomonadales Moraxellaceae Acinetobacter G- rod Podoviridae LSW-7 Proteobacteria Gammaproteobacteria Pseudomonadales Pseudomonadaceae Pseudomonas G- rod Podoviridae PS-1; PSW-5 Proteobacteria Gammaproteobacteria Pseudomonadales Pseudomonadaceae Pseudomonas G- rod Myoviridae PS-3, PS-4, PS-12; Proteobacteria Gammaproteobacteria Xanthomonadales Xanthomonadaceae Stenotrophomonas G- rod Myoviridae LSW-10 Proteobacteria Gammaproteobacteria Aeromonadales Aeromonadaceae Aeromonas G- rod Myoviridae NPH-1 Bacteroidetes Flavobacteria Flavobacteriales Flavobacteriaceae Flavobacterium G- rod Myoviridae PSW-8 Table S1. Host isolate and phage taxonomy
-
Phage 4℃ 10℃ 15℃ 20℃ 25℃ 30℃ 37℃ 42℃ LS-4 + + + + + + - - LS-8 + + + + + + + - LS-15 + + + + - - - - PS-1 + + + + - - - - PS-3 + + + + + - - - PS-4 + + + + - - - - PS-7 + + + + - - - - PS-12 + + + + + - - - NPH-1 + + + + - - - - LSW-7 + + + + + - - - LSW-8 + + + + + + + - LSW-9 + + + + + - - - LSW-10 + + + + - - - - PSW-5 + + + + - - - - PSW-7 + + + + + - - - PSW-8 + + + + + - - - PSW-10 + + + + - - - - PSW-12 + + + + + - - - Note: "+"indicates plaque formation, "-" indicates no plaque formation. Table S2. Temperature ranges of plaque formation
-

LS-4 LS-8 LS-15 PS-1 PS-3 PS-4 PS-7 PS-12 NPH-1 LSW-7 LSW-8 LSW-9 LSW-10 PSW-5 PSW-7 PSW-8 PSW-10 PSW-12 VLS-4 + - - - - - - - - - - - - - - - - - VLS-8 - + - - - - - - - - - - - - - - - - VLS-15 - - + - - - - - - - - - - - - - - - VPS-1 - - - + - - - - - - - - - - - - - - VPS-3 - - - - + - - - - - - - - - - - - - VPS-4 - - - - - + - - - - - - - - - - - - VPS-7 - - - - - - + - - - - - - - - - - - VPS-12 - - - - - - - + - - - - - - - - - - VNPH-1 - - - - - - - - + - - - - - - - - - VLSW-7 - - - - - - - - - + - - - - - - - - VLSW-8 - - - - - - - - - - + - - - - - - - VLSW-9 - - - - - - - - - - - + - - - - - - VLSW-10 - - - - - - - - - - - - + - - - - - VPSW-5 - - - - - - - - - - - - - + - - - - VPSW-7 - - - - - - - - - - - - - - + - - - VPSW-8 - - - - - - - - - - - - - - - + - - VPSW-10 - - - - - - - - - - - - - - - - + - VPSW-12 - - - - - - - - - - - - - - - - - + Note: "+"indicates could infect host cell, "-" indicates could not infect host cell. Table S3. The host ranges of isolated phages
-
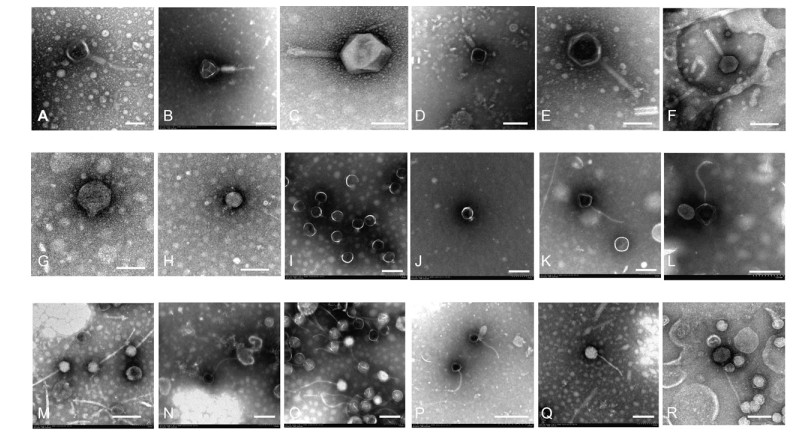
Number Family Head capsid diameter (nm) Tail length (nm) Tail diameter (nm) Host strain A Myoviridae 116.0±2.31 296.7±3.01 29.3±0.76 PS-4 B Myoviridae 108.6±1.86 173.3±2.55 32.4±1.22 LSW-10 C Myoviridae 134.1±1.56 154±3.02 38.2±1.15 PSW-8 D Myoviridae 70.9±2.09 106.5±2.63 25.8±0.56 PS-3 E Myoviridae 121.6±2.47 194.6±2.17 21.6±1.09 NPH-1 F Myoviridae 70.3±0.98 118.9±1.83 20.5±0.66 PS-12 G Podoviridae 60.8±1.10 13.5±0.58 10.8±0.87 LSW-7 H Podoviridae 78.0±1.36 28.2±0.72 11.4±1.20 PS-1 I Podoviridae 57.0±1.53 23.3±0.68 13.6±1.27 PSW-5 J Podoviridae 57.7±1.64 15.4±0.71 7.7±0.88 LS-8 K Siphoviridae 76.9±2.31 192.3±1.93 7.7±0.85 PSW-10 L Siphoviridae 52.7±2.01 196.2±1.84 8.1±1.10 PS-7 M Siphoviridae 57.7±1.86 199.6±1.76 11.5±0.78 LSW-8 N Siphoviridae 53.3±1.42 166.7±1.68 6.7±0.34 LSW-9 O Siphoviridae 58.7±1.38 204.2±2.04 7.6±0.48 LS-15 P Siphoviridae 59.1±2.04 190.1±1.57 9.1±0.43 PSW-7 Q Siphoviridae 42.3±1.67 165.4±1.36 7.7±0.50 PSW-12 R Siphoviridae 83.3±2.34 190.5±3.05 9.5±0.62 LS-4 Note: Means ± SD (n = 3) Table S4. Mean sizes of phages observed by TEM isolated from the Napahai plateau wetland, Yunnan province, China
Figure 2 个
Table 4 个