-

-

-

-

-
Primer Accession Sequence GAPDH-F NM_002046.4 5'-180-GAAGGTGAAGGTCGGAGTC-3' GAPDH-R 5'-405-GAAGATGGTGATGGGATTTC-3' HCV-F 5'-TCTGCGGAACCGGTGAGTA-3' HCV-R 5'-TCAGGCAGTACCACAAGGC-3' Table 1. The primers listed in this paper
-
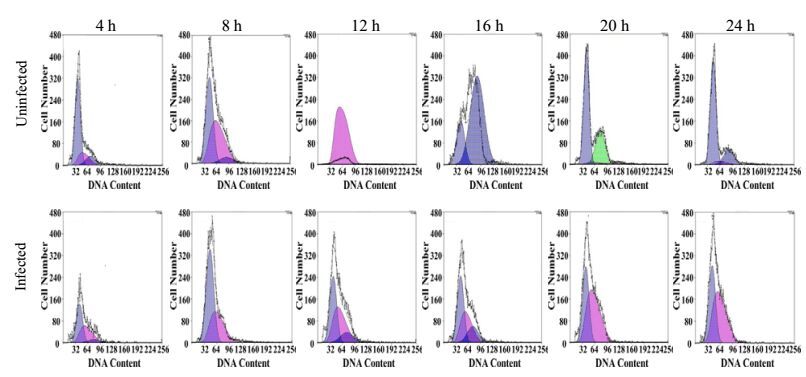
Passage No. Hours post infection (h) mock infected G1 S G2/M G1 S G2/M 1 48 48.5 34.1 17.45 51.2 23.1 25.75 1 72 51.65 34.15 14.2 60.9 22.4 16.75 1 96 48.95 35.6 15.45 71.5 0 28.5 2 120 55.65 28.35 16 68.25 10.35 21.4 2 144 53.9 23.7 22.35 73.2 6.2 20.6 Huh7.5.1 cells were infected with J399EM at 1 MOI and incubated for indicated period. Cells were passaged once at 72 h post infection. Cells were trypsinized and collected in tubes followed by fixation and PI staining. Flow cytometry analysis was performed to determine the cell cycle phase of the cells. The percentage of cells in each phase were listed. Table 2. The changes of cell cycle distribution of Huh7.5.1 cells induced by HCV infection
Figure 4 个
Table 2 个