-

-
-
-
-
-
-
-
-
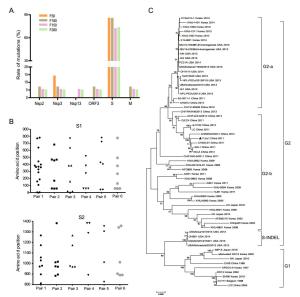
ORFs Encoded proteins F20 F50 F100 F150 F200 ORF1a Nsp2 0 (0)* 0 (0) 1 (0.13) 1 (0.13) 1 (0.13) Nsp3 0 (0) 1 (0.06) 1 (0.06) 1 (0.06) 1 (0.06) ORF1b Nsp13 0 (0) 0 (0) 0 (0) 1 (0.17) 1 (0.17) S (1386) S 0 (0) 6 (0.43) 12 (0.87) 13 (0.94) 14 (1.01) ORF3 (225) ORF3 0 (0) 0 (0) 1 (0.44) 1 (0.44) 1 (0.44) M (227) M 0 (0) 0 (0) 1 (0.44) 1 (0.44) 1 (0.44) Total number 0 7 14 18 19 *Number of aa changes and change rates of the corresponding proteins (%) are indicated in parentheses. Table 1. Statistics of aa change numbers and change rates in the corresponding proteins at different passages.
-
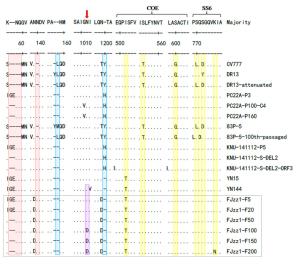
ORFs Amino acid position F20 F50 F100 F150 F200 ORF1a Nsp2 (750) 699 M M L L L Nsp3 (1656) 1562 M I I I I ORF1b Nsp13 (597) 968 A A A T T S (1386) 42 Q Q H Q Q 55–57 IGE K– K– K– K– 128 F F Y Y Y 265 D D D A A 378 D D N N N 490 T T R R R 773 K K K K N 877–878 SG RR RR RR RR 900 L L L L V 1009 N N D D D 1338 I I T T T 1353 C F F F F ORF3 (225) 170 Y Y H H H M (227) 159 G G D D D Table 2. Amino acid changes that occurred at different passages.
Figure 8 个
Table 2 个