-
-

-
Human monocyte Classical Intermediate Non-classical Surface markers CD14++CD16- CD14++CD16+ CD14+CD16++ Percentage (normal range) 80%–95% 2%–11% 2%–8% Chemokine receptor CCR2high CX3CR1low
CD62L+CCR2mid CX3CR1high
CCR5+CCR2low
CX3CR1highFunction Phagocytosis and immune response
Linked to normal immune responsePro-inflammatory
Linked to CVD, chronic inflammatory disease and HIVPatrolling and anti inflammatory
Inflammation and HIV infectionResemble mouse subsets Ly6C+ Ly6C+ Ly6C- Adhesion molecules CD62L expression High Low Low Response to LPS High IL-10 & low TNF-α levels IL-1β and TNF-α Low IL-10 and high TNF-α levels Gene signature Induction of T cell proliferation Links to T cell activation and antigen presentation Correlates with T cell activation Viral load (HIV) Decrease with HIV-1 infection Positive correlation Positive correlation CD4 Positive correlation Negative correlation Negative correlation TF/HIV infection Low expression Increased expression Increased expression D-dimer/HIV ND Positive correlation Positive correlation Data compiled from: Funderburg et al.(2010 , 2012);Wong et al. (2011) ; Woollard and Geissmann (2010);Yang et al. (2014) ; and Ziegler-Heitbrock(2007, 2015).
CCR: Chemokine receptor; CX3CR1: CX3C chemokine receptor 1; ND: Not determined; HIV: Human immunodeficiency virus; LPS: Lipopolysaccharides; Ly6: Lymphocyte antigen 6 C; TF: Tissue factor; TNF-α: Tumor necrosis factor-alpha.Table 1. Comparative analysis of the three described monocyte cell subpopulations.
-
Non-pathogenic species (e.g. African Green Monkey) Pathogenic species (e.g. Rhesus macaque) Stable viral replication High viral replication Normal level of immune activation and apoptosis High level of immune activation and apoptosis Restoration of CD4 T cells in peripheral blood and intestine No restoration of CD4 T cells Lower levels of CCR5 expressing CD4 T cells, with lack of disease progression Higher levels of CCR5 expressing CD4 T cells, with disease progression Preservation of immune cell subset function Abnormal immune cell subset function Lack of microbial translocation, with absence of aberrant immune activation High levels of microbial translocation, with aberrant immune cell activation Establishment of early anti-inflammatory milieu Lack of early anti-inflammatory role Early interferon response drops off Early interferon response continues CD169 expression decreases on monocytes CD169 expression increases on monocytes Reduced activation Chronic activation Table 2. Non-pathogenic vs. pathogenic models of simian immunodeficiency virus.
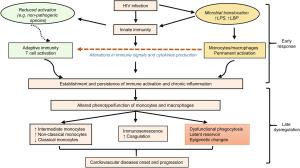
Figure 2 个
Table 2 个

