


HTML
-
Since the presumed index fatal case was investigated and confirmed in December 2013, the devastating Ebola virus disease (EVD) outbreak in West Africa had persisted more than two years (Baize et al. 2014). World Health Organization (WHO) reported a total of 28, 616 confirmed, probable, and suspected cases and 11, 310 mortalities by June 10, 2016 (WHO 2016a, b; Garske et al. 2017). The gold standard for EVD diagnosis at that time was real-time reverse transcription polymerase chain reaction (RT-PCR) to detect Ebola virus (EBOV) RNA, such as assays targeting nucleoprotein (NP) and glycoprotein (GP) reported in China (Li et al. 2014; Pang et al. 2014) or those aimed at detecting NP2 and virion protein 40 (VP40) reported in USA (Southern et al. 2015). In addition to nucleic acid detection, serological assays to detect specific antiviral antibodies included Immunofluorescence assay (IFA), Western blotting (WB), and enzyme-linked immunosorbent assay (ELISA). Inactivated cultured virions (Ksiazek et al. 1999) or recombinant proteins, e.g., NP (Niikura et al. 2001), VP40 (Lucht et al. 2003), GP (Lucht et al. 2004), could serve as alternatives for serology-based diagnosis of EVD. Previous humoral studies indicate that EBOV-specific IgG were detected in 2.6%–46% of asymptomatic individuals in many African countries prior to the 2013 Ebola outbreak in Western Africa (Leroy et al. 2000; Schoepp et al. 2014; Broadhurst et al. 2016; Bower and Glynn 2017; Glynn et al. 2017). However, limited information is available regarding EBOV-specific IgM/IgG titers in the Western African population at high risk in 2014–2015 after this outbreak.
The Sierra Leone-China Friendship Biological Safety Laboratory (SLE-CHN Bio-safety Lab) was established soon during the peak of the Ebola outbreak. This was the first biological safety level 3 laboratory (BSL-3 lab) in Freetown, Sierra Leone, established in March 2015. Thousands of specimens, including routine surveillance specimens (blood of hospitalized patients and throat swabs of cadavers) and survivor specimens in a quartet cooperative project have been delivered to the laboratory (Lu et al. 2015; Deen et al. 2017). The last female patient in Sierra Leone was discharged from hospital in February 2016, and the WHO terminated the emergency status of this outbreak internationally in March 2016 (WHO 2016a, b). Since then, no emerging cases had been reported since December 2015 until the last patient was reported; this period (2015.3–2015.12) has been defined as the late phase of the Ebola outbreak, during which the number of EVD patients peaked and then nullified. This study aimed to investigate the serological characteristics of Ebola virus (EBOV) infection during the late phase of the Ebola outbreak in Sierra Leone.
-
During the Ebola outbreak, a patient presented with acute onset of fever (≥ 38.6 ℃) with clinical symptoms (e.g., headaches, vomiting, diarrhea, and aching muscles or joints), and epidemiological risk factors (exposure to the epidemic area or to infected individuals and their secretions in 3 weeks) was defined as a suspected case of an EBOV infection. In addition, any person with inexplicable bleeding or sudden, inexplicable death was also defined as a suspected EVD case. Confirmed cases of EBOV infection were determined if EBOV RNA was detected in their blood upon real-time PCR analysis. All blood specimens used in this study were collected by the specimen center of the Ministry of Health and Sanitation, Sierra Leone (MoHS), and submitted to SLE-CHN Biosafety Laboratory. Specimen collection sites encompassed most of the territory in Sierra Leone (Kailahun, Western urban, Kenema, Moyamba, Bo, etc.). With a unique MoHS-DPC-ID for each patient, the clinical and epidemiological data (age, sex, address, initial or repeated or follow-up, date of hospitalization, date of symptom onset, date of specimen collection, date of specimen analysis, etc.) were obtained from the datasheet of clinical information form. After receiving specimens, real-time PCR results were reported within 24 h in accordance with the requirements of the MoHS.
Serological analysis in this study was performed between March and December, 2015. After screening out a limited volume of sera, 877 available blood specimens from total 694 suspected individuals were included in this study, of which there were 31 confirmed patients with RNA-positive samples and 663 suspected patients with RNA-negative samples. Owing to biosafety concerns and limited test conditions, 340 blood specimens from 290 suspected patients were randomly selected for detection of IgM and IgG via the Luminex assay (Fig. 1). The negative control group comprised serum samples from 96 healthy donors from a local hospital in Beijing, who had clear medical histories with no fever or other symptoms; these samples were used to determine the baseline values. Although no negative control individuals were obtained from Africa, the RNA-negative specimens in this study were considered internal controls. In addition to healthy human sera, clinical specimens from high fever with renal syndrome patients, severe fever with thrombocytopenia syndrome patients, and Dengue patients were also considered to comprise the negative control group.
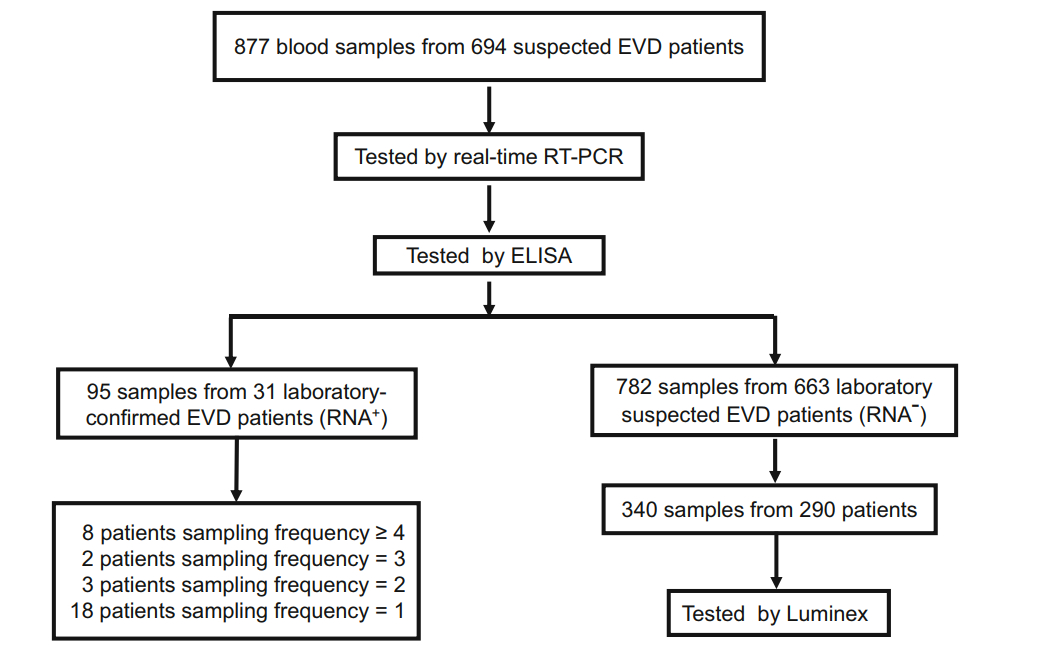
Figure 1. A schematic representation of the study methodology. In total, 877 whole blood specimens from 694 suspected patients were first assessed for the presence of Ebola virus (EBOV) RNA via real-time polymerase chain reaction assays, and IgM and IgG titers were determined using an enzyme-linked immunosorbent assay for EBOVspecific human IgM/IgG thereafter. Thirty-one patients were confirmed as EVD patients, from whom 95 samples were obtained at different sampling frequencies, as shown. Among the remaining 782 samples from 663 RNA-negative suspected EVD patients, 340 samples from 290 patients were randomly selected to be assessed via Luminex for IgM and IgG detection.
-
The EBOV IgM-capture ELISA kit was used to detect IgM, and the EBOV human IgG ELISA kit was used to detect IgG. Both kits were developed in-house and constructed in the GMP workshop, followed by QC, QA standard, and they were allocated the same lot number (Wantai, Beijing, China). Briefly, for IgM detection, 96-well plates were coated with anti-human μ-chain antibody and purified recombinant EBOV N protein (rNP) (Zhou et al. 2016) labeled with horseradish peroxidase (HRP) was used as the secondary antibody. To determine IgG titers, 96-well plates were coated with EBOV rNP, followed by treatment with HRP-conjugated anti-human IgG as the secondary antibody. ELISAs were performed in accordance with conventional methods with whole blood samples at a 1:100 dilution, prepared in sample dilution buffer provided in the ELISA kit and inactivated at 56 ℃ for 30 min. Briefly, for IgM-capture ELISA, diluted and inactivated samples were added into 96-well plates coated with anti-human μ-chain antibody, incubated at 37 ℃ for 1 h, followed by incubation with HRP-conjugated rNP for another 1 h. The substrate, 3,3’,3,5’-tetramethylbenzidine (TMB), was used for color development; thereafter, the optical densities (OD) were determined at 450 nm, using an ELISA plate reader (Thermo Scientific, Waltham, USA). To detect IgG, diluted and inactivated samples were added into 96-well ELISA plates coated with NP antigens, followed by incubation with HRP-conjugated anti-human IgG secondary antibody. Following substrate addition, OD was determined, as indicated above.
For the positive and negative controls provided in the kits, OD values greater than 1.0 and less than 0.1, respectively, were considered to indicate threshold values. To determine the cutoff threshold, 96 serum samples from healthy individuals were analyzed for each assay. Cutoff values were determined by adding 3 S.D. values to the mean of the OD values obtained from serum samples of healthy individuals. A specimen was considered positive if the OD value was greater than the cutoff threshold.
-
Owing to biosafety concerns and limited test conditions, 340 RNA-negative specimens were randomly selected for IgM and IgG detection via the multiplex Luminex-based immunoassay in a BSL-2 laboratory. The Luminex assay was carried out in accordance with a previously described method (Zhou et al. 2014; Ayouba et al. 2017). Briefly, to develop the Luminex assay, 100 μL (approximately 1.25 × 10⁶) of different fluorescence-labeled microspheres were generated by chemically conjugating 20 μg of purified protein (NP, VP40, and GP, respectively), using the amine coupling kit (Bio-Rad, Hercules, USA), followed by activation. The antigen-conjugated microspheres were stored at 4 ℃ until use. For analysis, a 96-well multiscreen plate was prewetted with 100 μL of assay buffer. Coupled microspheres (12.5 μL; 1:25) of each set (approximately 5000 microspheres) were added, followed by the addition of 100 μL of diluted samples prepared from whole blood specimens diluted to 1:1000 in assay buffer (1% BSA in PBS). After incubation at 600 rpm for 1 h at 25 ℃ in the dark and washing with assay buffer, 50 μL R-phycoerythrin-conjugated goat anti-rabbit IgG or goat anti-rabbit IgM (both, 1:100; Sigma Aldrich) was added to each well, followed by incubation. The microspheres were then washed and resuspended in 125 μL of assay buffer. Mean fluorescence intensity (MFI) signals were read for each sample, using a Luminex-200 instrument (Bio-Rad). When conducting the Luminex assay for IgM antibody, diluted samples should be incubated in the plate coated with antihuman IgG (Sigma Aldrich) to eliminate rheumatoid factor, before incubation with antigen-conjugated microspheres. To obtain the MFI threshold, 96 healthy serum specimens from TaoRanTing hospital were tested as negative controls. The MFI value exceeding the (M + 3sx) of negative controls was considered positive.
-
Whole blood specimens were aliquoted and stored at -20 ℃, and 70 μL for each sample were directly used for RNA extraction. Viral RNA extraction was performed in the BSL-3 lab in Sierra Leone in accordance with the standard operational procedure (SOP) of the biosafety laboratory. Two methods were used for the viral RNA extraction. For few specimens, manual RNA extraction was performed using the QIAamp viral RNA mini kit (Qiagen, Hilden, Germany) in accordance with the manufacturer's instructions; for large-scale RNA extraction, automatic extraction was performed using a 96-well MagMAXTM purification system along with MagMAX-96 Viral RNA Isolation Kit (Life Technologies, Carlsbad, CA, USA). An Ebola virus Real Time PCR Diagnostic Kit (Chinese FDA Registration Number: 20143402058, China CDC and Daan Gene, Guangzhou, China) was used for EBOV viral RNA detection in all collected blood samples. This kit is based on a one-step duplex real-time TaqMan qRT-PCR assay detecting both NP and GP genes of Zaire EBOV. Briefly, the 25-μL reaction mixture comprised 17 μL of PCR reaction Solution A, 3 μL of PCR reaction Solution B, and 5 μL of RNA extracts. The cycling conditions were as follows: 50 ℃ for 15 min, 95 ℃ for 15 min, followed by 45 cycles for 15 s at 94 ℃ and 45 s at 55 ℃. The Ct value for a positive specimen was set at 38 cycles. tenfold serial dilutions of in vitro synthetic target EBOV NP transcripts, ranging from 101 to 108 copies/mL, were used as standard preparations to depict the standard curves. Then the viral RNA copies load could be calculate using Ct value.
-
ELISA and Luminex data were analyzed using SPSS 23.0 (SPSS Inc., Chicago, USA), and Graphpad Prism 6 (GraphPad Software, San Diego, USA). Suspected and health donor samples were compared using a two-tailed t test. Luminex and ELISA results were compared using a paired χ2 test. A P value < 0.05 was considered statistically significant.
Case Definition and Specimen Collection
Detection of EBOV NP-Specific IgM/IgG Antibodies via ELISA
Detection of EBOV NP, VP40, and GP-Specific IgM/IgG Antibodies via Luminex
RNA Extraction and Real-Time RT-PCR
Data and Statistical Analysis
-
To assess the serological characteristics of EVD patients or exposed individuals in Sierra Leone during the late phase of the Ebola outbreak, IgG and IgM antibody levels of submitted specimens were detected and analyzed. Owing to the lack of FDA-licensed commercial serological kits during the outbreak, two in-house developed methods (ELISA and Luminex) were applied for serological analysis. EBOV-specific antibodies were tested for all the 877 specimens with EBOV human IgM capture ELISA kit (Fig. 2A upper) and IgG ELISA kit (Fig. 2A lower). In total, 340 RNA-negative samples were randomly selected and assessed for the presence of IgM or IgG against EBOV NP, VP40, and GP, via multiplex Luminex assays (Fig. 2B). As shown in Fig. 2, significant differences (P < 0.05) were observed in titers of IgM or IgG to EBOV NP between suspected EBOV patient samples and samples from healthy Chinese individuals. EBOV NP-specific IgM or IgG were not detected in all clinical specimens of healthy Chinese donors and simulated control samples of non-EBOV virus infection (data not shown). IgM and IgG antibodies to EBOV NP were detected in 7.75% (68/877) and 25.54% (224/877) of samples of suspected EVD patients, respectively, upon ELISA (Fig. 2A, Table 1); 7.64% (26/340) and 23.53% (80/340), respectively, upon Luminex (Fig. 2A, Table 1). In addition, via multiplex Luminex assays, EBOV VP40-specific IgM and IgG were detected in 11.5% (39/340) and 27.1% (92/340) of suspected EVD patients, respectively; antibodies targeting GP were detected in 3.2% (11/340) for IgM and 28.8% (98/340) for IgG (Fig. 2B, Table 1).
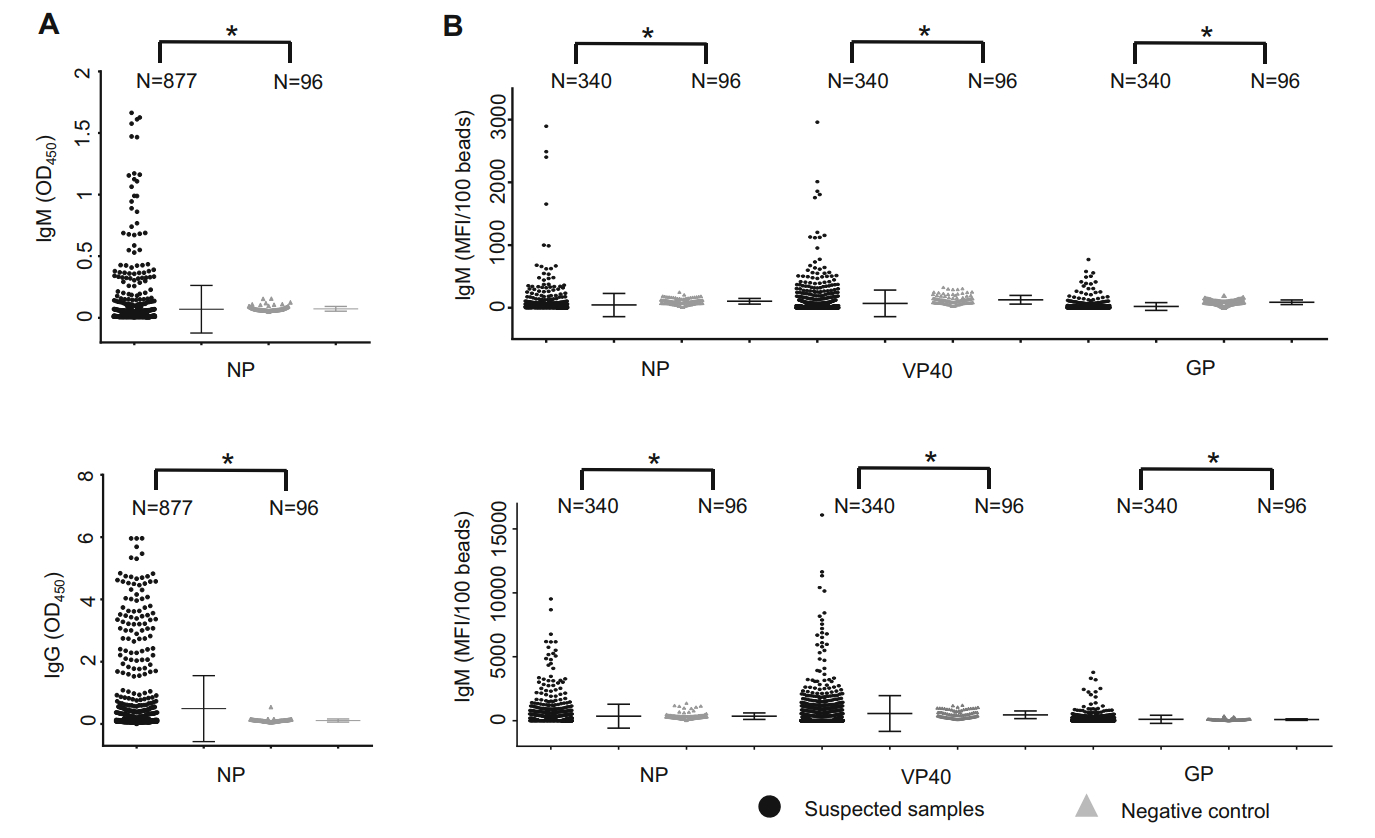
Figure 2. Evaluation of ELISA and Luminex results to detect Ebola virus (EBOV)-specific IgM/IgG. (A) In total, 877 specimens were assessed for EBOV-specific human IgM, using capture ELISA kit (upper) and IgG ELISA assays (lower). The Y-axis represents optical density (OD) values at 450 nm. (B) In total, 340 samples, selected randomly on the basis of RNA-negative samples, were detected using IgM and IgG Luminex assays for NP (left), VP40 (middle), and GP (right). The Y-axis represents the mean fluorescence intensity (MFI) values per 100 beads. Arithmetic mean and the standard deviation (STD) values are shown in each figure. Filled square represents specimens from suspected patients; Filled teiangle, health donors. Statistical comparisons between groups are analyzed using two-tailed unpaired t-tests with SPSS 23. A P-value less than 0.05 is considered statistically significant (P < 0.05 is represent as *)

Table 1. IgM/IgG antibodies detected via ELISA and Luminex.
To evaluate the coherence of ELISA and Luminex methods, the paired results of 340 specimens from suspected patients and 96 healthy specimens were analyzed using McNemar-Bowker's test, with SPSS 23.0. As shown in Table 2, among 436 samples, 21 were positive and 402 were negative, verified via both ELISA and Luminex for IgM antibody, indicating a consistency of 97.0% (χ2 = 0.31, p > 0.05) between these two methods. Furthermore, among 436 samples, 62 were positive and 328 were negative upon combinatorial analysis of ELISA and Luminex for IgG, thereby revealing a consistency of 89.4% (χ2 = 2.17, p > 0.05) between these results. ELISA and Luminex results were not significantly different in terms of detecting NP-specific IgM and IgG.

Table 2. Comparison of the results of ELISA and Luminex for serological detection of Ebola-specific IgM and IgG.
-
To better understand the temporal distribution of EBOV viral and serological characteristics in the late phase of the Ebola outbreak, 877 specimens derived from 694 patients were assessed via real-time RT-PCR analysis for EBOV viral RNA and ELISA-based NP-specific IgM and IgG. The results were further analyzed and displayed chronologically (Fig. 3). Figure 3A shows the number of blood samples collected on a monthly basis from March to December, 2015, most of which were collected between March and October, thereafter decreasing drastically to < 10 in the last 2 months of the study. This trend is consistent with the timeline of this Ebola outbreak. Among all 877 samples, 68 (7.8%) were EBOV RNA-positive, as detected via real-time RT-PCR. The positive detection rate of viral RNA remained somewhat constant from March to July and then decreased to zero as early as August till the final month of the study (Fig. 3B). Regarding IgM detection, the positive detection rate was 7.8% (68/877) overall, primarily distributed in the first 6 months; thereafter, it was not detected after October 2015 (Fig. 3C). Furthermore, the positive detection rate of IgG in the later phase approached 25% (224/877) and remained somewhat constant till the near end of the study (Fig. 3D). Overall, in the late phase of the Ebola outbreak, specimens from the suspected Ebola patients showed a declining trend of positive rates for EBOV viral RNA, and EBOV NP-specific IgM/IgG. As early as August, the monthly rate of positive RNA detection decreased to zero, with no further turnover, while IgM or IgG in those samples persisted until end in October or December, respectively.
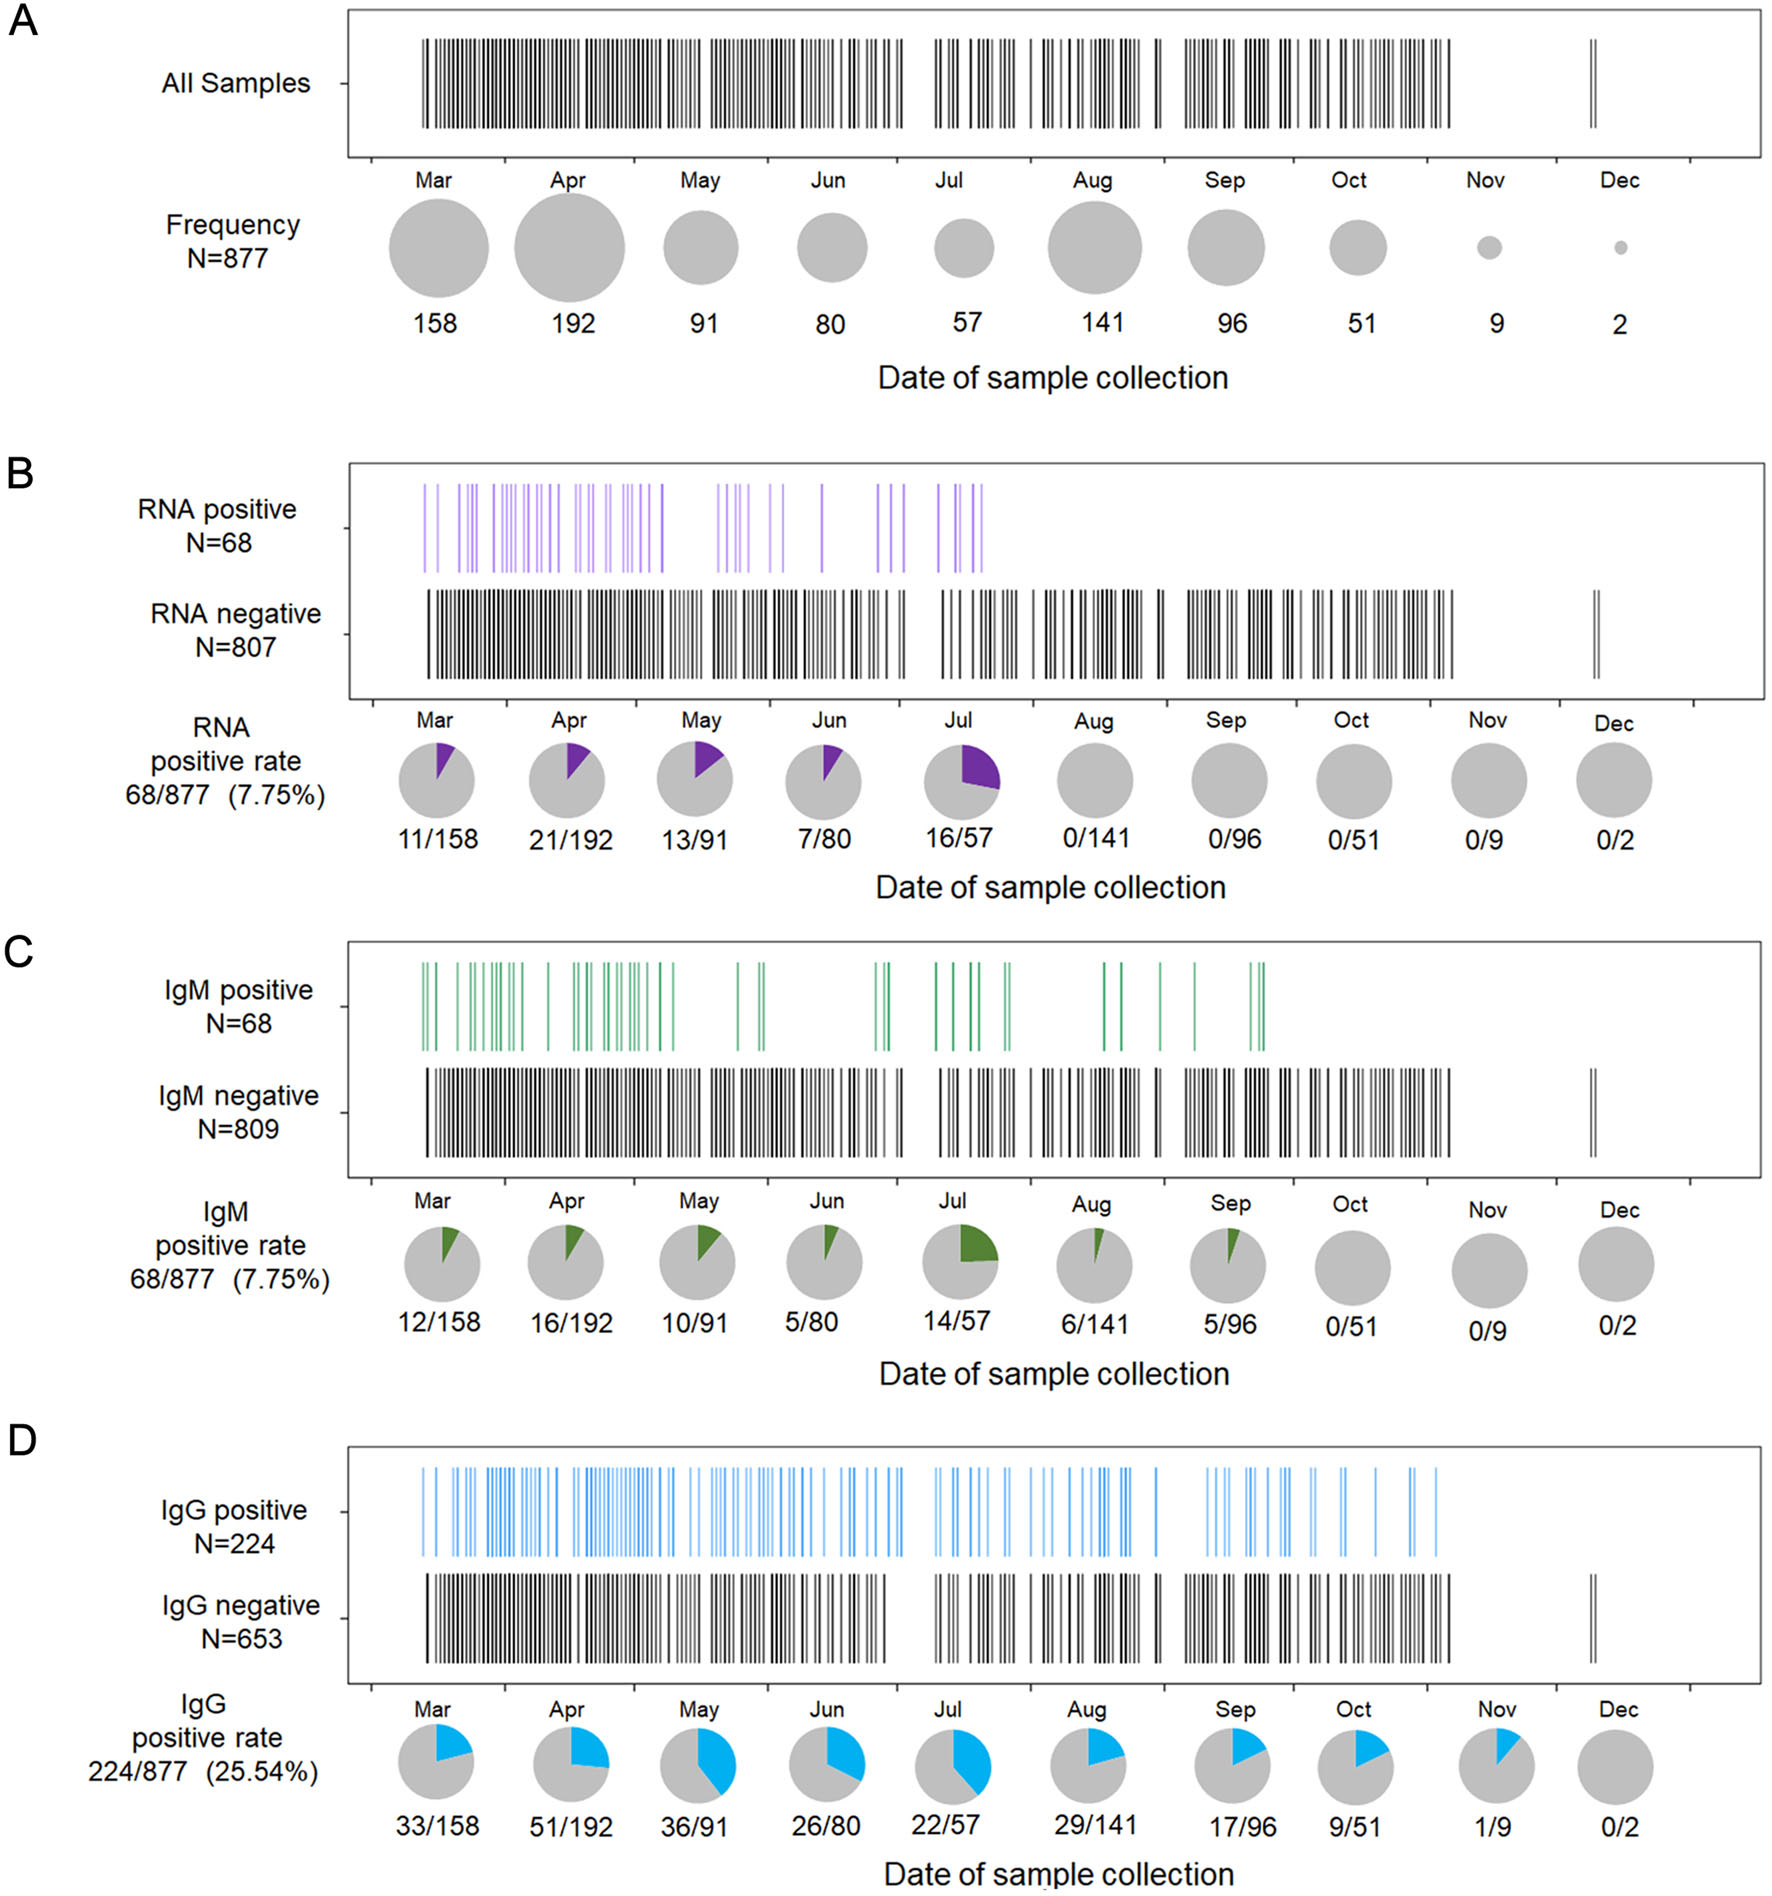
Figure 3. Temporal distribution of RNA and IgM/IgG antibodies in 877 specimens, detected from March to December 2015. (A) In total, 877 specimens are shown in accordance with the date of specimen collection (from March to December). One black bar represents one sample. Specimen frequency per month is denoted by the size of the grey pie charts. (B) In total, 877 specimens were assessed via RTPCR to distinguish RNA-positive samples from RNA-negative samples. One purple bar represents one RNA-positive sample. Rates of positive RNA detection per month are denoted by the purple portions in the grey pie charts. (C) Specimens are assessed for the presence of IgM. One green bar represents one IgM-positive sample. Rate of positive IgM detection per month is denoted by the grey portion of the pie chart; green, IgM-positive samples. (D) Samples assessed for the presence of IgG. One blue bar represents one IgG-positive sample. Rate of positive IgG detection per month is denoted by the blue portion in the grey pie chart.
Furthermore, we compared the positive detection rates of NP-specific IgM and IgG in 31 confirmed EVD patients with 663 suspected patients not harboring EBOV viral RNA throughout the study. As shown in Fig. 4, among the 31 confirmed EVD patients, IgM was produced in 18 (58.1%) and IgG was produced in 29 (93.5%), except for one patient who's sample collected on day 2 after symptom onset (Fig. 4A); however, among the 663 suspected patients with RNA-negative samples, IgM and IgG were produced in only 25 (3.8%) and 118 (17.8%) patients, respectively (Fig. 4B).
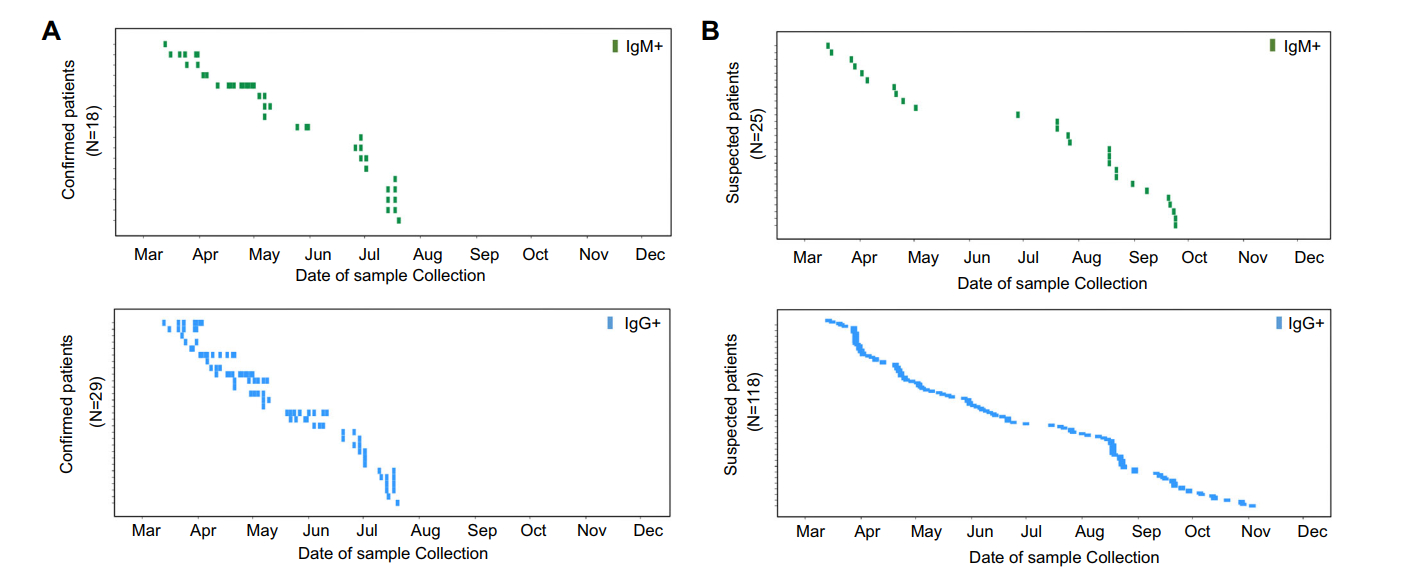
Figure 4. Temporal distribution of confirmed and suspected patients displaying positive detection rates for IgM/IgG from March to December 2015. (A) Confirmed patients with IgM positive (upper) and IgG positive (lower) samples are shown in accordance with the date of specimen collection. (B) Suspected patients with IgM-positive (upper) and IgG-positive (lower) samples. The Y-axis represents the confirmed patients (upper) with their designated patient numbers. Each lateral line represents one patient. One green block represents one IgM-positive sample; blue block, IgG-positive sample; a series of specimens from one patient are shown laterally.
-
To understand the dynamic changes in viremia and IgM/IgG antibody responses during EBOV infection, we analyzed 95 specimens from 31 confirmed EVD patients. Figure 5A shows the results for detection of RNA, IgM, and IgG for each patient (P1–P31, Y-axis) along with the time since disease onset (X-axis). In these 31 cases, viral RNA could be detected as early as on day 1 (P1) after disease onset, and as late as day 36 post disease onset (Fig. 5A left panel); while for IgM detection, only 58.0% (18/31) EVD patients produced IgM antibodies, which was detectable from day 2 to 28 after disease onset. IgM was not produced in approximately 42% of the patients (13/31) (Fig. 5A middle panel); except for one sample collected on day 2 post disease onset and one sample without sufficient information during collection, almost all confirmed EVD patients presented EBOV-specific IgG, which could be detected from the acute phase to the covalent phase (Fig. 5A right panel). Unfortunately, clinical data of 13 of these patients were unclear or inadequate; their results were presented up at the right side of each picture in Fig. 5A.
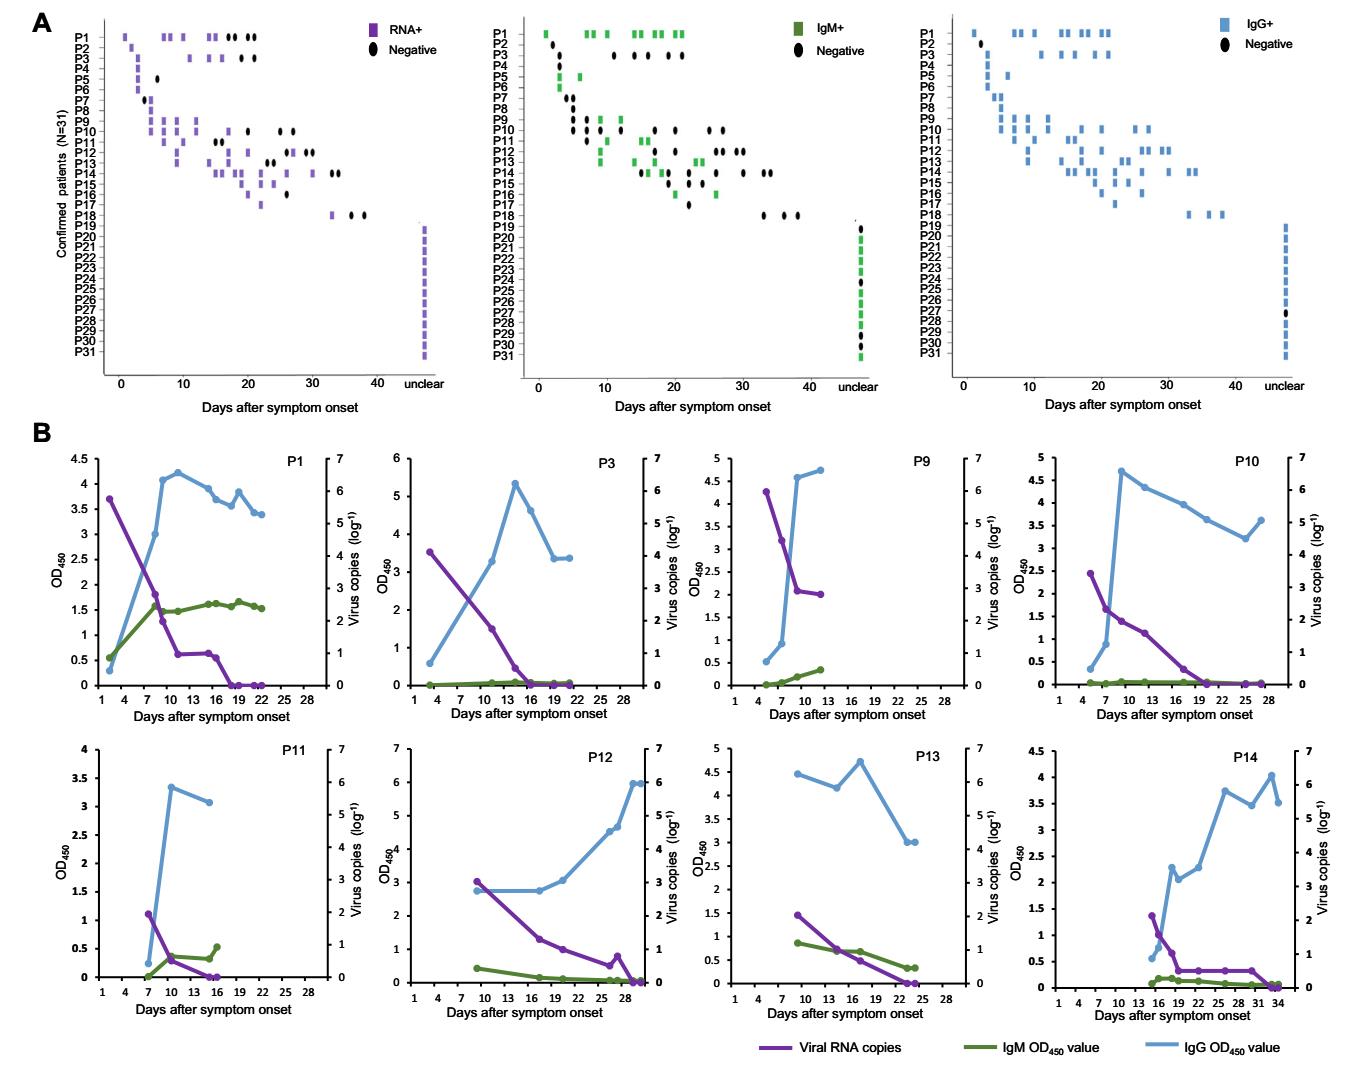
Figure 5. Dynamic changes in viremia and IgM/IgG responses in 31 confirmed patients with Ebola virus disease. (A) RNA detection and measurement of IgM and IgG titers were performed in accordance with the days of symptom onset. The Y-axis represents 31 confirmed patients. The X-axis represents days of symptom onset. Each lateral line represents one patient. One block represents one sample: purple, RNA detection results of one specimen (left); green, IgM (middle); blue, IgG (right). Black dots represent negative results. (B) Dynamic detection of Ebola viral load and IgM and IgG titers in confirmed patients. Eight patients with more than four longitudinal samples during their disease course were selected. The dynamic trends of Ebola-related viremia and IgM/IgG responses in each patient were further analyzed and shown in accordance with the days of symptom onset. Purple lines represent dynamic changes in viremia; green lines, IgM; blue lines, IgG. The X-axis represents days from disease onset; left-Y-axis represents mean OD450, right-Y-axis represents viral load (log–1).
Furthermore, to better describe the longitudinal changes in viremia and antibody responses, we analyzed the serological data of eight patients from whom samples were obtained more than four different time points during their disease course, and the viral RNA load in the patients' blood was also determined via real-time RT-PCR (Fig. 5B). In general, all eight patients developed viremia in the acute phase of EVD and displayed continuous IgG responses throughout the study. They presented with typical viremia and a trend of antibody response to EBOV infection, wherein viral load rapidly increased in the first week and decreased until clearance after approximately 2 weeks since disease onset. However, the IgG response was initiated at the beginning of the EVD course. Along with elimination of viral RNA, IgG titers increased and peaked at approximately 10 days post symptom onset and persisted for approximately 2 weeks (Fig. 5B). We also noticed a weak IgM response in most patients, except for patients P3 and P10, wherein IgM was not undetectable. Patient P9 was the only fatality in this study. Although both IgM and IgG responses were triggered in P9, viral load approached 5.67 × 10⁵ copies/mL (Ct value 19.79) on day 2 and persisted at a high level at 813 copies/mL (Ct value 30.01) on day 13 after symptom onset; viral load in the other 7 survivors decreased to approximately 100 copies/mL within 2 weeks and were undetectable thereafter.
Evaluation of EBOV IgM/IgG Antibodies via ELISA and Luminex Assay
Temporal Distribution of NP-Specific IgM/IgG among Confirmed and Suspected Patients in the Late Phase of Ebola Outbreak
Dynamic Changes in Viremia and IgM/IgG Antibody Responses in Confirmed EVD Patients
-
The Ebola outbreak in Sierra Leone is devastating and its incidence decreased from its peak to zero with the aid of international organizations and countries. The SLE-CHN Bio-safety Lab was established at the peak of the outbreak (Gao and Feng 2014) and received thousands of specimens to confirm or exclude the Ebola infection. After a 42-d period of increased surveillance and a 90-d period of heightened surveillance, no emerging flare-up patients were reported and the outbreak was terminated. Considering the temporal distribution of received samples (Fig. 3), this period (2015.3–2015.12) was defined as the late phase of the Ebola outbreak.
For confirmed diagnosis of EVD, a suspected patient with acute febrile symptoms and epidemiological risk factors should be verified on the basis of positive results upon real-time RT-PCR analysis. The PCR-based diagnostic kit used in our study was licensed by the Chinese FDA (Chinese FDA Registration Number: 20143402058) and well evaluated by numerous different clinical samples during the Ebola outbreak (Wang et al. 2016; Deen et al. 2017). Based on the PCR results, it was determined that all positive samples were received from March to July, with no more positive samples in the following months. Accurate viral detection and timely quarantine played an important role in preventing the spread of the outbreak, consistent with the reduction in disease incidence in the late phase of the outbreak. Despite its ease, rapidness, and high sensitivity and specificity (Bustin et al., 2005), PCRbased detection simply reflected the presence/absence of the viral infection and the window period of EBOV viremia detection was short (2–21 days) (Rougeron et al. 2015; Uyeki et al. 2016). Serological data regarding the antibody titers among suspected patients in the late phase of the outbreak are yet lacking.
Although commercially available Ebola Zaire virus IgM and IgG ELISA kits have been used previously (Varkey et al. 2015; Broadhurst et al. 2016), limited data are available regarding the sensitivity or specificity of these kits. Moreover, licensed Ebola antibody detection kits, potentially applicable for clinical diagnosis or as a gold standard for laboratory analysis, are still not available. Herein, to better determine IgM and IgG titers of all 877 specimens from patients suspected with EVD during the late phase, two ELISA and Luminex analysis methods developed in-house were first evaluated and compared before further data analysis. ELISA, widely used in serological diagnosis, is rapid and simple and does not rely on large instruments (Lequin 2005). Luminex, a new approach rarely used to detect EBOV, is more sensitive and multiplex than ELISA, and small volumes of sera (diluted 1:1000) are used (compared to 1:100 for ELISA) (Wu et al. 2014; Ayouba et al. 2017). Both methods could be used to detect EBOV IgM and IgG. Previous serological assays in humans and animals generally involved the use of whole viral lysates, thereby increasing the detection spectrum but also increasing the rate of dales-positive findings. Because of the need for a BSL-4 facility to prepare whole viral lysates via viral culture, we used recombinant proteins to investigate serological characteristics. Upon analyzing ELISA and Luminex results, paired samples were analyzed. A high consistency index, up to 97% and 89.4% for IgM and IgG detection, respectively, was measured, and the results of this comparative analysis presented no significant differences. Despite the lack of information regarding actual antibody titers of all samples because of the lack of a gold standard for determination of antibody titers, our ELISA and Luminex results are still reliable according to the results of the comparative analysis of suspected patients and healthy donors.
The frequency of occurrence of asymptomatic EBOV infections was unclear; however, the negative conversion rate of asymptomatic patients may have explained the emergence of flare-ups (Blackley et al. 2016). Recent studies reported that EBOV can be detected in body fluids including semen and ocular fluid (Varkey et al. 2015; Sow et al. 2016), which indicate the presence of the virus in immune-privileged organs or tissues, wherein EBOV can breach barriers into the blood and trigger antibody responses or new cell signaling pathways. Thus, the persistence of strong antibody responses may also explain the persistence of IgM or/and IgG in the RNA-negative samples of suspected EVD patients. Based on previous findings, the asymptomatic EBOV infection ratios varied widely from 2.4% to 46%. A recent systematic review and meta-analysis also reported that 27% of EVD infections were asymptomatic (Leroy et al. 2000; Dean et al. 2016; Glynn et al. 2017). In the present study, all 877 specimens of Ebola suspected patients were received from an endemic local population during the late phase of the outbreak, and the positive detection rate of viral RNA decreased monthly to zero in August, while IgM and IgG persisted in samples until October and December, respectively. Upon analyzing the time distribution by the date of collection of each specimen, the hysteretic obliteration of antibodies was primarily observed in RNA-negative samples of EVD suspected patients. Viremia in EBOV infections can be observed from day 3 to day 16 or more after symptom onset. IgM responses are usually observed from day 2 to day 11 after symptom onset and persist through at least day 30 in nonfatal infections, and IgG responses are typically detectable in the second week after disease onset and can persist for years (Heinz et al. 2013). Since the outbreak began as early as March 2014, we speculated that these patients with positive EBOV-specific antibody titers were previously infected with EBOV but remained asymptomatic; viremia was resolved such that viral RNA was undetectable but antibody-positive; symptoms described later in those patients may have resulted from other infections (malaria, influenza, etc.) but not Ebola. Furthermore, in samples collected too late for detection, the virus shedding window of some EVD patients may be missed upon real-time PCR analysis. This additionally indicated that serological tests are also supplemental methods in certain situations for patients displaying negative results upon real-time RT-PCR analysis.
Subsequently, we analyzed the IgG and IgM responses via ELISA in 31 RNA-positive samples of patients and observed a reversal of the dynamic trend of decline in viral load and increase in the IgG response in confirmed patients. IgM was undetectable in some patients with positive results upon PCR analysis, whereas IgG antibodies was detected. EBOV IgM was reportedly detected as early as day 2, while IgG was detected 1 week later than IgM and lasted several years (Heinz et al. 2013); furthermore, IgM was not produced in all EBOV-infected patients (Broadhurst et al. 2016). Using different commercial and laboratorydeveloped assays during the 2014–2016 outbreak, IgM antibody responses during EVD varied, ranging from 2 to 11 days following symptom onset and persisting at least 30 days (de La Vega et al. 2015); alternately, in severe EVD cases, complete antibody responses failed owing to rapid deterioration of the patients' condition or effective suppression of the humoral response upon EBOV infection. In addition, the IgM detection kit used in this study was a recombinant NP-based capture ELISA with only three components (rNP labled HRP), which displayed higher specificity but might be less sensitivity than the method detecting with whole inactivated virions (Ksiazek et al. 1999); however, the specificity also decreased upon using the kit involving cell lysate antigens and additional components (Data not shown). Here, in 18 of 31 confirmed cases, IgM was detected positive after disease onset and converted to negativethereafter, the detection time ranging from day 2 to day 30 after symptom onset; while, IgM was detected in only 25 of 663 (3.8%) RNA-negative patients. These results indicate that the IgM kit used in this study was more reliable. Therefore, the recent EBOV infection could be validated when IgM was positive; however, EVD could not be excluded when IgM was negative. It is believed that along with the development of EBOV antibody detection methods of improved specificity and sensitivity, more reliable and complete data could be provided to support EVD diagnosis.
Finally, our study provided a basis to understand the serological characteristics of acute EVD patients and the supplementary role of serological analysis in confirming EBOV infections, along with real-time PCR. Meanwhile, suspected patients displaying a positive antibody detection rate indicated an asymptomatic or previous Ebola infection among the local population. These data stress the significance of comprehensive serological surveillance among both EVD patients and the general population for surveillance of EBOV infections during the late phase of the epidemic.
-
Hundreds of Chinese and Sierra Leonean staff on-site participated in specimen collection, transportation, detection, and data analysis. We especially acknowledge the excellent work of six previous detection teams of China CDC (mobile and fixed lab) and indispensable support (materials and reagents) of the National Institute for Viral Disease Control and Prevention, China CDC. We also express our deep condolences to Dr. Abdul Kamara of the Ministry of Health and Sanitation, Sierra Leone who contributed a lot to this project but passed on after the successful control of Ebola epidemic in Sierra Leone. We also appreciate Dr. Zheng Xing and Dr. Feng Liu for the useful comments of this manuscript. This study was supported by National Mega project for Infectious Disease, Ministry of Science and technology (Grant Nos. 2016ZX10004222-002, 2016ZX10004222-003), National Natural Science Foundation of China (Grant Nos. 81373141 and 81401312) and National key project of Ebola research, National Natural Science Foundation of China (NSFC, Grant No. 81590763).
-
M Liang, JL, DL, GW, FG, AK, M Lebby, and BK designed the study, YL, WW, YS, Xianda Yang, AL, CL, QS, SC, DS, HH, ZZ, Xiuxu Yang, IK, SK, GB, AT, and JL prepared the reagents, assessed the specimens, and acquired the data. YL, M Liang, JL, and DL analyzed the data. YL, SZ, AL, JL, and M Liang wrote and edited the manuscript.
Acknowledgements
Author Contributions
-
The authors declare that they have no conflict of interest.
-
This study did not involve human experimentation, and all the blood samples were collected from Ebola patients with prior consent of the Ministry of Health and Sanitation of Sierra Leone. Biosafety evaluations were approved by the National Institute for Viral Disease Control and Prevention, China CDC. All experimental operations were handled following the Standard Operational Protocol approved by China CDC.

 DownLoad: