


HTML
-
Japanese encephalitis (JE) is a mosquito-borne infectious disease that was first identified in China in 1940. The etiological agent of this disease is Japanese encephalitis virus (JEV), which is transmitted by infected mosquito vectors (Culex sp.) with swine or water birds as amplifiers (Misra and Kalita 2010; Mansfield et al. 2017). From discovery to the late 1980s, JE was a major public health threat for children in Asia due to the high mortality and the severe and long-term neurological sequelae of survivors (Simon and Kruse 2017). However, as a result of extensive vaccination programs, the annual incidence of JE in China dramatically decreased from 20.92/100, 000 in 1971 when no vaccine was available to 0.12/100, 000 in 2011 (Solomon et al. 2000; Gao et al. 2014). Generally, approximately 67, 900 cases of JE occur annually worldwide in endemic countries, of which three-quarters are children under 14 years old because adults are often immune to JE due to at least one natural infection (Campbell et al. 2011).
Human vaccination is considered the single most effective measure for JE control. A SA14-14-2 live-attenuated JE vaccine has been used nationwide (except for Xinjiang, Tibet and Qinghai) in the national Expanded Program on Immunization (EPI) to protect the populations of China from JE since the end of 2007. Two doses of the SA14-14-2 vaccine are required: the first dose at the eighth month after birth and the second as a booster at 2 years of age (an interval of 16 months) (Li et al. 2014). Although JE vaccines have been commonly administered by EPI for more than a decade, a number of reports have still described small JE outbreaks or sporadic JE cases in China, particularly in the southwestern provinces, such as Yunnan, Sichuan, Chongqing and Guizhou (Gao et al. 2014). Most of those JE cases were preschool children and pupils who were inoculated with the JE vaccine (Li et al. 2016). Although it provides highly effective protection within a few years after vaccination (Khan et al. 2016), the SA14-14-2 JE vaccine has shown some limitations, such as an inevitable waning of JEV-specific neutralizing antibodies (nAbs) in vaccinated children after the vaccine booster dose with time elapsed (Pan et al. 2016). As recommended by the WHO guideline, human anti-sera fail to protect against wild JEV infections when the nAb titre drops below 1:10, which may explain the high incidence of JE observed in vaccinated children under 14 years of age.
Yunnan is a southeastern frontier province in China with a tropical and subtropical monsoon climate (Fig. 1). The JE epidemic in Yunnan was first reported in 1952 and since has become frequent throughout the province. From 1968 to 2007, the most effective immunization strategy was a one-time campaign in the primary target population during the epidemic season (from May to October) in Yunnan. The P3 inactivated JE vaccine was used from 1968 to 1988 and then replaced by the SA14-14-2 live-attenuated JE vaccine in 1989. The EPI has conducted province-widely since late 2007 and early 2008. According to data from the Yunnan Institute of Parasitic Diseases, although Yunnan maintains the highest two-shot inoculation rate nationwide with a rate of almost 98% at the end of 2015, this area is still highly endemic with an average of 370 reported JE cases annually, representing an incidence rate of 0.75/100, 000 from 2005–2015. More than 70% of cases are younger than 14 years of age, and most of them have a clear history of JE vaccination. This situation has highlighted the need to survey long-term seroprevalence against JEV post-immunization to increase understanding of JE pathogenesis.

Figure 1. The geographic location of the serum sample collection site in Zhaotong City, Yunnan Province, China. Maps were created using an online map website (http://www.tianditu.gov.cn/).
The aim of the present study was to investigate the seroprevalence of anti-JEV antibodies and the seroprotective efficacy of the vaccinated sera grouped by both different nAb titres and different time periods after booster among 300 JE-vaccinated children in Zhaotong City of Yunnan Province and to define the persistence of and decrease in antibodies. In addition, we further elucidated the correlation between the nAb levels in the vaccinated sera and seroprotective efficacy against JEV challenge in mice.
-
Here, we report a small-scale serosurvey for anti-JEV antibodies conducted in Zhaotong City (northeastern Yunnan) in 2017. As part of the JE surveillance project in Yunnan, a total of 300 serum specimens (142 males and 158 females) were collected from healthy JE-SA-14-14-2-vaccinated children in Zhaotong on 22 June 2017. The subjects ranged in age from 3 to 10 years old (born after 2007), and the time postbooster immunization was grouped in annual increments (from 0.5 to 1.5 years to 7.5–8.5 years). All serum samples for the serosurvey of anti-JEV antibodies were stored at - 80 ℃ prior to use.
-
Vero cells were maintained at 37 ℃ with 5% CO2 and cultured in minimum essential medium (MEM, Gibco, USA) supplemented with 5% foetal bovine serum (FBS, Gibco, USA). The Aedes albopictus mosquito cell line, C6/36, was cultured at 28 ℃ in RPMI-1640 medium (Invitrogen, USA) with 10% FBS. JEV (Beijing-1 strain) was propagated in C6/36 cells in this study. The 6- to 8-weekold female BALB/c mice were purchased from Vital River Laboratories (China) and maintained in a specific pathogen-free environment.
-
The serosurvey for anti-JEV IgG antibodies in serum samples from vaccinated children was performed with antiJEV IgG detection ELISA test kits (Shanghai B & C Biological Technology, China) according to the manufacturer's instructions. Briefly, the diluted sera (1:41) were added to the assay plate, which was pre-coated with avidinbiotinylated JEV-specific antigens (barring interference from the cross-reaction with dengue virus), and incubated at 37 ℃ for 30 min. Then, an enzyme-labelled anti-human IgG (H+L chain) monoclonal antibody was added and incubated at 37 ℃ for 30 min. Finally, tetramethylbenzidine as a colour developer was added and incubated at 37 ℃ for 10 min, followed by 2 mol/L H2SO4. The absorbance was measured at 450 nm using an ELISA reader (Thermo, USA). The kit includes negative and positive controls, and the results are based on a sample cutoff optical density value.
-
As described previously (Wang et al. 2018), heat-inactivated serum samples (at 56 ℃ for 30 min) were two-fold serial diluted (from 1:5 to 1:160) and then mixed with an equal volume of solution containing 100 plaque forming units (PFUs) of JEV. After incubation at 37 ℃ water-bath for 1 h, the mixtures were added to a Vero cell monolayer grown in 24-well plates and incubated for 1 h. After removing the mixture, the Vero cells were continuously cultured under overlay medium containing 1.2% methylcellulose for 5 days until plaque formation; then, the plaques were stained with crystal violet and counted. The reciprocal of the highest dilution resulting in PRNT50 compared to that of an unvaccinated control serum was recorded. The geometric mean titre (GMT) was calculated for each time period group. A human anti-JEV nAb titre of 1:10 is considered to correlate with protection against wildtype JEV challenge (Hombach et al. 2005) and has been applied in this study. The seropositive cut-off value for anti-JEV nAbs was defined as a PRNT50 ≥ 1:10 (i.e., a PRNT50 < 1:10 was defined as negative). To calculate the GMT in each group, a nAb titre less than 1:10 was set to 1:5. To define differences in the 300 serum samples with different PRNT50 titres, the samples were grouped into the following four categories: seronegative (< 1:10), low (1:10–1:40), medium (1:40–1:160), and high (above 1:160) (Van Gessel et al. 2011).
-
For the passive transfer experiment, BALB/c mice at 6–8 weeks of age were randomly allocated into 11 groups (n = 10 mice/group). Each mouse received 0.5 mL of human pooled serum from each nAb titre group via intraperitoneal (i.p.) inoculation. Twelve hours later, all mice were challenged with 1 × 10⁴ PFUs (50 LD50) of the JEV Beijing-1 strain by the i.p. route (Wu et al. 2003; Van Gessel et al. 2011). Post-infection, the mice were monitored for daily body weight changes and survival rates. Until day 21, mice without significant body weight changes were considered protected. On day 21, all survivors were humanely euthanized.
-
The statistical analyses were performed with SPSS (version 17.0, USA). The Chi square test was used to assess differences in seropositive rates between genders. The linearby-linear association was used to analyse the association between the seropositive rates with an increase in age or elapsed years post-booster dose. The survival time in days and the median days of survival were estimated by the Kaplan–Meier method. Linear regression was used to compare the equality of the survival rate for each distinct nAb titre (lg) in different year periods. The effect protective titre (EPT50) for nAbs in the vaccinated sera was generated and calculated from a linear regression model. P values < 0.05 were considered significant.
Study Site, Serum Sample Collection and Grouping
Cell lines, Virus and Mice
Enzyme-Linked Immunosorbent Assay (ELISA)
Plaque Reduction Neutralizing Test (PRNT)
Adoptive Transfer Experiment
Statistical Analysis
-
Zhaotong, which is the city where the serum samples were collected, is located at the intersection of Yunnan, Guizhou and Sichuan (Fig. 1). The hypsography is southern high and northern low-lying with an average altitude of 1, 685 meters, and the area is located between north 26°–28° latitude and east 102°–105° longitude. The areas have a typical continental monsoon climate that is characterized by wet and rainy summers, which is conductive to viral spread and transmission by vectors. According to data from the Yunnan Institute of Parasitic Diseases, JE cases were first reported in 1955 in Zhaotong. The annual incidence was 1.32/100, 000 from 1955 to 2010, which was two times the province average and was listed in the province-wide top three locations. JE has been sporadically spreading in this area and has a high mortality rate. Cases in children less than 14 years of age account for more than 87% of the total, which is far above the world or national average (70%–75%) (Campbell et al. 2011). August is the peak month for the disease in Zhaotong.
-
The seropositive rates to JEV detected by ELISA are shown in Fig. 2A and Supplementary Table S1. The variation trend in IgG was assessed by year post-booster vaccination (by 1-year classes) in this study. Generally, the overall seroprevalence of IgG to JEV was 46% (138/300) in samples from 300 vaccinated children. No significant differences were observed in overall seropositivity between males and females (χ2 = 0.006, P = 1.000, Supplementary Table S1), indicating that gender was not a crucial factor for the IgG seropositive prevalence to JEV.
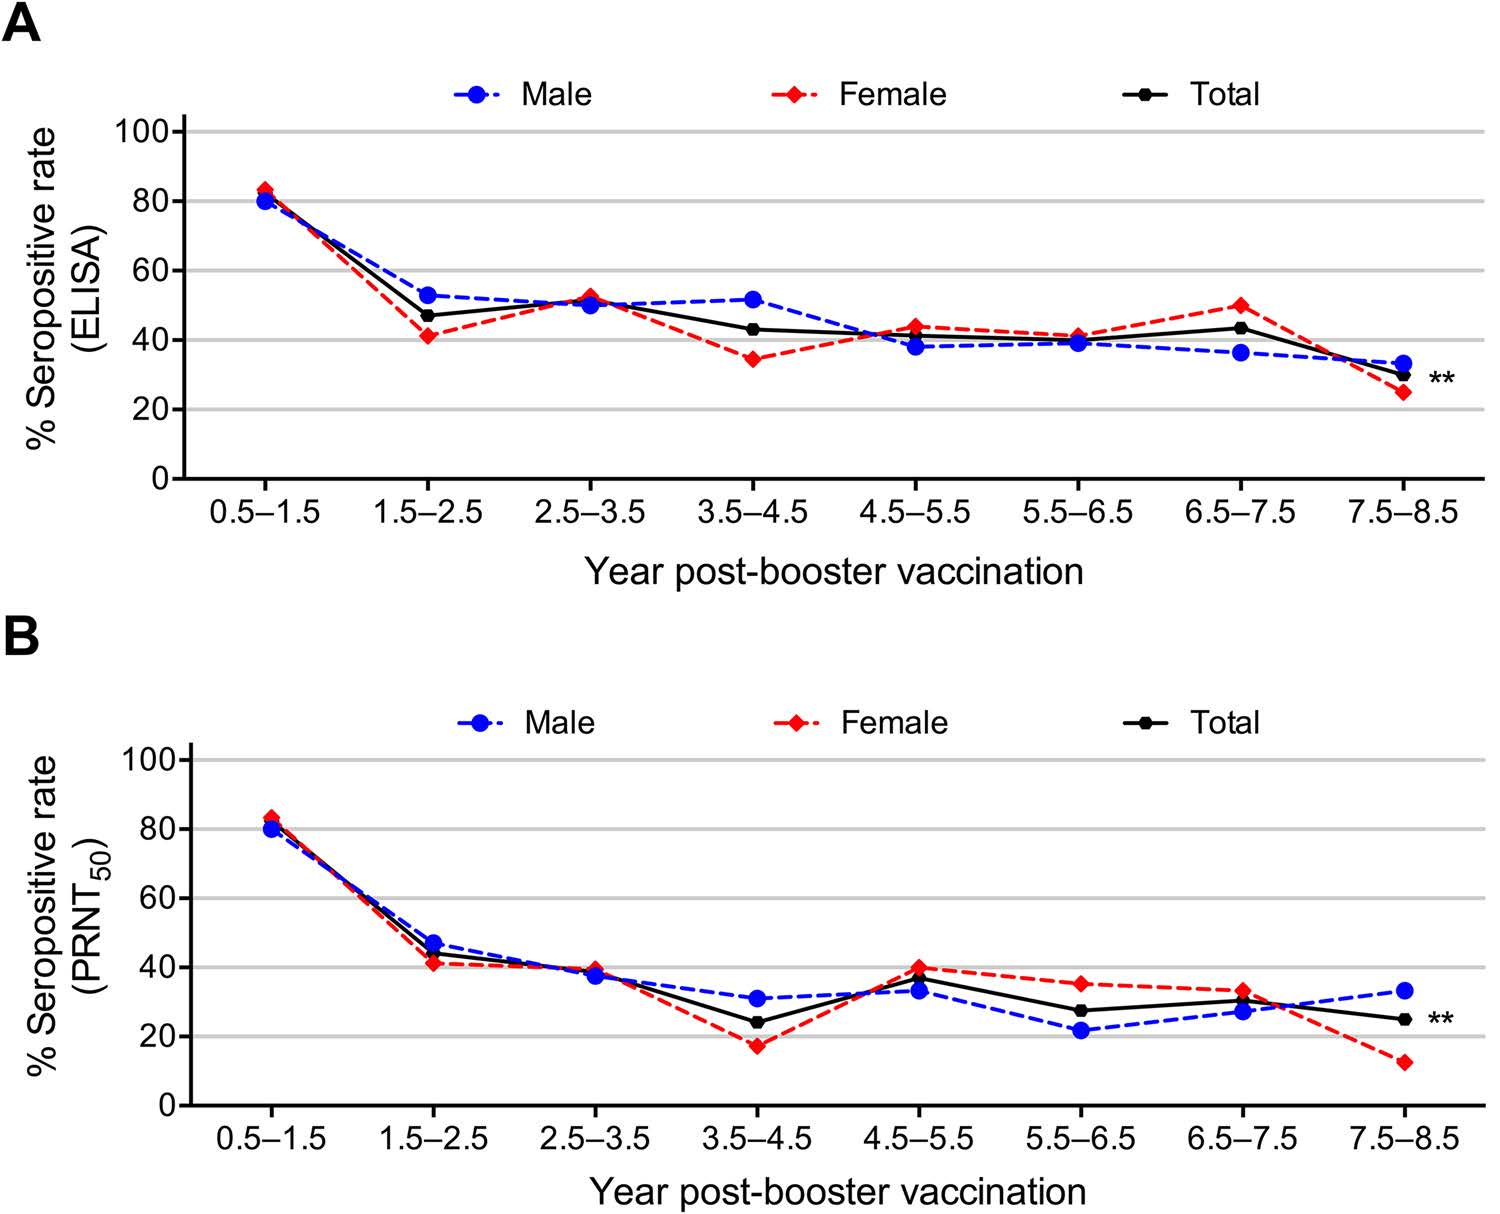
Figure 2. Seropositive rates of anti-JEV antibodies detected by A ELISA and B a PRNT50 ≥ 1:10 in different years post-booster dose (by 1-year classes). Asterisks indicate significant differences among the overall total subjects, ** P < 0.01.
A linear association was found between time elapsed after the booster vaccination and waning of the seropositive rates of JEV-specific IgG (Fig. 2A, Supplementary Table S1). Waning of the seroprevalence of anti-JEV IgG was found with the elapse of time after the booster (χ2 for linear trend = 7.447, P = 0.006). As shown in Fig. 2A, the peak anti-JEV IgG seroprevalence was observed in the first 0.5–1.5 years (up to 82%), markedly decreased at approximately 2.5 years and then presented a plateau-like trend to 7.5–8.5 years with the lowest seroprevalence of 30% after booster vaccination (Fig. 2A). Remarkably, the anti-JEV IgG seroprevalence displayed linear trends when the waning trend was analysed for male or female vaccinated children alone, indicating that gender was not a crucial factor for the IgG seropositive prevalence to JEV (Fig. 2A).
-
In this study, the PRNT was performed to evaluate the seroprevalence of anti-JEV nAbs. As shown in Fig. 2B and Supplementary Table S2, the overall nAb seropositive rate was 36% (107/300), and no obvious differences were observed for nAb seroprevalence by gender (χ2 = 0.158, P = 0.718, Supplementary Table S2). The seroprevalence of anti-JEV nAbs was 82% at 0.5–1.5 years and then decreased gradually over time to 25% at 7.5–8.5 years after booster vaccination, suggesting an overall linear trend between the waning and the elapsed time after booster vaccination (χ2 = 10.103, P = 0.001, Fig. 2B, Supplementary Table S2). Likewise, the anti-JEV nAb seroprevalence in male or female vaccinated children displayed significant linear associations with the year post-booster (Fig. 2B).
-
In this study, we also analysed changes in the 50% plaque reduction (PRNT50) titres against JEV among 300 serum samples grouped by year post-booster (Fig. 3, Supplementary Table S3). High (> 1:160) anti-JEV nAb levels were not found in any of the time period groups. Medium (1:40–160) levels were detected in 23% of the serum samples collected in the first 0.5–1.5 years after the booster dose.Then, the JEV-specific nAb seroconversion rate and the nAb titres decreased with the time elapsed post-booster vaccination (Fig. 3, Supplementary Table S3). Similarly, the GMT of the anti-JEV nAbs fell gradually from 1:28.9 at 0.5–1.5 years to 1:7.3 at 7.5–8.5 years.
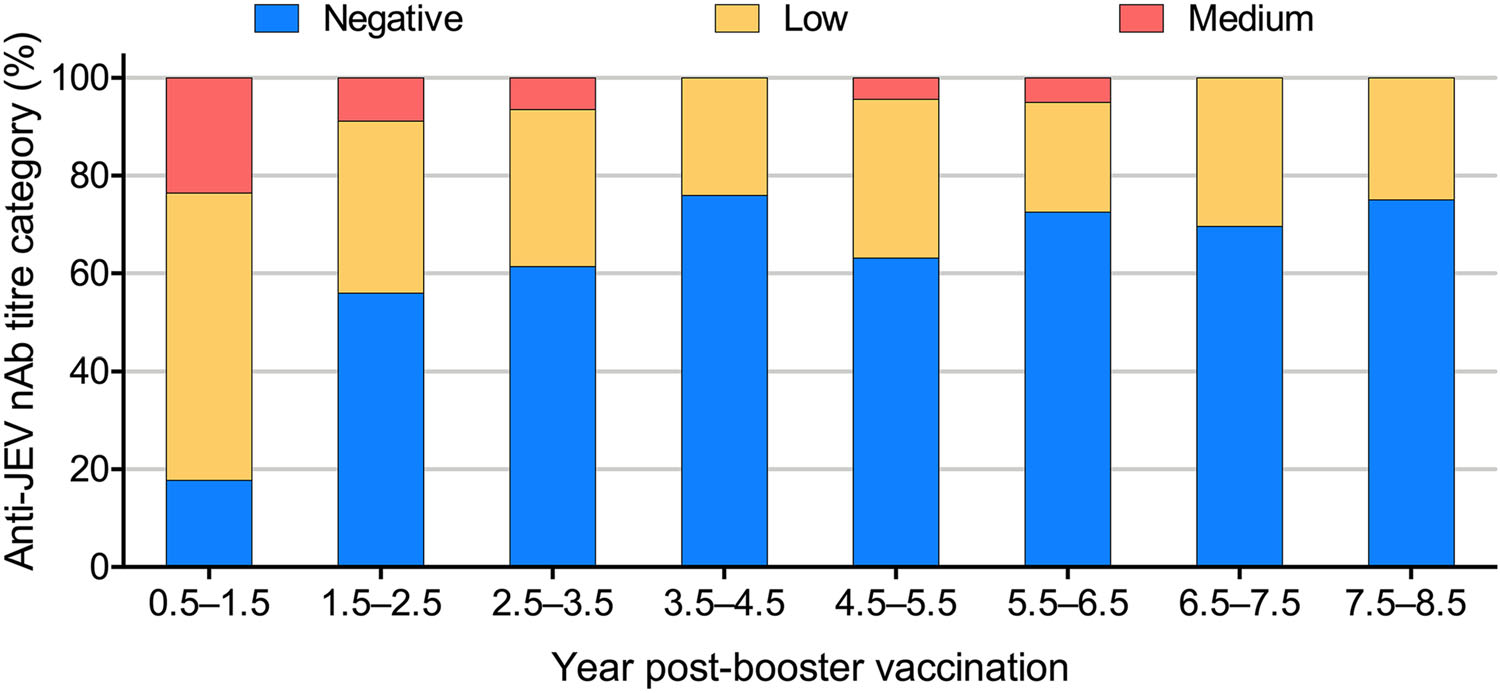
Figure 3. nAb (PRNT50) titres of anti-JEV neutralizing antibodies in different years post-booster dose (by 1-year classes).
-
Factors associated with the seroprevalence to anti-JEV antibodies were analysed based on the ELISA or PRNT50 criteria. As shown in Table 1, the anti-JEV antibody seropositivity detected by ELISA was higher than that defined by a PRNT50 ≥ 1:10. Although a gap existed between positive seroconversion determined by the two methods (Fig. 2, Supplementary Table S1, S2), generally the changed trend observed by ELISA was consistent with that of the PRNT50. When the year post-booster was used as an index measurement, their respective highest (0.5–1.5-year group) and lowest (7.5–8.5-year group) values had good coincidence (Fig. 2). In addition, the anti-JEV IgG seropositivity rate (46%) detected by ELISA was higher than the overall anti-JEV nAb seropositive rate (36%). In other words, none of anti-JEV nAb seropositive subjects determined by PRNT50 were anti-JEV IgG seronegative by ELISA. This finding indicated that the seroprevalence of anti-JEV nAbs had higher reliability in evaluating the risk for JEV infection than anti-JEV IgG.

Table 1. Sensitivity differences between ELISA and PRNT50 for the determination of seropositivity against Japanese encephalitis virus.
-
The vaccinated sera were pooled into three groups according to the nAb level (negative, low and medium) during different periods based on the year post-booster (by 2-year classes, Table 2). To more precisely elucidate the association between the nAb titre and substantial protective efficacy, pooled nAb titres were evaluated and compared to the calculated input nAb titre before passive transfer into mice. As shown in Table 2, the pooled nAb titres are basically consistent with the input nAb values (Table 2). The medium pooled nAb titres in sera from the 0.5–2.5, 2.5–4.5, and 4.5–6.5-year periods were 1:105.6, 1:91.9, and 1:80.0, respectively (Table 2). Mice that received those sera showed no significant body weight changes and 100% of them survived when challenged with 50 LD50 of JEV, indicating effective protection (Fig. 4A, 4B). Surprisingly, sera collected from the 0.5–2.5-year period, which had a low nAb titre of 1:34.8, also showed 100% protection, indicating that other factors were involved in protection during this period. The low pooled nAb titres in the sera from 2.5–4.5 and 4.5–6.5 years were 1:30.3 and 1:26.4, respectively (Table 2); mice that received those sera had slight body weight losses (Fig. 4A) and 60% and 80% of them survived, respectively (Fig. 4A, 4B). A low nAb titre of 1:23.0 was detected in sera collected from the 6.5–8.5-year period, and no protection was observed when mice were passively immunized with the sera, similar to the protection level provided by the nAb seronegative sera. The median survival for the group with the low titre (6.5–8.5) was 10 days, which was slightly longer than that of all seronegative groups (7–8 days, Table 2). These results suggest that sera with medium nAb titres in all year periods and with low nAb titres in the early year periods could provide full protection from JEV challenge in mice. Conversely, long-term sera with low nAb titres or seronegativity exhibited limited or no protection. Additionally, a positive correlation was found between the pooled nAb titre (lg) and the final survival rate at day 21 (coefficient of determination 0.8122, Fig. 4C). Furthermore, the EPT50 value, which is the nAb titre in silico required to effectively protect half of the mice (50% survival rate) after JEV challenge during the observation period, was calculated from the slopes of the curves using regression analysis. As shown in Fig. 4C, an EPT50 of ~1:21.3 for nAbs was necessary in our study, which was higher than the recommended value in the WHO position paper (1:10).
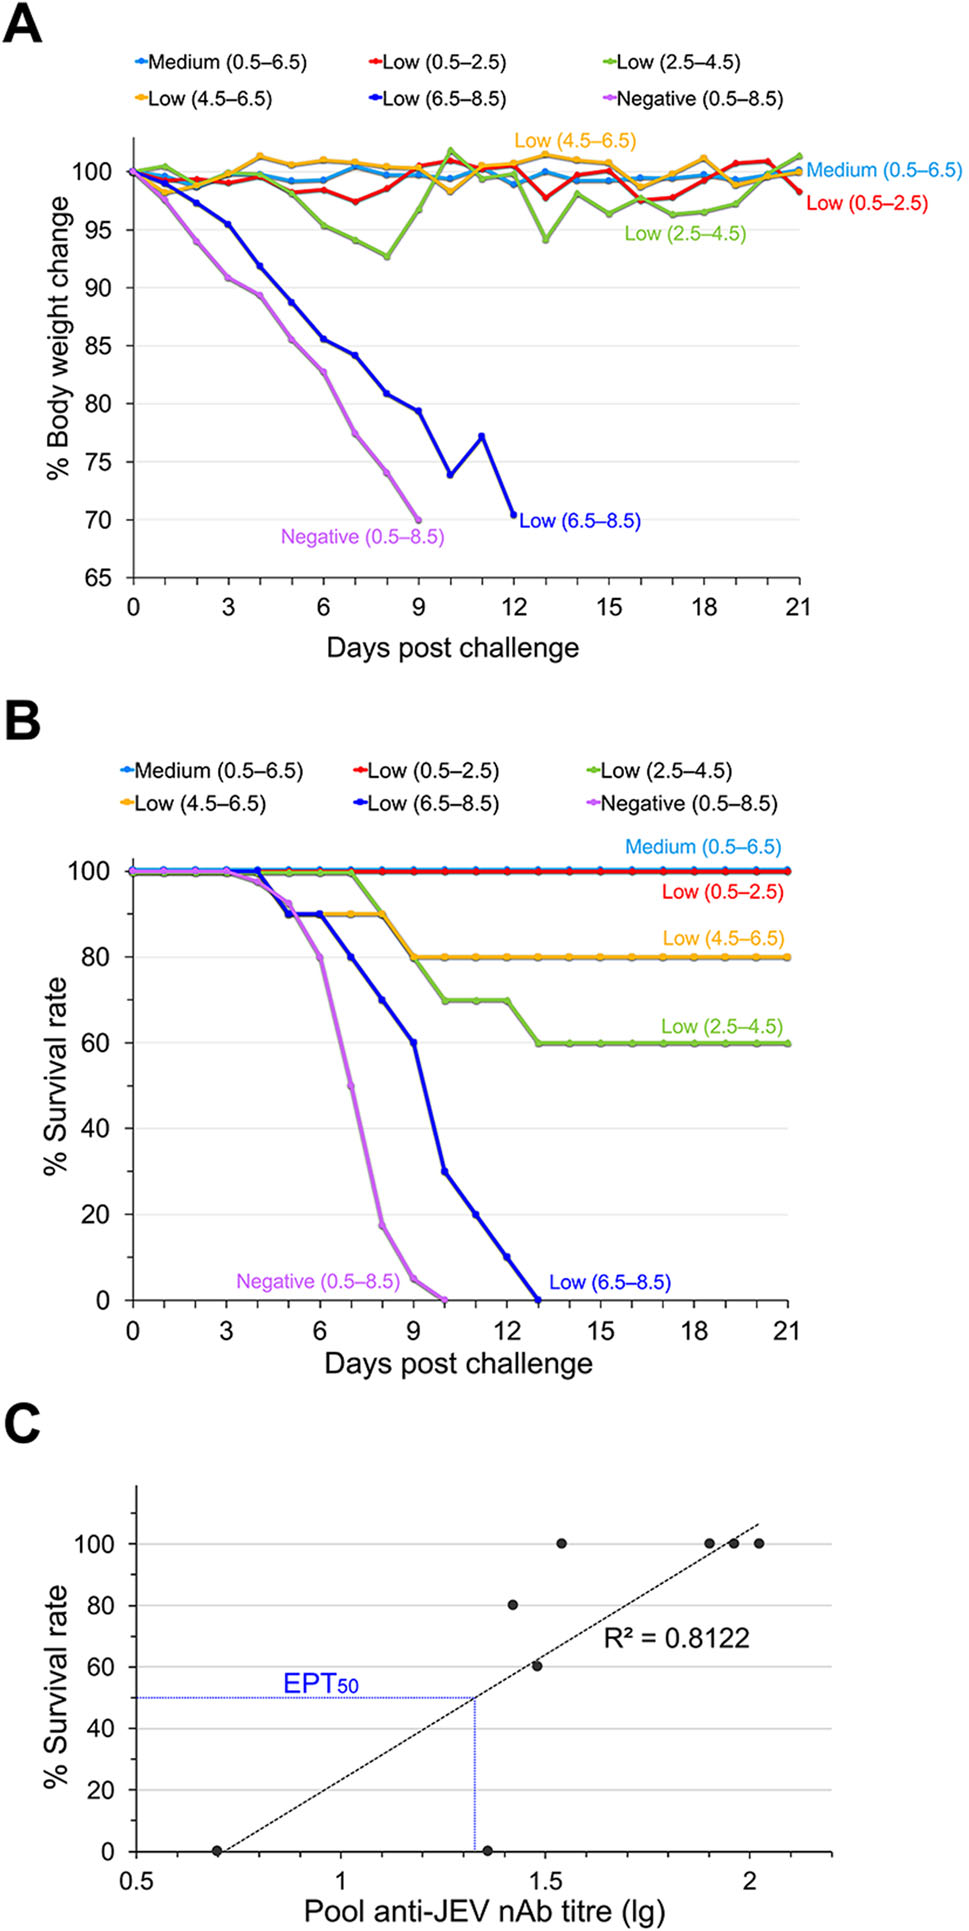
Figure 4. Protective efficacy of human vaccinated sera based on passive transfer in mice. Groups of BALB/c mice (n = 10) were treated with human sera from vaccinated children and challenged with JEV (Beijing-1 strain) 12 h later. The mice were observed daily for 21 days. A Body weight changes and B survival curves. C Correlation of pooled nAb titres and the probability of survival against JEV. The pooled titre was lg transformed and plotted against final survival at day 21. R2 represents the coefficient of determination. The blue dotted line shows that the calculated EPT50 for nAbs of 1:21.3. Asterisks indicate significant differences among the overall total subjects.

Table 2. Experimental groups and survival data from mice passively inoculated with the sera/JEV mixture.
Spatial and Epidemiological Features of the Study Site
Waning Trend of Seropositive Rates to JEV after the Booster Dose
Waning Trend of Anti-JEV nAbs after Booster Vaccination
Reduction of Anti-JEV nAb Titres after Booster Vaccination
Seroprevalence of Anti-JEV nAbs Had Higher Reliability in Evaluating the Risk for JEV Infection
Vaccinated Sera with Different nAb Titres Showed Varying in Vivo Protective Efficacies in Mice
-
Children are the group most susceptible to JEV. Although JE cases have been significantly reduced by the extensive vaccination programs aimed at children in recent years, the incidence among children is still the predominant contributor in China (over 70% of the total incidence) (Wang and Liang 2015). Yunnan province is one of the forefront JE epidemic zones in China. Since the end of 2007, implementation of the EPI has significantly reduced the morbidity and mortality of JE in Yunnan. However, according to a report from the Yunnan Institute of Parasitic Diseases, 1015 JE cases occurred from 2004–2010 in Zhaotong City, which was our study site and a representative JE endemic area in Yunnan. In particular, 87% of these cases were children aged under 14 years old, including preschool children and pupils who were vaccinated with SA14-14-2.
To explore the persistence of anti-JEV antibodies postvaccination, 300 samples were collected from SA14-14-2-vaccinated children in Zhaotong City and the seroprevalence of anti-JEV antibodies was investigated in this study. The results demonstrated that the waning trends of seropositive rates of anti-JEV IgG antibodies and nAbs as well as their titres in vaccinated children decreased with the elapsed time since the booster vaccination (Figs. 2, 3, Supplementary Tables S1–S3). Gender-related waning of anti-JEV antibodies was alsofound to have an obvious linear trendwith the elapsed time.
Our results were supported by several reports on JEV seroepidemiological surveillance (Tseng et al. 2003; Hombach et al. 2005; Pan et al. 2016). Pan et al. collected 570 serum samples from a community population aged from 0 to 92 years old in Zhejiang Province, China. They found that the positive rates for anti-JEV antibodies were quite low in children and adolescents and then increased with age, which was considered to be linked with the increased opportunities for JEV natural infection with age (Pan et al. 2016). In Asia, where the vaccination policy spans over 40 years, anti-JEV antibody attenuation was observed with both the increasing age of the children and the elapsed time after the booster vaccination (Xin et al. 1988; Luo et al. 1994; Tseng et al. 2003; Hombach et al. 2005; Pan et al. 2016). The humoral immune response induced by the live attenuated vaccine is mainly responsible for protective efficacy against JEV infection (Saxena and Dhole 2008). Thus, taken together, the gradually lowered seroprevalence and the waning of the anti-JEV antibody titre may be associated with the high JE incidence among children in China.
Several factors are considered to be associated with the waning of anti-JEV antibodies. Conventionally, anti-JEV antibodies transferred from maternity decay in infants, and then booster vaccination induces a surged antibody response that gradually declines again during adolescence (Pan et al. 2016). Nevertheless, generally the antibody level rises in adults and elders, who experience at least one natural JEV infection due to accumulated exposure in their lifetime (Hsu et al. 2014). Natural infection, including inapparent and subclinical infections, can trigger longlasting and stronger maintenance of anti-JEV antibodies and anamnestic immune responses than vaccination (Konishi et al. 2010; Baldovin et al. 2012; Lee et al. 2012). However, in recent years, ecological changes in epidemic areas, such as urbanization with shrinkage of rice fields and pig farms, has significantly reduced the natural exposure of humans to JEV vectors, which may be responsible for the shortened persistence of JEV antibodies (Tseng et al. 2003). Regardless of the cause, the waning of antibodies with the elapsed time post-immunization seems inevitable, which indicates a necessity for strengthening periodic surveillance of the seroprevalence of anti-JEV antibodies to assess the risk for JE in children, at least to some degree (Hegde and Gore 2017).
This study evaluated antibody levels by both ELISA and PRNT50. ELISA is usually used to detect the anti-JEV IgG level, which includes neutralizing and non-neutralizing antibodies. However, ELISA is a non-specific assay for determination of flavivirus antibodies due to cross-reactivity. PRNT50 is always considered a useful parameter for measuring nAb levels, which represent an effective protective component against JEV. Infections by other flaviviruses in the study site could be responsible for these cross-reactive antibodies, which result in subjects seropositive by ELISA but seronegative by PRNT50. According to the WHO position paper, a serum sample with a nAb titre ≥ 1:10 is considered to have protective potential (Hombach et al. 2005; Hegde and Gore 2017). We found that the proportion of nAb-negative subjects increased gradually with the year post-booster and that the GMT of anti-JEV nAbs showed a decreased trend over time, suggesting that the substantial protective component of sera against JEV would wane with elapsed time (Fig. 3, Supplementary Table S3). The seroprevalence of anti-JEV antibodies determined by PRNT50 and ELISA had similar waning trends with the year post-booster vaccination (Fig. 2, Table 1, Supplementary Table S1, S2). This result indicated that both JEV-specific nAbs and IgG were necessary for judgement of seroprevalence, substantial protection and assessment of the JE risk of an individual.
nAbs arguably play the essential role in protection against JEV infection (Konishi et al. 2003). In this study, vaccinated sera were pooled according to both the nAb titre and the year post-booster and then passively transferred to mice to measure the substantial protection provided by the sera. As expected, medium pooled nAb titres provided effective protection against JEV infection, low pooled nAb titres only partially protected, and seronegative sera offered no protection in mice. Surprisingly, a low nAb titre of 1:34.8 in sera collected from the 0.5–2.5-year period also showed full protection, indicating the involvement of other protective components in sera during the early period postvaccination, such as CD4+ and CD8+ T cell responses (Lee et al. 2016; Turtle et al. 2017) and immune memory reaction (Hombach et al. 2005).
The nAb titre presented by PRNT50 is still the best andmost widely accepted parameter for determining anti-flavivirus nAbs since the 1960s (Monath et al. 2011). Nevertheless, use of the PRNT50 titre as a surrogate marker for protection is controversial and not absolute (Buddhari et al. 2014; Sirivichayakul et al. 2014). In our study, the nAb titre measured by PRNT50 had a positive correlation with in vivo protection against JEV in mice, which suggested that PRNT50 was a credible prediction parameter for assessment of protection. Moreover, the EPT50 of human sera was calculated as 1:21.3 based on correlation with protection in mice, which was higher than that required in humans and might be a reference value for evaluating the protective efficiency of sera.
This study has some limitations. Firstly, as described previously, although the immunological mechanism of protection provided by the JE vaccine has not been defined and universally accepted by the virological community, there is a growing consensus that T cell immunity makes an important contribution to the protection induced by the SA14-14-2 vaccine (Sohn et al. 2008; Liu et al. 2011; Turtle et al. 2017); here, protection was observed in some immunized animals even though nAbs were undetectable (< 1:10) (Oya 1988; Van Gessel et al. 2011). Due to sample limitation, we failed to evaluate cellular immunity against JEV. In the follow-up study, cellular immune response and anamnestic responses will be analyzed using peripheral blood mononuclear cells isolated from vaccinated individuals. Secondly, we were unable to trace the kinetic waning of anti-JEV antibodies in each subject but instead grouped them by elapsed time post-booster immunization. Thirdly, the study site was limited to Zhaotong City, which is one JE endemic area in Yunnan, and thus the results cannot be representative of a broader setting. Therefore, systematic serological surveillance for JEV with an enlarged sample size must be conducted at multiple study sites to provide available data for implementation of the EPI and assessment of high-risk populations.
Here we should point out that the inevitable waning of nAb with time may be a common phenomenon of vaccination, similar as that observed in SA14-14-2 vaccinated children in our and other studies. However, SA14-14-2 is safe and highly immunogenic and still one of the leading licensed and effective JE vaccine. SA14-14-2 is used in not only whole China but also in many Asian countries. Vaccination of SA14-14-2 has dramatically decreased JE incidence. For examples, in Guizhou, a JE-endemic province of China, over the period 1971–2009, JE cases had decreased dramatically due to SA14-14-2 vaccination (Zhang et al. 2012); the protective effect of single dose of SA14-14-2 after 12–15 months among Nepalese children was 98.5% (Ohrr et al. 2005), and introduction of JE vaccine into routine childhood immunization results in sizable reductions in JE cases (Upreti et al. 2017); similarly, single dose of SA14-14-2 was highly effective in preventing JE among Indian children below 15-year-old of age (Tandale et al. 2018). These reports should facilitate the use of SA14-14-2 as a routine component of immunization programs in more and more Asian countries.
In conclusion, this study revealed that waning of both anti-JEV seropositivity and its nAb titres were closely associated with the elapsed time and that the nAb titres of vaccinated sera showed positive correlations with protective efficacy in vivo. Our results provide some evidence for understanding the dynamic changes of antibodies induced by the SA14-14-2 live-attenuated JE vaccine over time and will benefit potential policies in related fields.
-
This work was supported by grants from the National Natural Science Foundation of China (81471957, 81772172, 81671971, U1602223 and 81871641) and a grant from the Open Research Projects of Key Laboratory of Beijing Ditan Hospital, Capital Medical University (DTKF20 1705). These funding sources played no part in the decision to publish, data analysis, or writing of the manuscript.
-
RW designed and performed the experiments, analysed the data and wrote the manuscript; LX collected serum samples, demographic information from the vaccinated children and informed consent; NG analysed the data. DF contributed reagents and materials; HC and PW helped with the experiments; HZ designed the research and organized the collaboration; JA principally designed the experiments, revised the manuscript, organized the collaboration and directed the project. All authors read and approved the final manuscript.
-
The authors declare that there are no competing interests.
-
All animal experiments were performed under approval of the Institutional Animal Care and Use Committee of Chinese Capital Medical University. All animal experiments were performed under diethyl ether anaesthesia, and all efforts were made to minimize suffering. This study was performed in strict accordance with institutional review board approval from the Ethics Committee of Yunnan Institute of Parasitic Diseases, China. Written informed consent for serum sample collection was obtained from the parents or legal guardians on behalf of the vaccinated children. Their guardians completed questionnaires including demographic information and their integrated JE vaccination history. According to records from the local Centre for Disease Control and Prevention, these children had received two doses of the SA14-14-2 JE vaccine (Chengdu Institute of Biological Products, China).
Conflict of interest
Animal and Human Rights Statement
-

Table S1. Seroprevalence of antibodies against Japanese encephalitis virus detected by ELISA.

Table S2. Seroprevalence of antibodies against Japanese encephalitis virus detected by PRNT50.

Table S3. Categories of anti-JEV nAb titres against Japanese encephalitis virus.

 DownLoad: