


HTML
-
African swine fever (ASF) is a lethal hemorrhagic disease that causes up to 100% mortality in wild boar and domestic swine (Hess, 1982). The etiological agent of ASF is African swine fever virus (ASFV), a large, double-stranded DNA virus. ASFV is the only member of the family Asfarviridae, genus Asfivirus. It is as a DNA arbovirus transmitted by ticks of Ornithodoros spp. (Costa, 1990; Salas et al., 1999; Dixon, 2000; Kleiboeker and Scoles, 2001).
ASF was first described in Kenya in 1921 (Eustace Montgomery, 1921). Subsequent outbreaks occurred in a number of European countries (Costard et al., 2009a). More recently, ASF was introduced to Georgia in the Caucasus region in 2007 (Rowlands et al., 2008). Early in 2014, cases of ASF in wild boars were reported in the European Union in areas bordering Belarus (Gallardo et al., 2014; Pejsak et al., 2014). ASF has a severe socioeco-nomic impact in those countries in which it has been reported. For instance, the total cost of ASF prevention or eradication was estimated to be almost US $4500 million in the USA and up to US $92 million in Spain (Costard et al., 2009b). In Russia, the economic loss caused by ASF was estimated as US $94 million in 2011 (Callaway, 2012).
Currently, there are no commercially available vaccines to prevent ASF, so research is required to develop an effective vaccine. Prevention and control efforts primarily rely on rapid and reliable laboratory diagnoses and strict sanitary measures. Previous studies have tested the efficacy of vaccines against ASF. However, inactivated vaccines did not provide effective protection for pigs (Forman et al., 1982). Attenuated ASFV vaccines generated from tissue culture adapted or low-virulence isolates provided protection, but only against homologous challenge; moreover, the use of attenuated vaccines also carries the risk of persistent viral infection in vaccinated swine, and the risk that the vaccine strain will revert and become virulent. Thus, the current vaccine strategies are inherently limited in their application (Leitão et al., 2001; Boinas et al., 2004). Attempts to produce a recombinant vaccine based on the ASFV p30, p54, p72, and p22 proteins expressed in a baculovirus system failed to protect pigs after they were challenged with a virulent virus (Neilan et al., 2004). A DNA vaccine that encodes three viral determinants (secretory hemagglutinin [sHA], p30 and p54) fused to ubiquitin, developed by Argilaguet et al., only conferred partial protection (Argilaguet et al., 2012).
In the 1990s, reverse genetics systems were developed to manipulate the genes of many non-segmented negative strand RNA viruses (NNSV), which allowed their use as vaccine vectors (Schnell et al., 1994). Newcastle disease virus (NDV) is one such NNSV vector that is a promising vaccine vector candidate when modified to express one or more protective antigens. NDV belongs to the genus Avulavirus in the family Paramyxoviridae and has a single-stranded, negative-sense RNA genome containing six genes (3'-NP-P-M-F-HN-L-5') (de Leeuw and Peeters, 1999). NDV isolates can be divided into three pathotypes based on their pathogenicity in chicks: lentogenic (avirulent), mesogenic (moderately virulent) and velogenic (virulent) (Alexander, 1989). Lentogenic NDV strains are widely used worldwide in live attenuated vaccines. NDV expressing protective antigens from the rabies virus and highly pathogenic H5 avian influenza virus were immunogenic and provided protection from challenges (Bukreyev et al., 2005; Ge et al., 2011). In addition, recombinant NDV expressing the norovirus capsid protein was shown to be safe and efficacious in a mouse model (Kim et al., 2014b). Using NDV as a vector for mammalian vaccine development offers a number of advantages including high attenuation, absence of preexisting immunity, cost-effective production, and reduced labor costs, all of which support the potential for large-scale manufacturing.
ASFV protein 72 (p72) is a major structural protein that contains a conformational neutralizing epitope and elicits robust immune responses (Carrascosa et al., 1986; Garcia-Barreno et al., 1986; Borca et al., 1994; Garcia-Escudero et al., 1998), and can also be recognized by porcine cytotoxic T lymphocytes (Leitão et al., 1998). Therefore, the primary purpose of this study was to construct a live NDV vectored vaccine expressing ASFV p72, termed rNDV/p72, and evaluate the induction of humoral and cellular immune responses to rNDV/p72 in a mouse model.
-
Baby hamster kidney (BHK-21) cells (ATCC No. CCL-10) were used to produce and titer viruses. The cells were grown in Dulbecco s minimal essential medium (DMEM) supplemented with 10% fetal bovine serum (FBS), 100 U/mL penicillin and 100 μ g/mL streptomycin in an incubator (37 ℃, 5% CO2). BHK-21 cells infected with rescued viruses were grown in 6-well or 24-well plates in fresh Opti-MEM with 0.1 μ g/mL of Tosyl phenylalanyl chloromethyl ketone (TPCK) trypsin. The modified vaccinia virus strain VVT7 expressing the T7 RNA polymerase was provided by Dr. Zhigao Bu, Harbin Veterinary Research Institute, Chinese Academy of Agricultural Sciences (Wyatt et al., 1995; Ge et al., 2015). NDV strain MG7 was modified by changing its naturally-occurring F protein cleavage site motif (RRQKRF) into the motif of the LaSota strain (GRQGRL) for attenuating its virulence. The viruses generated in this study were propagated in the allantoic cavities of 9-day-old specific pathogen free (SPF) embryonated chicken eggs. Viruses were titrated by hemagglutination (HA) assay using chicken erythrocytes.
Four-week-old female BALB/c mice were provided by the Laboratory Animal Center of Lanzhou Veterinary Research Institute. SPF chickens and embryonated chicken eggs were obtained from Beijing Merial Vital Laboratory Animal Technology Company. All animal studies were approved by the Biosafety and Ethics Committee of Lanzhou Veterinary Research Institute (SYXK-2010-003). Animal care was provided in accordance with the recommendations in the Guide for the Care of Laboratory Animals issued by the institution.
-
The p72 gene was amplified by PCR from the genomic DNA of a Spanish ASFV strain (E70) provided by Centro de Investigaci n en Sanidad Animal (INIA-CISA, Madrid, Spain). The forward primer was: 5'-CCAACTCTGTTTAAAC
TTAGAAAAAA TACGGGTAGAA CGCCACCATGGCATCAGGAGGAGCTTTTTGTCTTAT-3' and the reverse primer was: 5'-CCGCTTGGGTTTAAACGTTAGGTACTGTAACGCAGCTGAAC-3'. The prim-ers contained Pme Ⅰ restriction sites (underlined), the NDV specific gene-end and start transcriptional signals (boxed), and the optimal Kozak sequence (bold). The construct was designed in accordance with the rule of six, which is a requirement for efficient RNA replication (Huang et al., 2001). The p72 gene was introduced into the modified NDV genome using a unique Pme Ⅰ site between the P and M genes (Huang et al., 2001). The p72 gene was also amplified from the genomic DNA of the same ASFV strain (E70) using the forward primer 5'-CCGGAATTCATGGCATCAGGAGGAGC-3' and reverse primer 5'-CCGCTCGAGTTAGGTACTGTAACGCAGCAC-3'. This primer pair contained EcoR Ⅰ and Xho Ⅰ restriction sites (underlined). The PCR products were digested with EcoR Ⅰ and Xho Ⅰ, and then cloned into vector pGEX-4T-1. Recombinant p72 was expressed in Escherichia coli BL21 (DE3) cells by IPTG induction (1 mmol/L) and then purified.The recombinant viruses were recovered from NDV antigenomic cDNAs by transfecting BHK-21 cells with support plasmids expressing the N, P, and L proteins, as described previously (Ge et al., 2007). To evaluate genetic stability, the recovered viruses were passaged ten times in 9-day-old SPF chicken embryos, and the p72 gene was amplified using reverse transcription (RT) -PCR and sequenced for confirmation. The final recombinant NDV expressing the ASFV p72 protein was named rNDV/p72.
-
BHK-21 cells were infected with rNDV and rNDV/p72 at a multiplicity of infection (MOI) of 1. Cell lysates were collected 24 h post-infection (hpi) and analyzed by western blotting using chicken serum against NDV and a mouse monoclonal antibody against p72 (kindly provided by Dr. Shengbo Cao, College of Animal Science and Technology, Huazhong Agricultural University). Horseradish peroxidase (HRP) -conjugated rabbit anti-chicken IgG or goat anti-mouse IgG (Jackson ImmunoResearch, Baltimore, USA) was used as the secondary antibody as appropriate.
-
To determine the growth kinetics of the parental NDV (rNDV) and rNDV/p72, BHK-21 cells in 24-well plates were infected with recombinant viruses at an MOI of 1 or 0.01 in the presence of TPCK trypsin. Supernatant was collected at 12-h intervals until 72 hpi. The virus titer in the collected supernatant was titrated using the 50% egg infectious dose (EID50) assay using the end-point method of Reed and Muench (Reed and Muench, 1938).
-
Pathogenicity of rNDV/p72 was determined by the mean death time (MDT) test in 9-day-old SPF embryonated chicken eggs and the intracerebral pathogenicity index (ICPI) test in 1-day-old chicks. The MDT was determined as the mean time (h) required for the minimum lethal dose of virus to kill all of the inoculated embryos. For the ICPI test, fresh infectious allantoic fluid containing each virus was inoculated into groups of ten 1-day-old SPF chicks via the intracerebral route. NDV strains were categorized into three pathotypes based on the MDT: velogenic ( < 60 h), mesogenic (60–90 h), and lentogenic ( > 90 h). The ICPI is the mean score of all birds per time point for clinical symptoms and mortality over an 8-day period. Each time the chicks were observed, they were scored as follows: 0 if normal; 1 if sick; and 2 if dead. Highly virulent (velogenic) viruses give values approaching 2, while avirulent or lentogenic strains give values approaching 0. To determine the pathogenicity of rNDV/p72 in mice, groups of eight 4-week-old BALB/c mice were anesthetized by inhalational anesthesia with dry ice and inoculated with 108 EID50 of virus via the intramuscular (i.m.) or intranasal (i.n.) route in a volume of 100 μ L or 30 μ L, respectively. Control mice were inoculated with PBS. Three mice from each group were euthanized on day 3 post-infection (p.i.), and the lungs were collected and homogenized in 0.5 mL PBS to titer the virus in SPF embryonated eggs by inoculation of the allantoic cavity. The remaining five mice were observed for clinical symptoms daily for 2 weeks.
-
For the mouse immunization study, groups of 4-week-old female BALB/c mice (five mice per group) were inoculated with either rNDV or rNDV/p72 (100 μ L each, 108 EID50) via the i.m. route. Control mice were inoculated with 100 μ L of PBS. All of the mice received four immunizations at 2 week intervals. Serum samples were collected from each mouse 1 week after the third and fourth immunizations to measure the ASFV specific IgG antibody titer. Pre-immune sera collected from each group before immunization were used as controls. Two weeks after the last immunization, all of the mice were sacrificed to measure the cellular immune response in splenocytes.
-
The hemagglutination inhibition (HI) assay was used to measure NDV specific antibody. First, serum samples were pretreated with receptor-destroying enzyme (RDE), and then were incubated with 50% chicken red blood cells. In the HI assay, rNDV vector virus was used as the indicator. The pretreated serum samples were used to inhibit 4 HA units of virus.
-
Serum antibody titers were measured by an in-house ELISA. Ninety-six-well ELISA plates were coated with 100 μL of purified p72 protein (10 μg/mL) at 4 ℃ overnight. The plates were then washed with PBS and blocked with 5% skim milk-PBS at 37 ℃ for 1 h. Sera were serially diluted, added to each well of the ELISA plate, and incubated at 37 ℃ for 1 h. The plates were then washed three times with PBST (PBS containing 0.1% Tween-20 (v/v)), and incubated with HRP-labeled goat-anti mouse IgG (1:5000; Jackson ImmunoResearch, Baltimore, USA) for 1 h at 37 ℃. Finally, the plates were washed three times with PBST. For visualization, 50 μL of 3, 3', 5, 5'-tetramethylbenzidine (TMB) liquid substrate was added to each well and developed for 10 min at room temperature. The reaction was stopped by adding 50 μL of 2 mol/L sulfuric acid. Optical density (O.D.) values were determined at 450 nm using an iMark microplate reader (Bio-RAD, USA). The standard curve was generated using serial twofold dilutions of mouse IgG (Southern Biotech, Birmingham, USA) at known concentrations, as previously described (Ye et al., 2006). A linear equation was generated based on the O.D. values of the twofold decreased IgG concentrations. The concentration of p72-specific antibodies in each sample was calculated based on the O.D. value using the linear equation derived from the standard curve. The presence of p72-specific IgG1 and IgG2a antibodies was further evaluated to assess the type of response elicited (Th1 versus Th2).
-
Two weeks after the final immunization, the spleens were collected from immunized mice. Splenocyte suspensions were prepared and the splenic lymphocytes were obtained by lysing the red blood cells using red blood cell lysis buffer (Biovision, CA, USA). Trypan blue was used to assess cell viability. The frequencies of p72-specific IFN-γ and IL-4 secreting cells in the splenic lymphocytes were evaluated by a cytokine specific enzyme-linked immunospot (ELISPOT) assay using commercial monoclonal antibodies (eBioscience, San Diego, USA) according to the manufacturer s protocol. Briefly, 96-well plates were coated with IFN-γ or IL-4 capture antibodies overnight at 4 ℃ and 105 splenic lymphocytes were dispensed into each well and then stimulated with 10 μ g/mL of purified p72 protein. Control wells were stimulated with 10 μ g/mL of phytohemagglutinin (PHA). After 48 h of incubation, the cells were removed, and the plates were incubated with anti-IFN-γ or anti-IL-4 detection antibodies at 4 ℃ overnight. Avidin-HRP (eBioscience, San Diego, USA) was added after four washes with PBST and incubated at room temperature for 1 h. After removing the Avidin-HRP solution, plates were washed three times with PBST and twice with PBS. Freshly-prepared 3-amino-9-ethylcarbazole (AEC; DAKEWE, Shenzhen, China) substrate solution was added and developed at 37 ℃. Tap water was used to wash and stop the substrate reaction. The stained spots were counted, and the specific frequencies of IFN-γ or IL-4 secreting cells were expressed as the mean number of spot-forming cells (SFC) per million splenic lymphocytes. The ELISPOT was run using quadruplicate wells.
-
The proliferative responses in splenic lymphocytes were also tested. Briefly, 106 plenic lymphocytes were dispensed per well and were stimulated with 10 μ g/mL of purified p72 protein. Three days after stimulation, 10 µL of Cell Counting Kit-8 (CCK-8; Dojindo, Kyushu, Japan) substrate was added to each well and incubated for 4 h at 37 ℃ in a 5% CO2 incubator. The O.D. values were determined at 450 nm using an iMark microplate reader.
-
Statistically significant differences in the serum and cellular immune responses between groups of immunized mice were evaluated by one-way analysis of variance (ANOVA) or unpaired t-test (Graphpad Prism 5.0, Graphpad software, San Diego, CA, USA). The thresh-old for statistical significance was established at p < 0.05.
Cells, viruses, and animals
Plasmid construction and virus rescue
Western blotting
Assessing the growth characteristics of rNDV/p72 in BHK-21 cells
Pathogenicity of rNDVs in chicks and mice
Assessing immunogenicity in vivo
Hemagglutination inhibition assay
Serum IgG and subclass enzyme-linked immunosorbent assay (ELISA)
Enzyme-linked immunospot assay
Cell proliferation assay
Statistical analysis
-
To construct recombinant NDV expressing p72 (rNDV/p72), the open reading frame of the p72 gene was inserted into a genomic cDNA clone of NDV between the P and M genes (Figure 1A). The recombinant NDV was rescued from the full-length antigenomic cDNA clones as described in Materials and Methods. The correct sequence of the p72 gene was confirmed by PCR and sequencing. The stability of the p72 gene inserted in the NDV vector was assessed by passaging rNDV/p72 ten times through SPF 9-day-old embryonated chicken eggs. Sequence analysis of the p72 gene recovered after passaging showed that the integrity of the gene was conserved and that p72 was stably maintained without any mutations. Western blotting indicated that the three major NDV proteins (HN, NP, and M) were detected in lysates from cells infected with both rNDV and rNDV/p72. As expected, p72 was only expressed in lysates from cells infected with rNDV/p72 (Figure 1B).

Figure 1. Generation of recombinant Newcastle disease virus (NDV) expressing the p72 gene of African swine fever virus (rNDV/p72). (A) The p72 gene was flanked by the NDV gene-start (GS) and gene-end (GE) signals and inserted into the intergenic region between the P and M genes. (B) Production of p72 by rNDV or rNDV/p72. Baby hamster kidney (BHK-21) cells were infected with either rNDV or rNDV/p72 at a multiplicity of infection (MOI) of 1 and the cell lysates were collected 24 h post-infection for analysis by western blotting. NDV proteins were detected using anti-NDV antibodies directed against the HN, NP, or M proteins (upper panel). p72 (73 kDa) was detected using p72 monoclonal antibodies (lower panel). Lane 1: rNDV/p72, lane 2: Modified rNDV (control).
-
To evaluate whether the insertion of the p72 gene altered the pathogenicity of the NDV strain, we compared the pathogenicity of rNDV/p72 with its vector in chicks and mice. The pathogenicity of rNDVs in poultry was evaluated by the MDT assay in SPF embryonated chicken eggs and by the ICPI in 1-day-old chicks (Table 1). The MDT for both rNDV and rNDV/p72 exceeded 90 h, and, in fact, rNDV/p72 was more attenuated than the parental virus ( > 120 h for rNDV/p72 compared to 96 h for rNDV). The ICPI values of rNDV and rNDV/p72 were 0.53 and 0.00, respectively. Chicks infected with rNDV/ p72 had no significant clinical symptoms during the 8-day period of the ICPI test.
Virus MDT┼ ICPI╪ rNDV 96 h 0.53 rNDV/p72 > 120 h 0.00 Note: ┼Mean death time (MDT) pathotype deï¬nition: virulent strains, < 60 h; moderately virulent strains, 60 90 h; avirulent strains, > 90 h; ╪Intracerebral pathogenicity index (ICPI) is the criterion to classify the virulence of NDV isolates recommended by Office International Des Epizooties (OIE). Pathotype deï¬nition: virulent strains, 1.5 to 2.0; moderately virulent strains, 0.7 to 1.5; avirulent strains, 0.0 to 0.7. Table 1. Pathogenicity of recombinant NDV and recombinant NDV expressing African swine fever virus protein 72 in embryonated chicken eggs and chicks.
The pathogenicity of rNDV and rNDV/p72 in mammals was evaluated in mice inoculated via the i.m. and i.n. routes. All of the mice survived the test. There were no marked body weight differences between the mice infected with viruses and the control group after either i.m. (Figure 2A) or i.n. (Figure 2B) inoculation. Lungs were collected on day 3 p.i. and the viral titer determined in SPF chicken embryos. The viral titer was below the limit of detection at this time point. These results suggested that the insertion of the p72 gene did not change the pathogenicity of rNDV in mice.
Figure 2. Weight changes in mice inoculated intramuscularly (i.m.) in the thigh muscle of a hind leg (A) or intranasally (i.n.) (B) with 108 50% egg infectious dose (EID50) in 100 μL (i.m.) or 30 μL (i.n.) of rNDV or rNDV/p72. The mice in each group (n = 5) were observed and weighed daily for 14 days. Body weight changes for each group are shown as ratios to the weight at day 0, which was set as 100.
-
To investigate whether the expression of the p72 gene affected the growth of the parental NDV strain, we evaluated the growth kinetics of each virus in BHK-21 cells. The cells were infected at an MOI of 1 (Figure 3A) or 0.01 (Figure 3B) in the presence of exogenous protease. Both of the viruses replicated efficiently in the BHK-21 cells, and had similar replication kinetics. The virus titers ranged from 103.5 EID50 to 107.5 EID50 when the initial inoculation was at the MOI of 1 (Figure 3A), and 102.5 EID50 to 106EID50 when the initial inoculation was at the MOI of 0.01 (Figure 3B). rNDV and rNDV/p72 remained at high titers 72 hpi.
Figure 3. In vitro growth kinetics of parental (rNDV) and recombinant (rNDV/p72) viruses in BHK-21 cells following infection at an MOI of 1 (A) or 0.01 (B). Exogenous protease was provided in the infected cells. The viral titers were determined in specific pathogen free (SPF) chicken embryos. Bars represent the mean SD of three independent experiments (n = 3).
-
Next, the levels of NDV specific antibodies were assessed to characterize the humoral response to rNDV and rNDV/p72. The NDV specific antibody activity was measured using an HI assay. None of the serum samples in the PBS group contained NDV specific antibody at any time. In contrast, the serum from all of the mice inoculated with rNDV or rNDV/p72 contained high levels of antibody after immunization (Figure 4). In addition, rNDV/p72 elicited similar levels of NDV specific serum antibodies as the parental virus (p > 0.05) (Figure 4).

Figure 4. Induction of NDV specific antibodies in 4-week-old mice in response to immunization with rNDV/p72. Mice were inoculated via the intramuscular route at 2 week intervals. Serum samples were collected 1 week after the 3rd and 4th immunizations. NDV specific antibodies were measured by a hemagglutination inhibition assay using chicken erythrocytes. The mean and standard error of antibodies for each group are shown.
-
Having established that rNDV/p72 elicited a strong humoral response to the NDV vector, we assessed the level of p72 specific antibody production. None of the mice had detectable anti-ASFV p72 antibody before immunization. Serum IgG antibody specific to p72 was evaluated by ELISA. All of the mice immunized with rNDV/p72 developed p72 specific antibodies 1 week after the third or fourth immunization. Mice that were immunized four times had higher p72-specific antibody levels than mice immunized three times (p < 0.05). No p72 specific IgG was detected in control mice immunized with PBS or with rNDV (Figure 5A). The IgG subclasses induced by p72, i.e. IgG1 or IgG2a, were determined by ELISA (Figure 5B, 5C). The p72-specific IgG1 and IgG2a antibody titers followed the same pattern as the total serum IgG. Higher levels of IgG1 than IgG2a were observed at both time points; the difference in levels was equivalent to a Th2/Th1 ratio of 6.
Figure 5. Antibody titers in mice after immunization with rNDV/p72. Mice were inoculated via the intramuscular route four times at 2 week wecks intervals. The titers of p72-specific total IgG (A) and the subtypes IgG1 (B) and IgG2a (C) were determined by ELISA against purified p72 protein. Serum samples were collected 1 week after the 3rd and 4th immunizations. The mean and standard error of antibodies for each group are shown (*p < 0.05, **p < 0.01, and *** p < 0.001).
-
To investigate the cellular response in mice induced by immunization with rNDV/p72, cytokine production (IFN-γ and IL-4) and T-cell proliferation in response to p72 stimulation were assessed in splenocytes collected 2 weeks after the last immunization. Cytokine production was assessed using the ELISPOT assay (Figure 6A) and the proliferative response was measured with the CCK-8 assay (Figure 6B). Mice immunized with rNDV/p72 showed high levels of p72-specific IFN-γ (135 SFC/106 secreting cells) and IL-4 (108 SFC/106 secreting cells), while mice immunized with the rNDV vector had background levels of cytokine production (p < 0.05) (Figure 6A). In addition, higher levels of T-cell proliferation in response to p72 were observed in mice immunized with rNDV/p72 compared to rNDV-immunized mice (p < 0.05) (Figure 6B).
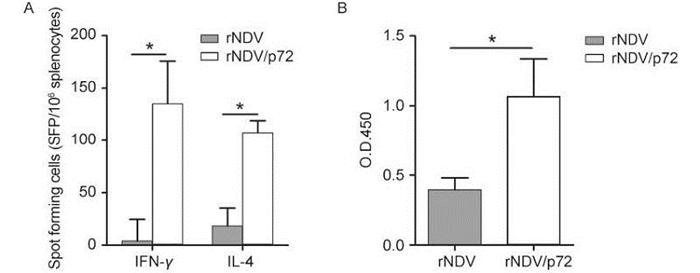
Figure 6. The p72-specific cellular response after immunization with rNDV/p72. (A) Splenic lymphocytes from mice immunized with rNDV/p72 or rNDV were stimulated with purified p72 and analyzed for cytokine production (IFN-γ and IL-4) by enzyme-linked immunospot (ELISPOT). The mean numbers of spot-forming cells (SFC)/106 cells are shown and bars represent the standard deviation of SFCs in three parallel wells (n = 3). (B) Splenic lymphocytes were used to test T-cell specific proliferative responses using the Cell Counting Kit-8 assay. Proliferative response was determined by the O.D. value. The mean and standard error of the O.D. values for each group are shown (*p < 0.05).
Construction of the rNDV/p72 vaccine strain
Expression of the p72 gene did not increase the virulence of NDV
In vitro characterization of rNDV expressing the p72 gene
NDV specific antibody responses induced by rNDV/p72 in mice
Induction of p72-specific antibody responses by rNDV/p72 in mice
Induction of a p72-specific cellular immune response in mice
-
Since ASF has significant economic consequences for the affected countries that include economic loss, threats to food security, and limitations on swine production (Costard et al., 2009a), multiple attempts have been made to develop an ASF vaccine, but they have had limited success (Forman et al., 1982; Leitão et al., 2001; Boinas et al., 2004; Neilan et al., 2004; Argilaguet et al., 2012). Lentogenic NDV strains, such as LaSota, have been used as a conventional vaccine vector for many years (Ganar et al., 2014). Recent studies have shown that mesogenic strains are easier to replicate in vitro and are more immunogenic in vivo in mammals than LaSota strain (Kim et al., 2014a; Kim et al., 2014b). However, mesogenic strains are not safe for use in the field as they have been shown to cause disease in poultry. Therefore, we developed a modified rNDV vaccine vector with the backbone of an attenuated NDV strain and the F cleavage site derived from the LaSota strain. The modified rNDV vector was then used to develop a recombinant virus expressing the p72 gene of ASFV. rNDV/p72 propagated efficiently in embryonated chicken eggs and BHK-21 cells. The p72 gene was stably maintained and successfully expressed in BHK-21 cells. Compared to the parental virus, rNDV/p72 had similar growth characteristics in vitro at high and low infection doses. Insertion of the p72 gene into the NDV backbone did not alter the pathogenicity, indicating that rNDV/p72 is likely safe to use for vaccination.
We observed high levels of IgG in all mice vaccinated with rNDV/p72, and the antibody titers continued to increase in response to a fourth immunization. This suggests that it may be possible to improve the immune response to rNDV/p72 by providing multiple consecutive immunizations or by boosting with a heterologous system to optimize the induction of specific antibodies. The combined data from IgG subtyping and ELISPOT (i.e. high IL-4 levels) (Anis et al., 2007) suggest a stronger Th2 response than Th1 response to rNDV/p72. The high level of IL-4 secreting cells detected by ELISPOT may contribute to enhancing the humoral immune response. Overall, there was a strong humoral response to rNDV/p72. The in vivo immunogenicity of rNDV/p72 was tested in mice, as mouse models are frequently used in vaccine development because they are well-studied, low cost, and the animals are easy to h and le. However, the immunological mechanisms involved in protection from ASF remain unclear. One report has shown that while neutralizing antibodies to the ASFV proteins p30, p54 and p72 were not sufficient for antibody-mediated protection of pigs from disease, the experimental group exhibited a 2-day delay in the onset of clinical disease and reduced viremia levels compared to the control group (Neilan et al., 2004). In contrast, Onisk et al. found that passively transferred ASFV antibodies partially protected swine against lethal infection (Onisk et al., 1994). A further study found that pigs immunized with a chimeric protein (p30 and p54) developed neutralizing antibodies and survived challenge with a virulent ASFV (Barderas et al., 2001).
In our study, mice immunized with rNDV/p72 demonstrated a strong Th1 immune response, had high levels of IFN-γ secreting cells, and T-cells proliferated robustly in response to p72, all markers of a cellular immune response. Taken together, the data suggest that rNDV/p72 induced an antigen specific cellular response in mice. Cellular immunity has been documented as a key factor in protection against ASFV. Argilaguet et al. constructed a BacMam-sHAPQ recombinant vector, a baculovirus-based vector for gene transfer into mammalian cells, that expressed a fusion protein including three t and em ASFV antigens, p30, p54 and the extracellular domain of the viral hemagglutinin (sHA) (Argilaguet Jordi M et al., 2013). In vivo, the construct elicited specific T-cell responses following immunization and protected 66% pigs against sublethal challenge with ASFV, even though antibodies could not be detected. In addition, in vivo depletion of the CD8+ T lymphocytes abrogated protective immunity to ASFV, which suggests that CD8+ T-cells play an important role in protection from ASF (Oura et al., 2005).
In summary, this is the first report using an NDV strain as a vaccine vector expressing the p72 gene of ASFV. The recombinant virus replicated well in embryonated chicken eggs and was safe for use in chicks and mice. The recombinant virus induced both p72-specific humoral and cellular immune responses in mice, indicating that it may be a promising vaccine for ASFV. However, additional studies will be required to test whether proof-of-principle immunogenicity studies should be conducted in swine. Collaboration with laboratories outside China will likely be necessary as ASF is an exotic animal disease in China.
-
The authors thank Dr. Zhigao Bu (Harbin Veterinary Research Institute, China) for his vaccinia virus, Dr. Shengbo Cao (Huazhong Agricultural University, China) for his p72-specific monoclonal antibody, and Centro de Investigación en Sanidad Animal (INIA-CISA, Spain) for their gift of the ASFV strain E70 genomic DNA. This study was financially supported by the National Supporting Program (2013BAD12B05), Natural Science Foundation of China (NSFC) (no. 31101839 and no. 31302117), the key program of Gansu Province (no. 1013JHTA008), and Jiangsu Co-innovation Center program for Prevention and Control of Important Animal Infectious Diseases and Zoonoses.
-
All the authors declare that they have no conflicts of interest. This article does not contain any studies with human subjects performed by any of the authors. Animal studies were complied with the Guide for the Care of Laboratory Animals issued by the Lanzhou Veterinary Research Institute (SYXK-2010-003).
-
XC, QZ, and HY designed the experiments. XC, JY, YJ, EO, BL and XL carried out the experiments. XC, QZ, EO and HY analyzed the data and wrote the paper. All authors read and approved the final manuscript.

 DownLoad: