


HTML
-
Hepatitis A virus (HAV), a member of the genus He-patovirus, family Picornaviridae, is one of the common enteric viruses (Melnick, 1992; Costa-Mattioli et al., 2003). HAV infection occurs worldwide, even in coun-tries like the United States where health and sanitation are considered excellent. Symptomatic HAV infections occurred in the United States in May 2013. A total of 165 patients were infected and 69 (42%) were admitted to the hospital, with no deaths (Collier et al., 2014). In areas where HAV infection is prevalent, such as Africa, Asia, Latin America, and the Middle East, the positive rate of immunoglobulin G (IgG) antibody to HAV in adults is close to 90%, and many children as young as 10 years of age are infected with HAV (Gupta and Ballani, 2014). In Tunisia, 66% of urban waste waters tested posi-tive for HAV in 2007-2008 (Beji-Hamza et al., 2014). About 1, 400, 000 new HAV infections occur globally each year, and 11%-22% of people infected need to be hospitalized.
Several large outbreaks of HAV infection have been reported recently in China. Almost 310, 000 cases were caused by consuming clams harvested from a sewage-polluted area in Shanghai in 1988 (Halliday et al., 1991). In 2007, 77 students were infected with HAV after they ingested contaminated water in Xifeng County, Guizhou Province (Jiang et al., 2013). In 2012, China's drinking-water monitoring program specified HAV as an impor-tant cause of waterborne disease (Ministry of Health of People's Republic of China, 2012). HAV is transmitted primarily via the fecal-oral route and can cause outbreaks through either close personal contact with an infected person or consumption of contaminated foods or water (Martin and Lemon, 2006). HAV is more resistant in the environment than other enteric viruses and can survive in fresh water, seawater, sewage, and seafood (such as clams) for a few days or even several months; it can even survive in dry feces for 30 days at 25 ℃ (McCaustland et al., 1982; Rzezutka and Cook, 2004; Fong and Lipp, 2005). HAV can cause illness even at a low concentration (Cuthbert, 2001). Therefore, it is both important and necessary to develop an efficient and accu-rate method for detecting HAV in water.
The typically low level of the virus in water make it difficult to detect HAV accurately in a water sample, so it is necessary to develop appropriate methods of concen-trating HAV from water. Several methods for concen-trating the virus from water samples have been described (Haramoto et al., 2004; Westrell et al., 2006; Villar et al., 2006; Haramoto et al., 2007). These methods include membrane adsorption, flocculation/precipitation, ultrafiltration, immunomagnetic beads, ultracentrifugation, and electrophoresis (Monceyron and Grinde, 1994; El Galil et al., 2004; Ikner et al., 2012). In practice, the most frequently used and most accurate method is membrane adsorption, followed by elution, which has been described in several studies (Kittigul et al., 2001; Kittigul et al., 2005; Hsu et al., 2007). After the virus has adsorbed to the membrane, it can be eluted by alkaline beef extract; however, any organic and inorganic compounds in the solution may affect further viral detection (Schwab et al., 1995). Furthermore, viruses are lost during the elution, leading to low virus recovery efficiency. We used pre-filtration, added phosphate-buffered saline (PBS) to the water, and did not perform elution in order to improve the recovery efficiency. We also compared the efficacy of several different membranes. The goal was to optimize the membrane absorption method and to provide a simple, rapid, and efficient approach that would concentrate HAV from water samples.
-
Hepatitis A (live) vaccine (attenuated HAV H2 strain) was purchased from the Institute of Medical Biology, Chinese Academy of Medical Sciences, China, and stored at 4 ℃ until use.
-
Tap water was collected from the laboratory in the Wuhan Institute of Virology, Chinese Academy of Sciences (CAS), China. Donghu Lake water samples were collected from Donghu Lake, Wuhan, China.
-
RNA extraction and reverse transcription (RT) of virus RNA were performed according to the instructions supplied with the RNA extraction kit (Takara) and mouse reverse transcription kit (MLV, Promega), respectively. The amount of HAV RNA used for reverse transcription was 125 ng. HAV gene fragments were amplified by polymerase chain reaction (PCR) using a Phusion High-Fidelity PCR kit (New England BioLabs). The primers used to amplify the genes are shown in Supplementary Table S1 (Cohen et al., 1987; Brooks et al., 2005). The positive plasmid pGEM-VP1 was constructed and considered the standard plasmid. After optimizing annealing temperature and reaction conditions, HAV-F2 and HAV-R2 were selected for subsequent experiments (Supplementary Figure S1).
The density of the plasmid was measured with a Nano-Drop 2000 (Thermo Fisher Scientific, Inc.) and the re-sult was converted into the viral copy number. The plasmid used for the standard curve was packed and stored at -20 ℃.
-
The quantitative detection of HAV was performed by SYBR Green real-time PCR. The pGEM-VP1 plasmids were 10-fold serial-diluted, and solutions of 101 copies/μL, 102 copies/μL, 103 copies/μL, 104 copies/μL, 105 copies/μL, 106 copies/μL, 107 copies/μL, and 108 copies/μL were used to draw a standard curve, with three replicates per dilution. SYBR Green real-time PCR was carried out in a Bio-Rad CFX Manager instrument (Bio-Rad) in a 20-μL reaction volume that contained 1 μL cDNA template, 0.5 μL each of forward and reverse primers, 10-μL 2×SsoFast EvaGreen Supermix (Bio-Rad), and double-distilled water (ddH2O). The thermal profile for SYBR Green real-time PCR was 95 ℃ for 3 min, followed by 40 cycles of 95 ℃ for 10 s and 55 ℃ for 30 s.
-
Sample collection containers and viral concentration containers used in all steps were sterilized and each experiment had three replicates. The different concentration methods are shown in Figure 1.

Figure 1. Flow diagram used in the present study for enriching hepatitis A virus (HAV).
HAV (1 mL of 5.66×10⁶ copies/μL) was diluted in 500 mL tap water, and 5 mL of 0.4% sodium thiosulfate (Na2S2O3) was added to remove hypochlorous acid. The anode membrane (Immobilon-Ny+) (47-mm diameter, 0.45-μm pore size, Millipore INYC00010) was used with negative pressure suction to adsorb the virus.
For method A, the anode membrane was moved to a dish (diameter 60 mm), and 2 mL Trizol added to soak this membrane for 5-10 min, after which the Trizol ly-sate was collected and RNA was extracted.
For method B, after filtering, the filtration membrane was transferred to a 30-mL solution composed of 13% polyethylene glycol (PEG)6000 and 0.3 mol/L NaCl buffer (pH 7.0), then mixed thoroughly at 4 ℃ overnight (Jaykus et al., 1996). The viruses were collected by centri-fugation at 13, 000×g for 1 h, the supernatant was gently discarded, and 2 mL Trizol was added to extract RNA.
For method C, the filtration membrane was transferred to 30 mL of 0.01 mol/L EDTA -0.1 mol/L glycine buffer (pH 10.5), which contained 0.1% bovine serum albumin (BSA), for 1 h. Solid PEG 6000 and NaCl were added to the elutes to attain final concentrations of 13% and 0.3 mol/L, respectively, then stirred well and shaken at 4 ℃ for 8 h. The viruses were collected by centrifugation at 13, 000 × g for 1 h, then the supernatant was gently discarded and 2 mL Trizol was added to extract RNA.
-
HAV (1 mL of 5.66×10⁶ copies/μL) was added to 500 mL tap water or PBS, and 0.4% sodium thiosulfate (Na2S2O3) solution was added to the tap water to remove hypochlorous acid. First, the tap water and PBS solution were filtered through a pre-filtration membrane (glass cellulose membrane, 2.7-μm pore size). Then the HAV was concentrated through an Immobilon-Ny+ filtrating membrane. The concentration efficiency with and without pre-filtration were compared to determine the impact of pre-filtering on concentration efficiency.
-
Six 500-mL PBS samples containing 1 mL of 5.66×10⁶ copies/μL HAV were concentrated through six different membranes with different pore sizes and materials (A, F, G, H, I, and J) (Table 1). Then, 2 mL Trizol was added to the filtration membrane and allowed to soak for 5-10 min prior to RNA extraction.

Table 1. Different filter membranes used in the present study
-
We collected 9 water samples (500-mL for each sample) from Donghu Lake. The Donghu Lake water sample containing 1 mL of 5.66×10⁶ copies/μL HAV was defined as group 1. Additional 500-mL Donghu Lake water samples were mixed with components of PBS (i.e., with NaCl, KCl, Na2HPO4, and KH2PO4) to final concentrations of 137 mmol/L NaCl, 2.7 mmol/L KCl, 10 mmol/L Na2HPO4, and 2 mmol/L KH2PO4, respectively. The lake water sample containing components of PBS was spiked with HAV and defined as group 2. The Donghu Lake water sample including components of PBS was defined as the negative control group. The water samples from group 2 and the negative control group were adjusted to pH 7.2-7.4 with HCl. The water samples were all centrifuged at 4 ℃, 3800×g, for 15 min, to remove large particles. The supernatant was filtered through a pre-filtration membrane and a mixed cellulose ester (MCE) membrane. After filtration, 2 mL Trizol was added to the MCE membrane and it was soaked 5-10 min prior to RNA extraction.
-
To determine whether inhibitors in the water might affect SYBR Green real-time PCR amplification, the samples were treated as follows. First, cDNA (4.5 μL) from the water sample mixed with 0.5 μL ddH2O was defined as A1; 4.5 μL cDNA from the water sample mixed with 0.5 μL standard plasmid (B stands for stan-dard plasmid, of which there were 3.5×10⁵ copies) was defined as A2; 1 μL of the A1 or A2 template was used in SYBR Green real-time PCR. Next, cDNA (5 μL) from the water sample was mixed with 45 μL ddH2O. A 4.5-μL sample of the resulting solution mixed with 0.5 μL ddH2O was defined as A3, and a 4.5-μL sample of the solution mixed with 0.5 μL standard plasmid was defined as A4; 1 μL of the A3 or A4 template was used in SYBR Green real-time PCR.
-
When HAV was concentrated from tap water samples and PBS samples, virus recovery was calculated using the following formula:
When HAV was concentrated from Donghu Lake water samples, virus recovery was calculated using the following formula:
-
The results of the test groups were evaluated by Student's t-test; if the P-value was less than 0.05, the difference was considered significant.
Hepatitis A virus (HAV)
Water samples
RNA extraction and construction of HAV standard plasmid
HAV quantitative detection by SYBR Green real-time RT-PCR
Different concentration methods
Improving recovery efficiency by pre-filtration
Different kinds of filtration membranes
Processing of water samples from Donghu Lake
Inhibition assay
Virus recovery efficiency
Statistical analysis
-
To exclude the interference of impurities in natural water bodies, tap water was chosen to establish a labora-tory method of enriching HAV. HAV (1 mL of 5.66×10⁶ copies/μL) was added to 500 mL tap water. Virus concentration was performed using the anode membrane, or the anode membrane combined with secondary elution methods. Copy numbers of concentrated HAV were measured with real-time RT-PCR. As shown in Figure 2A, for tap water, the recovery rate of method A was significantly higher than the recovery rates of methods B and C (P < 0.01) (Figure 2A). The HAV concentration efficiency using anode membrane with no elution is significantly higher than when using anode membrane combined with secondary elution methods.
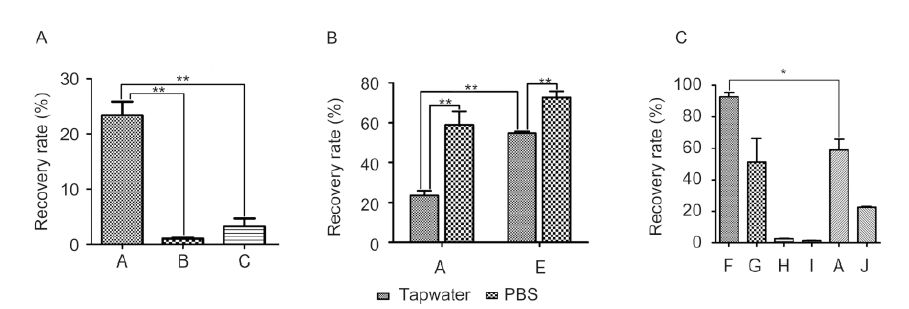
Figure 2. Recovery efficiency using different concentration methods. Hepatitis A virus (HAV) (1 mL of 5.66×10⁶ copies/μL) was diluted in 500 mL tap water. The HAV in water samples was concentrated by methods A, B, and C, as described in the Materials and Methods section. **, significant difference (P < 0.01). Values represent the mean ± SD of each group.
Impurities in tap water may affect the results of RT-qPCR and lead to a low concentration efficiency. A 2.7-μm pore size glass cellulose membrane was therefore used to remove large particles. For tap water, the concentration efficiency was significantly higher with pre-filtering (P < 0.01) (Figure 2B).
To verify whether salinity could influence the reco-very rate of HAV, PBS was added to the tap water, producing the following concentrations: NaCl 137 mmol/L, KCl 2.7 mmol/L, Na2HPO4 10 mmol/L, and KH2PO4 2 mmol/L. HAV was resuspended in the tap water and PBS buffer mixture, hereinafter referred to as the water sample and the PBS sample. The recovery rate was significantly higher for samples that contained PBS (P < 0.01) (Figure 2B).
To verify whether the size and type of membrane pore could affect concentration efficiency, six types of filtration membrane were used to concentrate HAV in PBS samples: 0.1-μm and 0.2-μm MCE membrane (methods F and G); 0.1-μm and 0.2-μm polyvinylidene fluoride (PVDF) membrane (methods H and I); 0.45-μm anode membrane (method A); and 0.2-μm nylon membrane (method J). As shown in Figure 2C, the virus recovery rate was highest after the use of method F, reaching 92.62 ± 5.17%. Method A had the next highest rate, although it was significantly lower (P < 0.05), and method Ⅰ had the lowest rate, only 1.19 ± 0.38%. The recovery rates of 0.1-μm and 0.2-μm MCE membrane and anode membrane were all higher than 50%(Figure 2C).
The optimal concentration method, as described above, was applied to the Donghu Lake samples. The highest concentration efficiency of HAV detected in raw Donghu Lake samples was 204 copies/μL and the Cq (quantification cycle) value was 35.68 (Table 2). The virus recovery rate for group 2 (containing PBS) was higher than that for group 1 (with no PBS). The use of optimum concentration methods for the Donghu Lake samples, including adding PBS, using pre-treatment after centrifugation, pre-filtering, using MCE membrane filtration, and not performing elution, provided a virus recovery rate of 79.45 ± 9.88%.

Table 2. Recovery efficiency of hepatitis A virus (HAV) of water samples in Donghu Lake
As described for groups A1, A2, A3, A4, and B in the Materials and Methods section, the plasmid copy number of each group was calculated as follows to determine whether dilution could influence the inhibitor:
Recovery rate with no dilution = A2/(A1+B)
Recovery rate with 1:10 dilution = A4/(A3+B)
Three groups of parallel tests were performed. The virus recovery rate increased by 19.73%-26.74% when the sample was diluted 10 times (Table 3). Therefore, dilution treatment could partially remove the inhibitory factor for HAV detection.

Table 3. The virus recovery efficiency after PCR inhibitor treatment
-
A relatively inexpensive Millipore Immobilon-Ny+ membrane was used to compare different approaches to concentrating HAV in water samples. A poor concentration efficiency (less than 10%) was achieved by using an anode membrane in combination with a second elution method. A previous study used Hybond-N+ nylon membrane concentration, followed by elution, and achieved a recovery rate of HAV of 45.92%(Wang et al., 2009). We analyzed the reasons for low recovery efficiency and determined that too much RNA was lost during the elution process. A series of improved methods was therefore developed, in which the viruses were concentrated with a nylon anode membrane and Trizol was added di-rectly to this membrane to extract RNA.
The salinity of water samples has a strong effect on concentration efficiency. PBS components may play a role in stabilizing the virus and the solution pH, improving the recovery rate. The presence of impurities slows down filtration velocity and the RNA inhibitors among them may affect the recovery rate. Therefore, pre-filtering and centrifugation steps were used. A glass cellulose membrane was used for pre-filtering the water, an approach that significantly improved the concentration efficiency.
Different filter membrane types and pore size were also compared. The virus recovery rate using PVDF membranes with two different pore sizes was extremely low. This result may have been due to the low protein adsorption capacity of the PVDF membrane, which allowed a large number of viruses to be lost when the water sample flowed through the membrane. The mean virus recovery rate of 0.1-μm MCE membrane was higher than that of the 0.2-μm membrane because of a better physical interception rate; however, the membrane with the larger aperture required less time to operate. MCE membrane turned out to be superior over the positively charged anode membrane for HAV concentration, due to the higher combination rate of MCE and protein (150 g/cm2). The MCE membrane filter is convenient and cheap, and the filtering device used with the membrane is simple and portable, making this method suitable for laboratory and field operation.
The amount of HAV RNA for reverse transcription was set as 125 ng, which was equivalent to diluting the sample and removing the inhibitor.
The optimized concentration method and appropriate filtration (glass cellulose membrane for pre-filtration, MCE used as the filtration membrane, PBS added, and no elution) were further applied to environmental water samples. The process is convenient, easy, and highly reproducible. Concentration and extraction of RNA took only 5 h and the recovery rate of the virus was about 80%. The limit of detection can reach 10 copies/μL. The use of the SYBR Green assay is further supported by Zhang et al.(2009), who used it to detect HAV in Bohai Gulf samples, with a limit of detection of 5.35×10³ copies/μL.
In the present study, we optimized the HAV concentration method, improved the concentration efficiency, and established a rapid, effective method for concentrating and detecting HAV. This approach has important theoretical and practical applications for ensuring the safety of drinking water and food in order to protect people's lives and health, by preventing and controlling HAV.
-
This work was supported by grants from the National Science and Technology Support Program (No. 2013BAK12B05), the National Basic Research Program (No. 2010CB530301), and the National Natural Science Foundation of China (No. 31070141, 31100132).
-
The authors declare that they have no competing interests. This article does not contain any studies with human or animal subjects performed by any of the authors.
-
QJC conceived and supervised the study, YTQ and ZWS performed the experiments. GLH, HBC, GXY, YL, YSL, and LHZ carried out the data analysis. YTQ and QJC wrote the manuscript. All authors read and approved the final manuscript.
Supplementary tables/figures are available on the websites of Virologica Sinica: www.virosin.org; link.springer.com/journal/12250.
-
Product Primer name Primer sequence (5'-3') HAV247bp HAV-Fa GTTTTGCTCCTCTTTATCATGCTATG HAV-Ra GGAAATGTCTCAGGTACTTTCTTTG HAV HAV-F2 TGCTATGGATGTTACTAC HAV-R2 ATCTTTCATGGTTGTTATAC HCV HCV-F TCT GCG GAA CCG GTG AGT A HCV-R TCA GGC AGT ACC ACA AGG C AIV AIV-F TAT GAG AAG TGA AGT GGA A AIV-R GTG TAT GTT GTG GAA TGG HIV HIV-F TGT GTG CCC GTC TGT TGT GT HIV-R GAG TCC TGC GTC GAG AGA GC Note: a The primer HAV-F/R was used according to Brooks (2005). Table S1. The primers used for hepatitis A virus (HAV) detection with conventional and real-time RT-PCR
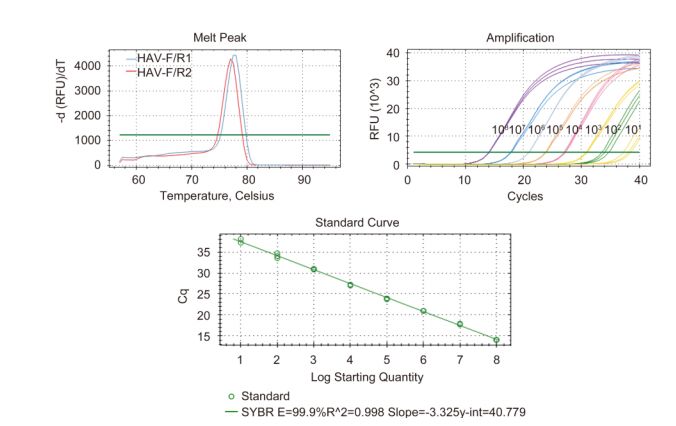
Figure S1. Amplification curve (A and B) and standard curve (C) for HAV obtained by real-time RT-PCR.

 DownLoad: