


HTML
-
Dengue virus (DENV) belongs to the genus Flavivirus in the family Flaviviridae, which is a large group of singlestranded, positive-sense RNA viruses [(+)ssRNA] with a genome of approximately 10.7 kb in length. Since the discovery of DENV in 1943 (Messina et al. 2014), the reported incidence of these infections has increased in tropical and subtropical areas of the world, and it has recently caused local outbreaks in China, America, Australia, France and many other countries (Zhao et al. 2016; Li et al. 2017; Radke et al. 2012; Bhatt et al. 2013; Schaffner et al. 2014; WHO 2019).
In 2011, the WHO revised its classifications and now grades the disease severity by its clinical manifestations as dengue fever (DF) and dengue hemorrhagic fever (DHF) grades 1–4. Currently, there are four distinct, but closely related serotypes of DENV (DENV1–4). These four serotypes are genetically similar and share approximately 65% of their genomes, among them DENV-2 spreads most widely. All of these DENV serotypes are transmitted to humans principally by two mosquito vectors, Aedes aegypti and Aedes albopictus, and cause a wide range of symptoms from a flu-like DF to more severe and even fatal DHFs (Simmons et al. 2012).
The linear (+)ssRNA genome of DENV contains a single open reading frame (ORF), encoding the polyprotein with a 5' type-Ⅰ m7G cap structure. The polyprotein is posttranslationally cleaved by host- or viral proteases to produce separate structural (C, prM/M, E) and nonstructural (NS1-NS2A-NS2B-NS3-NS4A-NS4B-NS5) proteins (Green et al. 2014).
The DENV virion enters target cells via receptor mediated endocytosis in a clathrin-dependent manner (Savidis et al. 2016; Acosta et al. 2008). After the initial translation and cleavage of the polyprotein, DENV triggers the formation of a replication complex in the perinuclear endoplasmic reticulum, where RNA replication and protein translation occur. The newly synthesized positive-sense viral RNA is then packaged by the C protein and assembled into an enveloped virion that is covered with prM/E heterodimers (Welsch et al. 2009). The mature virus particles released by exocytosis can infect other cells.
The genome of DENV is relatively small in size and simple in composition compared to host eukaryotic genomes. And the ten proteins encoded by DENV are insufficient for viral life cycle. Like other viruses, DENV has evolved many strategies to hijack and utilize host factors throughout its life cycle. It has been reported that the NS5 proteins of many flaviviruses, including DENV, West Niles virus, Japanese Encephalitis virus, Zika virus, and Yellow Fever virus, possess 2'-O-methyltransferase activity to modify the 5' cap structure of viral mRNAs, thereby mimicking eukaryotic type 1 cap structures and competing for eIF4e binding (Daffis et al. 2010). The DENV NS2B/3 protease can cleave STING, thereby preventing type Ⅰ interferon (IFN) induction mediated by cGAS (Aguirre et al. 2012).
Upon viral infection, the host cells mobilize a coordinated response. Proteomics analysis has been proven to be an effective approach to obtain a global and quantitative assessment of host-virus interactions, and has widely been used in studies of many important viruses (Xin et al. 2017; Clements et al. 2017; Ersing et al. 2017; Weekes et al. 2014). Mass spectrometry-based quantitative proteomics is an efficient tool for gene selection and can provide an insight in regulated biological processes on functional level. Bottom-up proteomics strategy is most popular, in which peptides are measured as surrogates for the protein of interest (Schubert et al. 2017) and stable isotopic labeling based quantification methods are usually employed for peptide/protein quantitation. Dimethyl-labeling is a simple, robust, and reliable multiplex labeling method and has been widely applied to quantitative proteomics (Hsu and Chen 2016).
In this study, we have determined changes in the host cell protein expression and protein phosphorylation during uptake of DENV using dimethyl-labeling based quantitative proteomics. A total of 2263 host proteins and 2440 phosphorylated sites on 799 host phosphoproteins were quantified, of which around 14% of proteins and 20% phosphoproteins showed significantly regulation, covering a broad spectrum of cellular compartments and biological pathways. Our study revealed critical pathogen-induced changes in host protein expression and protein phosphorylation and further unveiled vital changes in cellular processes as response to DENV infection.
-
Human erythroleukemic K562 cells were maintained in RPMI 1640 medium (Invitrogen) supplemented with 10% FBS (GIBCO) at 37 ℃ in 5% CO2. C6/36 (Ae. Albopictus epithelial cells) cells were cultured in RPMI 1640 medium supplemented with 10% FBS, 100 U/mL of L-glutamine, 100 mg/mL of penicillin–streptomycin and maintained at 28 ℃.
DENV-2 strain TSV01 was used in this study. Monolayers of C6/36 cells were infected with DENV-2 at a multiplicity of infection (MOI) of 0.01, and 6 days after infection, cell supernatants were collected, clarified, and stored at - 80 ℃. The titers of DENV-2 stocks were determined by limiting-dilution plaque assay on BHK cells.
-
Human erythroleukemic K562 cells were maintained as described above, and at day 2 of culture, samples of 1 × 10⁷ cells were resuspended in RPMI 1640 medium supplemented with 2% FBS and were infected with the DENV-2 at the MOI of 10. The DENV-2 infection level in K562 cells was measured by qRT-PCR analysis. Total RNA was purified using TRIzol reagent (Thermo) according to the manufacturer's protocol. qRT-PCR was performed on a StepOne Real-Time PCR Systerm with SYBR qPCR Mix (TOYOBO). The primers were F: GCAGAAACACAACAT GGAACAATAGT, R: TGATGTAGCTGTCTCCGAATGG.
-
The pellet of cells infected with DENV-2 was resuspended in 200 μL of lysis buffer containing 6 mol/L urea, 2 mol/L thiourea, 5 mmol/L DTT, 1 mmol/L NaF, 0.2 mmol/L NaVO3, 1 mmol/L EDTA, 0.5 mmol/L EGTA, Complete protease inhibitor cocktail and PhosStop phosphatase inhibitor cocktail (Roche), pH 8.0. After sonication for 3 min (5-s intervals for every 2-s sonication) on ice, sonicated lysate was centrifuged at 20, 000 ×g for 20 min. The protein concentration was determined by the Bradford assay. The protein solution was reduced with DTT (5 mmol/L) at 37 ℃ for 45 min, alkylated with iodoacetamide (15 mmol/L) at room temperature for 45 min, and then digested with Lys-C (1:30) at room temperature for 4 h. After sixfold dilution with H2O, the solution was subsequently digested overnight with trypsin (1:50) at 37 ℃.
-
On-column desalting and dimethyl labelling was performed as previously described with minor modifications (Boersema et al. 2009). P100 microcolumns were packed with the POROS OLIGOR3 reversed phase resin (20 μm; Applied Biosystems). The length of microcolumns was made according to the sample amount (1 cm for 100 μg). The columns were equilibrated with 0.1% TFA. Samples were loaded onto the columns in 50 μL of 0.1% TFA and washed twice with 100 μL of 0.1% TFA. The column was flushed slowly with 100 μL of the respective labeling reagent (light, intermediate) five times, washed with 100 μL of H2O twice, eluted with 100 μL of 50% acetonitrile (ACN) and 100 μL of 70% ACN. The differentially labeled samples were mixed, lyophilized and stored at - 80 ℃ for later HILIC fractionation.
-
Phosphopeptides were enriched by TiO2 as previously described (Zhao et al. 2014). The 200 μg digested peptides was re-suspended in 200 μL loading buffer (80% ACN, 5% TFA, 1 mol/L glycolic acid) and mixed with TiO2 material in the Eppendorf tube for 10 min. The resin was first washed with loading buffer and sequentially washed with three washing buffers (80% ACN/1% TFA, 20% ACN/ 0.1% TFA, and water). The phosphopeptides were eluted by mixing the resins with NH3·H2O (pH 10.5) for incubation in 10 min. The elution was acidified with 100% formic acid and desalted using a R3 microcolumn prior to further fractionation by HILIC.
-
The peptides were fractionated by HILIC. Chromatographic separations were performed on an Agilent 1200 Series HPLC system (Agilent) using a custom-made 320 μm × 180 mm HILIC column packed with TSKGel Amide-80 3 μm HILIC particles (Tosoh Biosciences). The dried peptides were resuspended and loaded in Solvent B (90% ACN, 0.1% TFA) onto a HILIC column at a flow rate of 12 μL/min in 8.5 min. The peptides were separated by an inverse gradient of 100%–90% Solvent B in 0.5 min, 90%–60% Solvent B in 26 min, followed by 60%–0% Solvent B in 4 min with an increasing amount of Solvent A (0.1% TFA) at a flow rate of 6 μL/min. A total of 36 fractions were collected throughout the gradient, pooled into eight fractions and lyophilized down in a vacuum centrifuge for later LC–MS/MS analysis.
-
LC–MS/MS analysis were performed using an EasyLC system (Thermo Scientific, Odense, DK) interfaced to an LTQ-Orbitrap XL hybridmass spectrometer (ThermoFisher, Bremen, Germany) as previously described. Samples were dissolved in Solvent A (0.5% FA) and loaded at a flow rate of 550 nL/min onto a custom-made 16-cm analytical column [100-m inner diameter, 375-m outer diameter, packed with Reprosil C18, 3 μm reversed phase particles (Dr. Maisch GmbH)]. Separation was then performed at a flow rate of 250 nL/min using a 100-min gradient of 0%–34% Solvent B (90% ACN, 0.5% FA). The LTQ-Orbitrap XL instrument was operated in a data-dependent MS/MS mode. Multistage activation (MSA) was used for phosphorylated peptides. Full scans were acquired in the Orbitrap, and up to five of the most intense peptides were selected and subjected to fragmentation in the linear ion trap (LTQ).
-
The LC–MS/MS data were processed and searched against Uniprot Homo sapiens protein sequence database (retrieved on 20, 205 sequences) using MaxQuant (Version 1.5.2.8) for protein identification and quantification. Trypsin was chosen as the enzyme with a maximum of two missed cleavages allowed. S-Carbamidomethyl cysteine and demethylation (N-terminal and lysine) were defined as a fixed modification. Partial modifications included were oxidation (M) and phosphorylation at serine, threonine, and tyrosine residues. The MS and MS/MS results were searched with a peptide ion mass tolerance of 10 ppm and a fragment ion mass tolerance of 0.6 Da. Proteins were identified with a confidence score of > 95. The false discovery rate (FDR) calculated based on a decoy database search was set to 1%. Gaussian distributions of ratios were analyzed and mean ± 1.96 SD was used as the cut-off for significant regulations.
-
Gene ontology (GO) analysis and functional classification were performed by using Panther (Version11.0) (Mi et al. 2017). The Biological Networks Gene Ontology (BiNGO, Version 3.0.3) (Maere et al. 2005) plug-in implemented in the Cytoscape (http://www.cytoscape.org/, Version 3.6.1) (Shannon et al. 2003) was used to analyze the GO term enrichment of significantly up- or down-regulated proteins (P < 0.001, statistical test by Hypergeometric test). STRING (the Search Tool for the Retrieval of Interacting Genes/Proteins, Version 10.5) (Szklarczyk et al. 2017) was utilized to qualify the physical and functional protein– protein interactions, which were then visualized in Cytoscape.
-
Infection of K562 cells was performed as described above. Cells were harvested in cell lysis buffer [50 mmol/L Tris– HCl (pH 7.4), 150 mmol/L NaCl, 1% NP40, 0.25% deoxycholate and a protease inhibitor cocktail (Roche)]. Crude lysates were boiled for 10 min and then kept on ice. Each sample was loaded in a 12% polyacrylamide-SDS gel, and the proteins were electrophoretically separated by conventional methods. Proteins were transferred to nitrocellulose, and blots were incubated with anti-Tubulin (Proteintech), rabbit monoclonal antibodies anti-SAP18, rabbit monoclonal antibodies anti-GRB2, rabbit monoclonal antibodies anti- eIF3e, rabbit monoclonal antibodies anti-Bid, rabbit monoclonal antibodies anti-HDAC1 (Abcam).
Cultivation of K562 Cells and Dengue Virus Production and Stock
Infection of K562 Cells with Dengue Virus
Protein Extraction and Digestion
On-column Desalting and Dimethyl Labelling
TiO2 Enrichment of Phosphopeptides
Hydrophilic Interaction Liquid Chromatography (HILIC) Fractionation
LC–MS/MS Analysis
Database Search and Data Interpretation
Bioinformatics
Western Blot
-
DENV infection affects various host cellular pathways including interferon responses, apoptosis and endoplasmic reticulum stress. Knowledge of changes in host protein expression and phosphorylation caused by infection helps to understand the interaction between virus infection and host response. In this study, a dimethyl labelling-based quantitative proteomics strategy was employed to characterize the host cell proteome and phospho-proteome changes upon DENV infection in K562 cells (Fig. 1A). Briefly, K562 cells were infected with DENV-2 at a multiplicity of infection (MOI) of 10 or mock treated and were harvested and lysed at 48 h post infection (hpi). The DENV-2 infected K562 cells were analyzed by qRT-PCR (Fig. 1B). Extracted proteins were tryptic digested, and the digested peptides from mock-treated or DENV-infected cells were differentially labeled with light or medium dimethyl reagent, respectively. The labeled peptides were mixed in a ratio of 1:1, subjected to TiO2 phosphoenrichment, offlinely fractionated by hydrophilic interaction liquid chromatography (HILIC), and then analyzed by liquid chromatography-tandem mass spectrometry (LC– MS/MS) (Fig. 1A). Three independent biological replicates were performed.
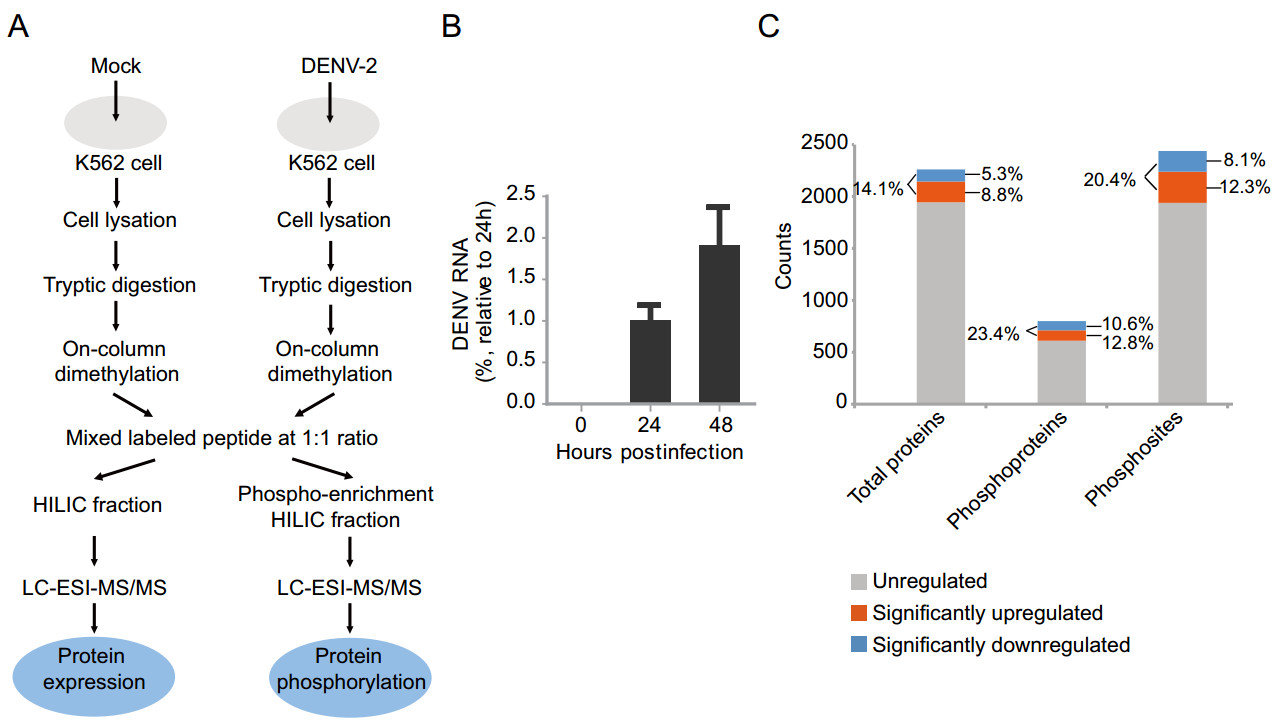
Figure 1. Proteomics and phosphoproteomics profiling of DENV-2 infection in human K562 cells. A Workflow for quantitative proteomic analysis of DENV-2 infected K562 cells. B qRT-PCR analysis of DENV-2 levels in K562 cells. K562 cells were infected with DENV-2 strains TSV01 at a MOI of 10. The intracellular DENV-2 RNA was extracted and measured by qRT-PCR at different time points. Three independent biological replicates were performed. C An overview of all identified and regulated proteins, phosphoproteins and phosphosites. Orange box represented upregulated protein/ phosphosite, blue box represented downregulated protein/phosphosite, gray box represented unregulated protein/phosphosite.
MS data were submitted to Maxquant to perform peptide identification and quantitation. Using these criteria that only proteins with at least two quantified peptides with a confidence score of > 95 were quantified, a total of 2263 host proteins and 2440 phosphorylated sites on 799 host phosphoproteins were identified (Table 1 and Fig. 1C). The cutoff for differentially regulated proteins was set as described previously (Xin et al. 2017). Briefly, the Gaussian distribution of protein ratios was analyzed, and proteins with ratios deviating from the mean of the normally distributed data by 1.96 standard deviations (SDs) were considered differentially regulated (Supplementary Figure S1). Using this criterion, we found that 201 proteins were identified as being upregulated, while 120 were identified as being downregulated out of the 2263 quantified host proteins. And 103/85 phosphoproteins were identified as being upregulated/downregulated, while 301/200 phosphosites were identified as being upregulated/downregulated out of the 2440 quantified phosphosites among the 799 host phosphoprotein (Table 1) (detail information in Supplementary Table S1–S3). As indicated in Fig. 1C, 14.1% of all quantified proteins were significantly regulated, whereas higher percentages (23.4%/ 20.4%) of all quantified phospho-proteins/sites showed significant regulation, implying a bigger effect on host protein phosphorylation caused by DENV infection as compared to protein expression. Interestingly, relatively higher numbers of upregulation in expression and phosphorylation were observed for the same host proteins (Fig. 1C).
Biological replicate 1 Biological replicate 2 Biological replicate 3 Total Total protein Unregulated 1775 1845 1771 1942 Significantly upregulated 83 68 98 201 Significantly downregulated 57 72 60 120 Phosphoproteins Unregulated 549 622 617 611 Significantly upregulated 53 49 41 103 Significantly downregulated 28 38 55 85 Phosphosites Unregulated 1563 1840 1947 1939 Significantly upregulated 178 124 70 301 Significantly downregulated 107 79 64 200 In total, 2263 proteins, 799 phosphoproteins and 2440 phosphosites were quantified. Gaussian distribution (mean ± 1.96SD) was applied to filter out the significantly regulated proteins/sites. Table 1. An overview of proteins, phosphoproteins and phosphosites quantified in this study.
-
Gene ontology (GO) descriptions were referred to their annotations in the NCBI database. To obtain an overview of functional classification of all the differentially regulated proteins, the 201 upregulated and 120 downregulated proteins together with 103 upregulated and 85 downregulated phosphoproteins were submitted to Panther for GO analysis. The results showed that the regulated proteins appeared to be involved in a broad range of cellular biological processes and categorized into ten to twelve functional groups (Fig. 2A–2D) (detail information in Supplementary Table S4). Obviously, a broad spectrum of host proteins/phosphoproteins was involved in virus infection and host response with similar pattern of functional classification. The three largest groups of regulated proteins were identified involving in metabolic process, cellular process, and cellular component organization or biogenesis, composing high variety of proteins with vital cellular functions. In addition, a smaller quantity of the regulated proteins/phosphoproteins involved in response to stimulus and immune system process was found. Moreover, for both proteins and phosphoproteins, upregulated proteins exhibited different patterns as compared to downregulated proteins in most processes except for the three major processes. Especially, higher percentage of upregulated proteins was distributed in response to stimulus than downregulated proteins (Fig. 2A–2D, words highlighted in red). High similarity was shared between protein expression and phosphorylation in response to DENV infection.
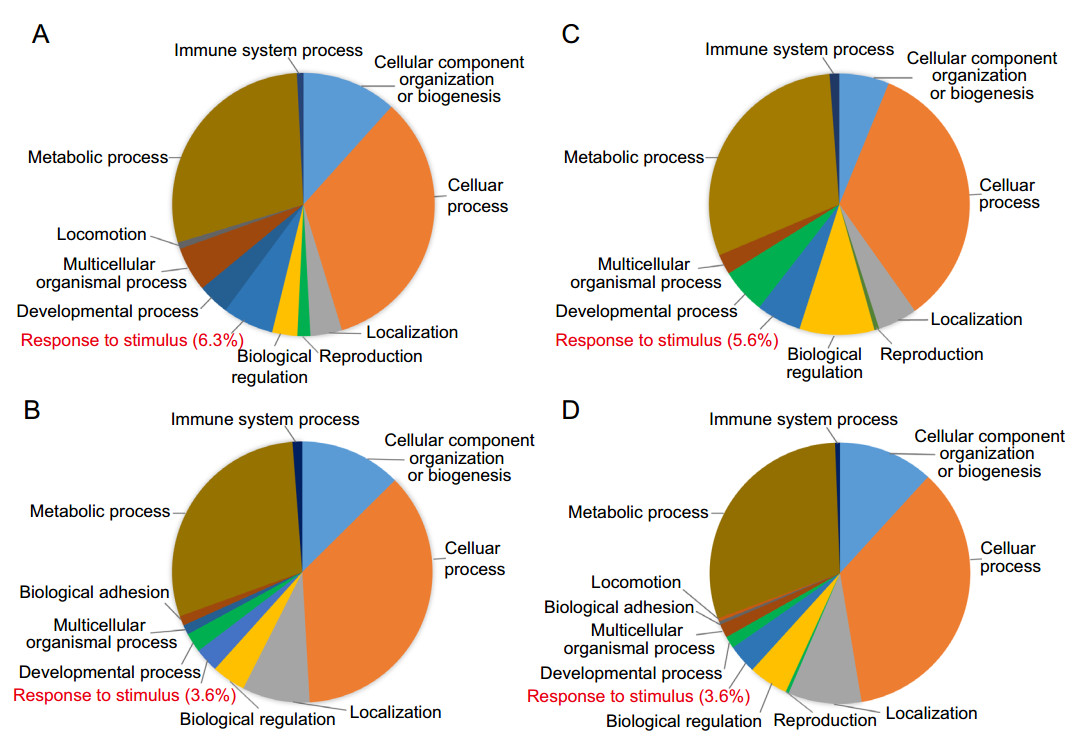
Figure 2. Functional classification analysis. List of regulated total proteins and phosphoproteins were submitted to PANTHER to perform a gene classification analysis. A Upregulated total proteins, B downregulated total proteins, C upregulated phosphoproteins, D downregulated phosphoproteins. Different colors represent different biological processes; area of fans represent the number of included proteins. "response to stimulus" was highlighted in red.
To assess the statistical overrepresentation of specific categories of regulated proteins relative to all quantified proteins, a hypergeometric test in GO annotation was performed by using BinGo. Such statistical enrichment analysis can assess whether the numeric values of proteins in certain biological processes are nonrandomly distributed with respect to the numeric values of all quantified proteins. Categories with normalized P < 0.001 were considered overrepresented. As illustrated in Fig. 3A (detail information in Supplementary Table S5), the distributions of proteins in the categories—macromolecule biosynthetic process, RNA splicing, Goμgi vesicle transport and cellular membrane organization were identified as highly overrepresented in total proteins, suggesting that these biological processes were activated by DENV infection (Fig. 3A). In comparison, the distributions of phosphoproteins in the biological processes including negative regulation of nucleobase, nucleoside, nucleotide and nucleic acid metabolic process, negative regulation of gene expression, chromatin modification, macromolecular complex assembly, RNA splicing, cell cycle, mRNA Processing and regulation of transcription were significantly higher than the overall distribution, implying that these processes were highly regulated by reversible protein phosphorylation in virus and host interaction (Fig. 3B). Nucleic acid metabolic process was enriched for both regulated proteins and phosphoproteins emphasizing its role in response to DENV infection.
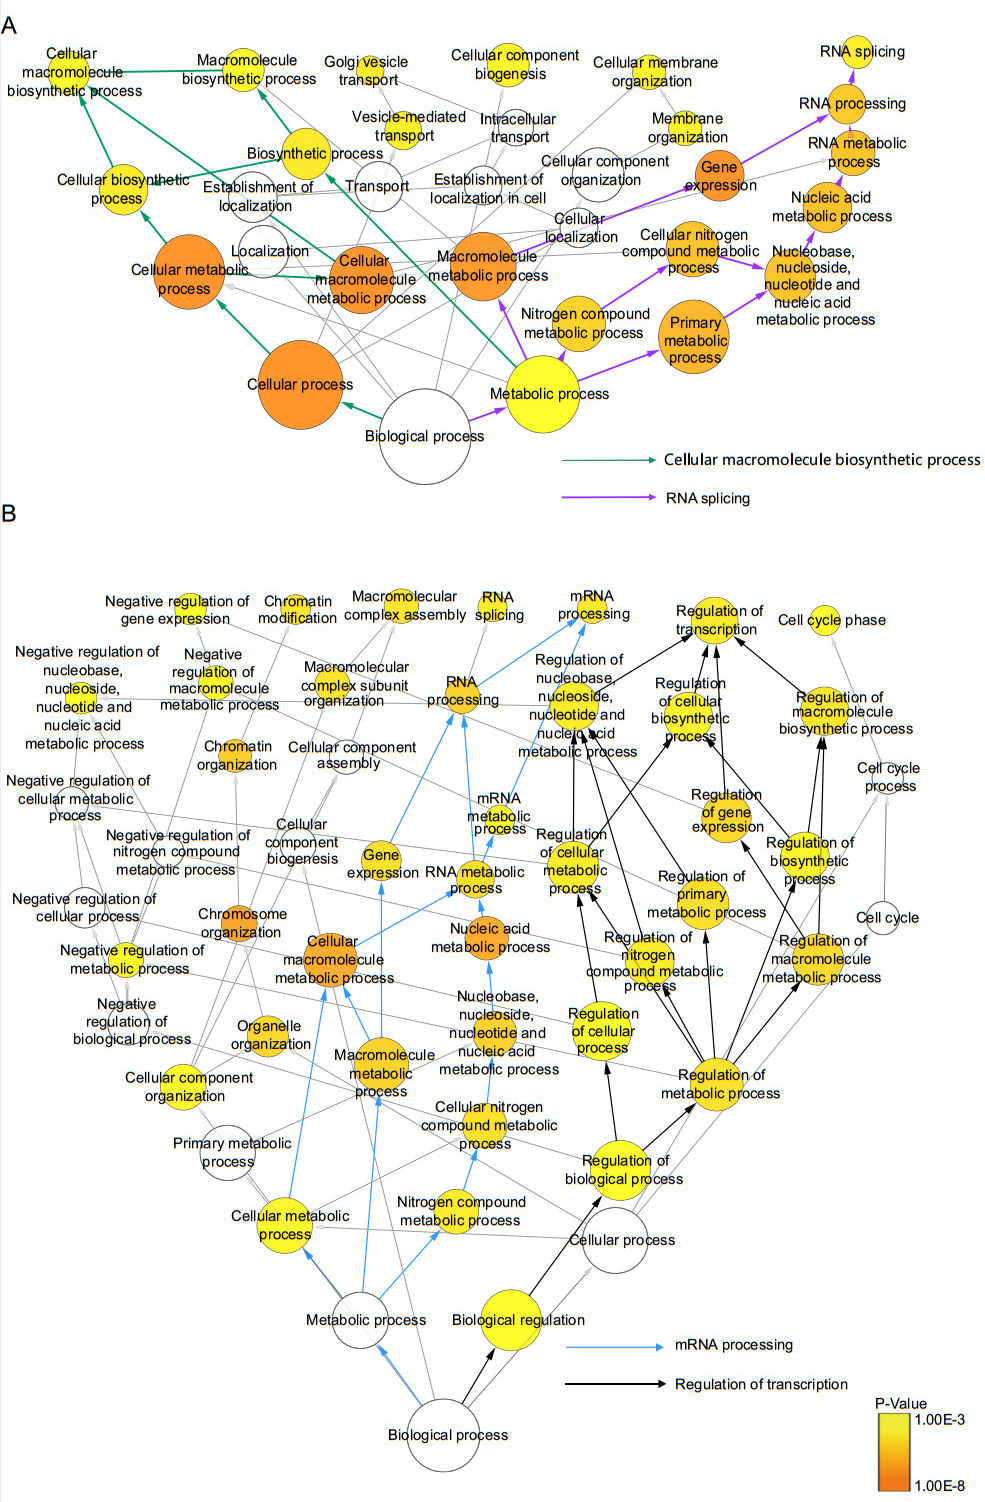
Figure 3. GO analysis of regulated protein and phosphoprotein. List of regulated total proteins and phosphoproteins were submitted to BINGO to perform a GO enrichment analysis. A Go analysis of regulated total proteins (P < 0.001). B GO analysis of regulated phosphoproteins (P < 0.001). Whole annotation is as reference. Area of circles represents included gene numbers. P < 0.001 defines overrepresent categories. Green line represents "Cellular macromolecule biosynthetic process". Purple line represents "RNA splicing". Blue line represents "mRNA processing". Black line represents "Regulation of transcription".
To better understand the host cellular response to DENV infection, annotations of all regulated proteins were examined manually. We found that the majority of regulated proteins were involved in RNA splicing and cellular macromolecule biosynthetic process. These two processes were found to be the two most overrepresented processes upon DENV infection with a low P values (highlighted in purple and green arrows, respectively in Fig. 3A). For protein phosphorylation, mRNA processing and transcriptional regulation were found to be the two most overrepresented processes in response to DENV infection (highlighted in blue and black arrows, respectively in Fig. 3B).
-
To explore potential protein network connections for the significantly enriched processes from GO analysis, the regulated proteins involved in the most enriched pathways were analyzed by using STRING in which the interactions were documented according to known and predicted protein–protein interactions. The resulting protein networks were visualized in Cytoscape (Fig. 4, detail information in Supplementary Table S6).
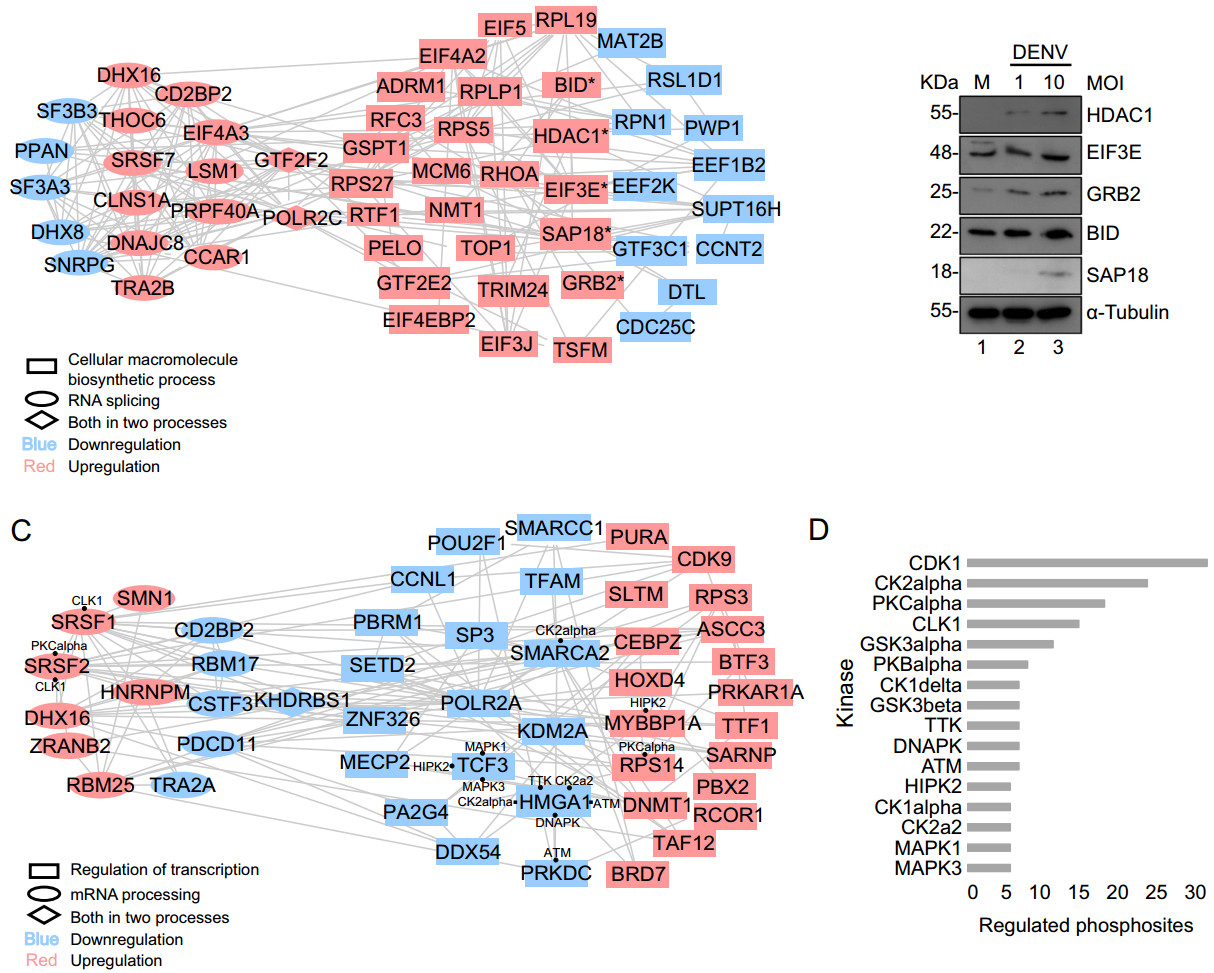
Figure 4. Protein–protein interaction network of regulated protein. List of "Cellular macromolecule biosynthetic process" and "RNA splicing" among total protein, "mRNA processing" and "Regulation of gene expression" among phosphoprotein were submitted to STRING to perform an interaction analysis and visualized by Cytoscape. A Network of "Cellular macromolecule biosynthetic process" and "RNA splicing" from regulated total proteins. The network includes 54 nodes (proteins) and 195 edges (interactions). Asterisk represents interested proteins. B Western blot validation of 5 interested genes. C Network of "mRNA processing" and "Regulation of gene expression" from regulated phosphoproteins. The network includes 48 nodes (proteins) and 133 edges (interactions). Black dot represents interacted predicted kinases. D Kinase prediction of regulated phosphoproteins.
For protein expression, proteins involved in RNA splicing and cellular macromolecule biosynthetic process were of great interests and chosen for protein–protein interaction analysis. A highly interacting protein network was formed, consisting of 54 individual proteins and 195 distinct interactions (Fig. 4A). Proteins interact not only with proteins involved in the same process but also with proteins in the other process. RNA splicing and cellular macromolecule biosynthetic process were represented in rectangle and ellipse, respectively, with diamond representing the overlap. Up/down-regulation information was also included and highlighted in red/blue for clear comparison. As showed in Fig. 4A, more proteins were found to be upregulated than downregulated in both processes.
Those proteins which showed regulated expression by virus infection and appeared to actively interact with other proteins might be the key players in the antiviral response. Based on our MS results and the protein–protein interaction analysis as well as previous knowledge, several proteins drew our attention, which were EIF3E, BID, HDAC1, GRB2, and SAP18. They were all upregulated upon DENV infection revealed by mass spectrometric analysis and were highly interacting with proteins involved in cellular macromolecule biosynthetic process (Fig. 4A).
EIF3E is the component of the eukaryotic translation initiation factor 3 (eIF-3) complex, which is required for several steps in the initiation of protein synthesis (Masutani et al. 2007). EIF3E has been reported as a binding partner of classical swine fever virus (CSFV) NS5A protein. Overexpression of EIF3E markedly enhanced CSFV genomic RNA replication, viral protein expression and production of progeny virus (Liu et al. 2018). BID is a proapoptotic Bcl-2 protein containing only the BH3 domain (Wang et al. 1996). BID interacts with BAX, leading to the insertion of BAX into organelle membranes and finally induces apoptosis. Although apoptosis has been detected in vivo and in vitro in response to DENV infection, the mechanism is not completely understood (Thongtan et al. 2004). In our work, BID was 1.7 fold higher in abundance after infection. It may be involved in DENV-induced apoptosis and was worthy for further investigation. GRB2 (Growth factor receptor-bound protein 2) is an adapter protein that provides a critical link between cell surface growth factor receptors and the Ras signaling pathway. It has been reported that HCV NS5A can specifically interacts with GRB2 and inhibits the MAPK/ERK pathway (Huynh et al. 2016). SAP18 (Sin3a-associated protein of 18 kDa) is a component of the SIN3-HDAC1 complex which can direct the formation of a repressive complex to core histone proteins and induce transcriptional repression (Zhang et al. 1997). SAP18 was also found to be correlated with RNA splicing (Singh et al. 2010). One work has find that HIV-1 IN protein can specifically interact with SAP18 and recruit the Sin3a-HDAC1 complex into HIV-1 virion. The deacetylase activity is important for the subsequent stages of viral replication (Sorin et al. 2009).
To verify our MS data, Western blotting analysis of selected host proteins was performed. As shown in Fig. 4B, Western blotting data showed that the proteins EIF3E, BID, HDAC1, GRB and SAP18 were upregulated as a result of DENV infection (Fig. 4B), consistent with our MS data.
For protein phosphorylation, phosphoproteins which were significantly regulated upon infection and involved in mRNA processing and regulation of transcription were also further looked into for protein–protein interaction analysis. A network consisting of highly interacting 48 phosphoproteins was formed and 133 distinct interactions between phospho-proteins in the same process and in the other process were illustrated in Fig. 4C. Equal number of upregulated and downregulated phosphoproteins was found to be involved in both processes.
Our data set provides a source of phospho-peptide sequences for exploring the network between different kinase families and their substrates. NetworKIN was used to generate a list of predicted potential kinases for the regulated phosphorylation sites. Prediction was based on comparison of the phosphorylation sites with reported consensus sequences for different protein kinases. The number of distinct phosphorylation sites for each kinase family was illustrated in Fig. 4D (detailed information in Supplementary Table S7. The kinase prediction of identified phosphorylation sites exhibited a broad range of kinase families which might target various host proteins in the process of virus infection. It suggests major role for the CDK1, CK2alpha, PKCalpha, CLK1, GSK3alpha and PKBalpha kinase families, implicating the greatest proportion of the identified distinct phosphorylation sites are their potential substrates. As marked in Fig. 4C, several upregulated proteins involved in both mRNA processing and regulation of transcription, as well as more downregulated proteins involved in regulation of transcription were found to be the substrates of those major kinase families.
Proteomics Analysis of Host Proteins upon DENV Infection
Functional Classification of Regulated Protein/Phosphoproteins in Response to DENV Infection
Protein–Protein Interaction Analysis of Most Overrepresented Processes in Response to DENV Infection
-
This is the first large-scale systematic quantitative proteomics and phosphoproteomics analysis of DENV-infected host cells. The expression patterns of 2263 host proteins were profiled, among which 321 were differentially regulated as a result of DENV infection. The phosphorylation levels of 2440 phosphorylated sites located in 799 phosphoproteins were investigated, among which 501 phosphorylation sites in 188 phosphoproteins showed regulated levels upon infection. To better understand the cellular response to DENV infection in K562 cells, a global map was created in which regulated host proteins/phosphoproteins are categorized according to their functions and cellular compartments (Fig. 5). The highest numbers of regulated proteins and phosphoproteins were found to be related to cellular macromolecule biosynthetic process, RNA splicing, chromatin modification and response to stimulus.
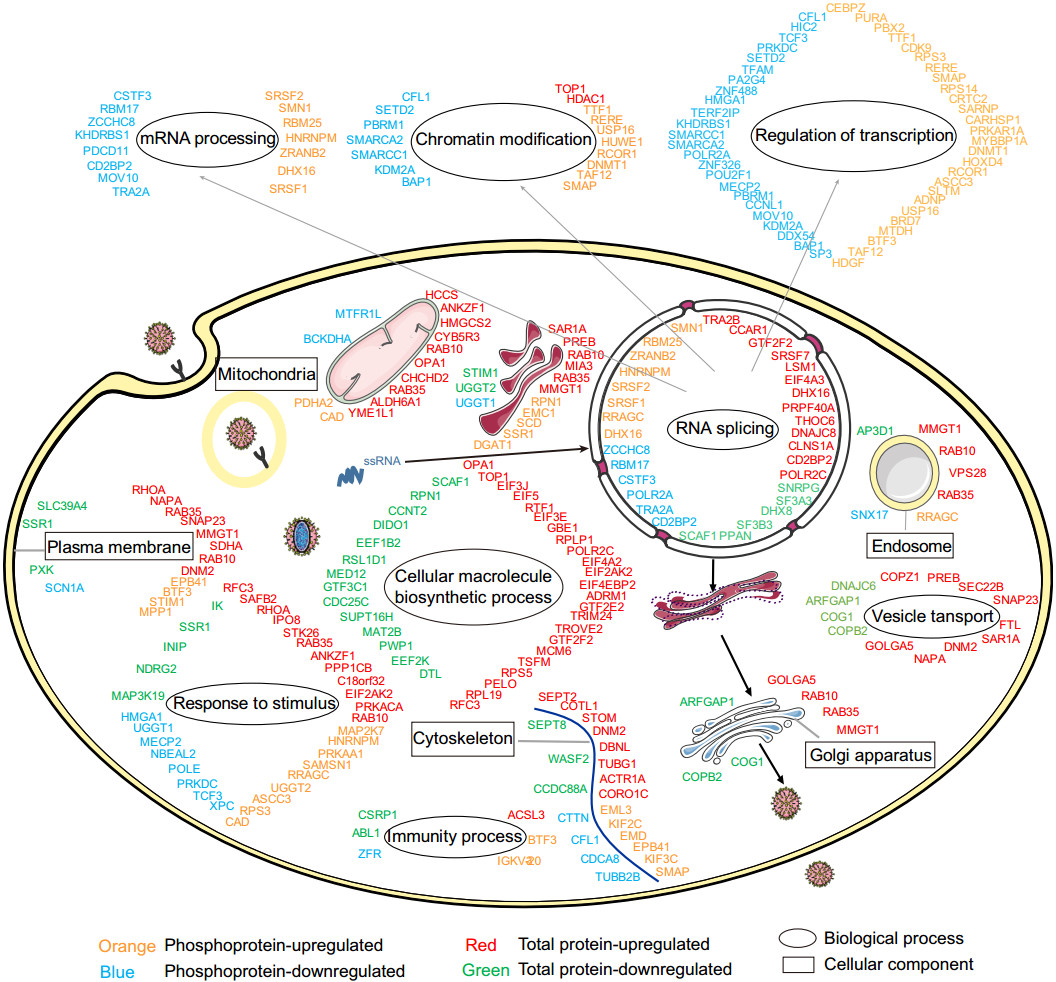
Figure 5. Global view of total proteins and phosphoproteins regulation in K562 cells in response to DENV infection. The regulated total proteins and phosphoproteins were grouped in different categories according to cellular component or biological process which annotated by GO.
The viral RNA replication of DENV is dependent on intracellular membrane system. The initial infection of DENV is mediated by clathrin-dependent receptor-mediated endocytosis. After that, the viral ssRNA is released from the endosomal vesicle and then replicated in virusinduced membrane vesicles in the endoplasmic reticulum (ER). At the later stage of infection, vesicles containing immature virions are transported along the cellular secretory pathway and pass through the trans-Goμgi network, where the host protease furin cleaves prM to generate mature virions that are secreted from the host cell (Yu et al. 2008). In our work, we found that a large number of proteins associated with intracellular membrane structure were regulated upon DENV infection. For example, we identified prolactin regulatory element binding protein (PREB) increased by ~ 1.5-fold upon DENV infection. PREB is a DNA-binding protein that specifically binds to a Pit1- binding element of the prolactin (PRL) promoter and then acts as a transcriptional regulator. PREB is mainly located in the ER (Fliss et al. 1999). It has been reported that PREB interacts with HCV NS4B and promotes HCV RNA replication (Kong et al. 2016).
On the basis of the GO analysis, cellular macromolecule biosynthetic process was identified as an overrepresented terminal processes in total regulated proteins. Lacking their own translational apparatus, viruses must recruit cellular ribosomes to translate viral mRNAs and produce the viral proteins for their replication. Here, we found several ribosomal proteins whose expression levels were regulated upon DENV infection, including RPS5, RPLP1, RPS27, RPL19, RPN1 and RSL1D1. In addition, several translational factors were also regulated, including EIF3E, EIF3J, EIF4A2, EIF5, EIF4EBP2, EEF1B2, EEF2K and TSFM. These proteins are key factors in cellular protein biosynthesis, whose functions in DENV infection were not reported before. The above results suggest that DENV infection modulates host cellular protein biosynthesis at different levels and these proteins may function with nontraditional activities.
Another biological process is RNA splicing which is significantly enriched in total regulated proteins. RNA splicing is a form of RNA processing in which a newly made precursor messenger RNA (pre-mRNA) transcript is transformed into a mature messenger RNA (mRNA) by removing introns and joining exons together. Many viruses can utilize RNA splicing to facilitate the expression of their own genes and regulate the host gene expression. The protease 2A (2Apro) of poliovirus induces a selective nucleo-cytoplasm translocation of several important RNA binding/splicing proteins (Alvarez et al. 2013). In addition, previous studies reported that herpes simplex virus 1 (HSV-1) ICP27 protein inhibited the pre-mRNA splicing by interfering with host cellular splicing machinery (Lindberg & Kreivi, 2002; Sciabica et al. 2003). In our work, we found that the expression levels of several host proteins involved in RNA splicing is regulated upon DENV infection, including GTF2F2, POLR2C, SF3A3, SF3B3, DHX8, DHX16, PRPF40A, DNAJC8 and SRSF7. Future studies on these regulated proteins may help us uncover the novel mechanism(s) of DENV regulating the host RNA splicing process.
The eukaryotic genome is presented as a chromatin structure whose fundamental structure is the nucleosome. Therefore, chromatin structure and histone modifications play key roles in gene regulation. Recent studies indicate that several viral proteins can interact with host epigenetic factors. For example, HIV-1 integrase (IN) directly binds to SAP18 in vitro and in vivo. SAP18 and components of a Sin3A-HDAC1 complex were specifically incorporated into HIV-1. They also found HIV-1 virion-associated HDAC1 is required for efficient early post-entry events (Sorin et al. 2009). In our work, some epigenetic factors, such as SAP18, HDAC1, HMGN2, SETD2 and KDM38 were significantly regulated upon DENV infection, suggesting that DENV may regulate the host cell epigenetic program to facilitate virus replication.
Phosphorylation is the most typical PTM that involves the transfer of a phosphate group by a protein kinase to a target protein substrate on specific amino acids, such as serine (S), threonine (T), and tyrosine (Y). Phosphorylation regulates the signal transduction involved in many cellular biological processes by modulating protein activity and protein–protein interaction, altering protein structure, and controlling subcellular distribution. In our work, mRNA processing and regulation of transcription were identified as overrepresented terminal processes in phosphoproteins upon DENV infection. In mRNA processing, we found that the phosphorylation level of mobility group AT hook1 (HMGA1) protein was downregulated. Previous study showed that HMGA1 acts as a transcription factor responsible for the proinflammatory response upon the infection of highly pathogenic avian H5N1 virus (Viemann et al. 2011). Therefore, it is possible that the downregulated phosphorylation level of HMGA1 is associated with the response of host immune system to DENV infection. Moreover, our quantitative phosphoproteome analysis has revealed many cellular proteins and biological processes that are involved during DENV-2 virus infection. Most of the identified proteins have not been reported in DENV infection before, and more studies will be needed in the future.
Recently, an interactome of DENV and host proteins was analyzed using affinity purification-mass spectrometry (AP-MS) (Shah et al. 2018). We compared our data with theirs and uncovered some overlapped proteins (Fig. 6, detailed information in Supplementary Table S8). Among these overlapped proteins, we noticed that MYBBP1A, PA2G4 and ZRANB2 also appeared in the network of mRNA processing and regulation of gene expression from regulated phosphoproteins. The phosphorylation levels of ZRANB2 and MYBBP1A were both upregulated, while PA2G4 was downregulated. Zinc finger Ran-binding domain-containing protein 2 (ZRANB2) can regulate alternative splicing and interact with several splicing proteins (Adams et al. 2001). ZRANB2 has been shown to bind mRNA, but modification of the ZRANB2 linker sequence will disturb the specific RNA binding capabilities.
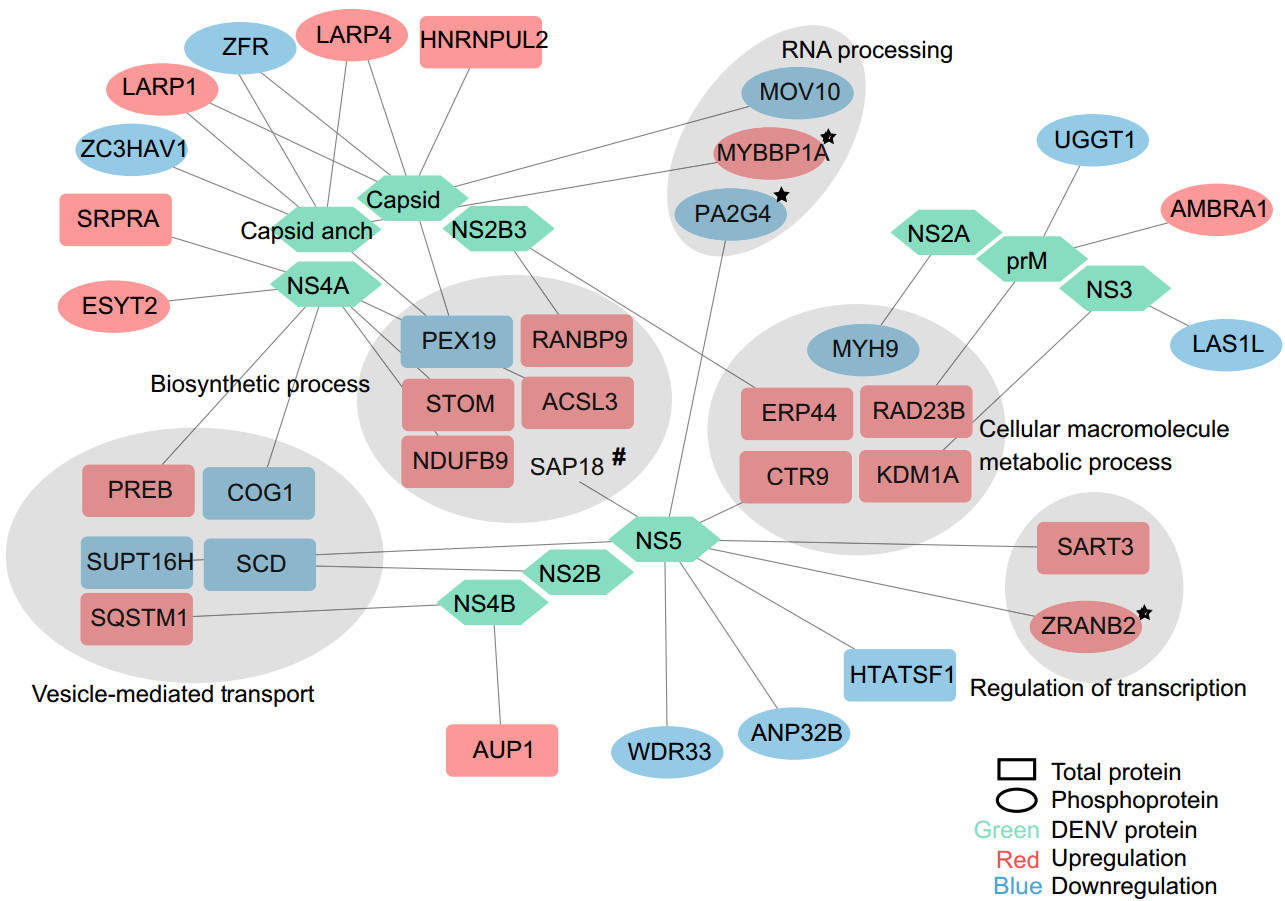
Figure 6. Protein-protein interaction between Dengue proteins and significantly regulated proteins. Regulated protein and phosphoprotein data in this study were compared with host protein which interacted with DENV protein data in reference (note: Comparative Flavivirus-Host Protein Interaction Mapping Reveals Mechanisms of Dengue and Zika Virus Pathogenesis). 33 proteins overlapped in two studies. Gray region represents significant enriched processes in Fig. 3A, 3B. Star represent interacted proteins in Fig. 4A, 4C. Hash represent SAP18 identified in ZIKV AP-MS experiment.
Here, we found the phosphorylation level of ZRANB2 was upregulated after DENV infection and the interaction with NS5 was identified, suggesting its potential role in DENV infection. One work has showed that the nucleolar protein MYBB1A could associate with replicated viral DNA in order to reorganize its morphologies in the late phases of adenovirus replication (Komatsu et al. 2018). The upregulated phosphorylation level of MYBB1A and its interaction with capsid protein may imply its role in DENV replication. Proliferation-associated protein 2G4 (PA2G4) regulates cell proliferation, differentiation and cap-independent translation of specific viral IRESs (Liu et al. 2006; Squatrito et al. 2004). Phosphorylation at Ser-361 regulates its nucleolar localization. It has been reported that PA2G4 was significantly down-regulated in cells transfected with HIV-1 Vpr (Zhang et al. 2014). We found that the phosphorylation level of PA2G4 is downregulated, along with its ability to interact with NS5, which may reveal its new function in dengue virus replication.
We also compared our work with other previous studies. Pando-Robles et al. have reported 155 cellular proteins were regulated in DENV-infected Huh-7 cells by using label-free LC–MS (Pando-Robles et al. 2014). Three proteins EFHD2, GPS1 and EIF2AK2 were also observed as regulated in our results. Another study of DENV infected A549 cells was analyzed by SILAC and mass spectrometry (Chiu et al. 2014), three up-regulated proteins ECI2, SDF2L1 and EEF1A2 and four downregulated proteins SCD, PWP1, DHX8 and MED12 were also detected in our study. As for flaviviruses JEV and ZIKV, four regulated proteins GPS1, EIF2AK2, HMGCS1 and RPN1 in JEV infected Hela cells and two proteins DPH5 and GTF2E2 in ZIKV infected C6/36 cells (Xin et al. 2017; Zhang et al. 2013) were also observed in our study.
In summary, this study systematically identified a number of host cellular proteins and phosphoproteins that were differentially regulated in response to DENV infection. Most of these proteins were involved in transcription regulation, RNA splicing and processing, immune system, cellular response to stimulus and macromolecule biosynthesis. Potential roles of several altered proteins as host responses to DENV were discussed, which could be related to cellular antiviral response or pathogenic mechanisms. Further investigations are needed to elucidate the functional significance of the other proteins with altered expression or modification. The present study provides comprehensive information of protein expression and phosphorylation, which is valuable for understanding the interplay between host and DENV.
-
This work was supported by the National Natural Science Foundation of China (31870827 to X.Zhao, 31670161 to X.Zhou., and 81873964 to Y.Q.), the Hubei Natural Science Foundation (2018CFB603 to X.Zhao) and the Fundamental Research Funds for the Central Universities (2042018kf0247 to X.Zhao). We are grateful for the technical support provided by Dr. Hui Zhao (Beijing, China).
-
XLZ and XZ designed the research; XLZ, MM, FY, DYW and JYX performed the research; XLZ, XZ, MM, FY, YJT and LTY analyzed the data; XLZ, MM and FY drafted the paper; XLZ, XZ and YQ revised the paper.
-
The authors declare no competing interests.
-
This article does not contain any studies with human or animal subjects performed by any of the authors.

 DownLoad: