


HTML
-
Since the emergence of coronavirus disease 2019 (COVID-19) caused by severe acute respiratory syndrome coronavirus 2 (SARS-CoV-2) in Wuhan, China, in December 2019 (Huang et al. 2020), this disease has rapidly spread across China and many other countries (WHO 2020). Mild COVID-19 was found in most patients with no obvious abnormal CT findings or manifestations of lung infection. Patients with the common type often presented with fever, respiratory symptoms and abnormal CT findings. Severe COVID-19 was diagnosed when the patients met one of the following criteria: (1) respiratory distress with a respiratory frequency ≥ 30/min; (2) oxygen saturation ≤ 93% at rest; or (3) oxygenation index (arterial partial pressure of oxygen/inspired oxygen fraction, PaO2/FiO2) ≤ 300 mmHg. However, patients with critical COVID-19 progressed rapidly to acute respiratory failure, acute respiratory distress syndrome, metabolic acidosis, coagulopathy, and septic shock. In clinical practice, it has been found that some patients' condition will suddenly worsen, which leads to challenges in treatment. The early identification of risk factors for severe illness facilitated appropriate treatment and prognosis. Therefore, it is necessary to make a comprehensive judgment of the patient's condition with laboratory findings.
Although a few studies have reported the epidemiologic features, molecular characteristics, clinical manifestations, chest images, and laboratory findings of patients with COVID-19 (Rothan and Byrareddy 2020; Xu et al. 2020), these studies have been mostly of cross-sectional studies and cannot reflect the whole course of the disease. To the best of our knowledge, a comprehensive investigation of dynamic change trajectories of multiple laboratory parameters over time in recovered patients with COVID-19 has not yet been reported. The temporal change patterns of laboratory data may provide insightful clues into the whole course of the disease. Therefore, it is essential to longitudinally identify differential laboratory characteristics in patients with COVID-19.
The present research aimed to investigate the longitudinal change patterns of laboratory data in recovered patients with COVID-19 and reveal the associations between laboratory findings and outcomes of patients to identify prognostic laboratory factors.
-
We performed an observational study on the laboratory characteristics of confirmed patients with COVID-19. A confirmed case of COVID-19 was defined as a positive real-time reverse-transcriptase-polymerase-chain-reaction (RT-PCR) assay result from sputum and throat swab specimens (Huang et al. 2020). In this multicenter study, 56 patients were recruited from three designated tertiary hospitals in Jilin Province including the First Hospital of Jilin University (n = 3), Changchun Infectious Disease Hospital (n = 39), and Siping Infectious Disease Hospital (n = 14), from January 21, 2020 to March 5, 2020. The validation set consists of 24 patients with COVID-19 from Jilin Infectious Disease Hospital, January 23, 2020 to May 16, 2020. The laboratory findings, epidemiological characteristics and demographic data were retrieved from electronic medical records (Supplementary Table S1). Data were extracted from local servers by experienced research physicians at each center and two researchers independently checked the data. The incubation period was defined as the interval from contact with the transmission source to the onset of symptoms. Specimens were collected from the patients according to each institution's protocols. In general, nasopharyngeal swabs, throat swabs and blood samples were collected for diagnostic testing from the majority of patients.
-
The laboratory confirmation of COVID-19 was achieved through the Changchun Centers for Disease Control and Prevention, Siping Centers for Disease Control and Prevention, or the Jilin Centers for Disease Control and Prevention. Sputum and throat swab specimens suspected to be positive were transported to the Jilin Provincial Centers for Disease Control and Prevention for laboratory diagnosis and to be re-confirmed. Specimens were tested by RT-PCR for SARS-CoV-2 RNA within 3 h. Virus detection was repeated twice every 24 h. The RT-PCR assay was conducted in accordance with the manufacturer's protocol (Shanghai bio-germ Medical Technology Co., Ltd., Shanghai GeneoDx Biotech Co., Ltd.). Patients with COVID-19 were discharged from the hospital once the results of two RT-PCR tests performed 24 h apart were negative for SARS-CoV-2. Laboratory assessments, including hematological and biochemical tests were performed in the four designated tertiary hospitals. As the disease progressed, all the updated for laboratory findings during the hospital stay were collected. The laboratory data for some patients were missing due to the absence of certain types of tests or delayed results.
For related information about the testing equipment of each hospital, see Supplementary Table S2. The four laboratories participated in and passed external quality assessments and proficiency testing by the Jilin Center for Clinical Laboratories. The test kits, calibrators, and quality control products were the same among the four hospitals. All doctors, technicians, and nurses in this study received unified training by the Health Commission of Jilin Province. The clinical parameters were compared with the common biochemical analyte and blood cell analysis reference intervals (RIs) published by Chinese adults Ministry of Health of the People's Republic of China in 2012 (Chinese National Health Committee 2012a, b). These RIs of the tests performed in the four designated tertiary hospitals were used according to the China Industry Standards.
-
To estimate the temporal trajectories of primary markers, local regression curves (loess) were diagramed by using the R locfit package. The corresponding pointwise 95% confidence intervals of the estimated values in days 0-30 were given with the aid of the bootstrapping methods (1000 bootstrapped replicates were made).
To identify which laboratory parameters have prognostic value predicting the patient recovery duration, Cox models using the specific parameters, age and sex as predictors were fitted first. The markers that had P values < 0.1 in the above Cox models, sex and age, were fed into three feature selection methods—the LASSO method, backward Cox regression with P value as the selection criteria and stepwise Cox regression with AIC as the selection criteria to further refine the list.
Using age, sex and the final selected parameters, a nomogram was made to illustrate how these features were associated with recovery. C-index statistics (Uno et al. 2011) were calculated to quantify the performance of the final model. All analyses were carried out using R language, version 3.6.1 (www.r-project.org).
Patient Selection and Data Sources
Laboratory Tests
Statistical Analysis
-
The transmission route of COVID-19 is shown in Supplementary Figure S1. The baseline characteristics of recovered patients with COVID-19 are shown in Table 1. Fifty-six patients diagnosed with common type COVID-19 in the three designated tertiary hospitals in Jilin Province were included in the study. The median age was 40 years, ranging from 10 to 87 years old (interquartile range, 28-52), and 26.8% (15/56) were older than 50 years. A total of 44.6% (25/56) of the patients were female. At the final date of research, all 56 patients had been discharged. The average length of hospital stay was 17 days (interquartile range, 11-20). In total, 12.5% (7/56) of the patients had a history of traveling to Wuhan, and 30.4% (17/56) had a history of traveling outside Wuhan. A total of 42.9% (24/56) were primary cases, who had not left Jilin Province recently but had a history of close exposure to imported cases, and 14.2 (8/56) were secondary cases, who had a history of close exposure primary cases.
Male (n = 31) Female (n = 25) Hospitalized time, d, M (P25-P75) 17 (14-21) 18 (11-20) Age, y, M (P25-P75) 40 (29-50) 41 (28-53) Travel history in Wuhan 5 (16.1) 2 (8.0) City Changchun 22 (71.0) 20 (80.0) Siping 9 (29.0) 5 (20.0) Age groups < 30 y 10 (32.2) 8 (32.0) 30-49 y 13 (41.9) 10 (40.0) 50-69 y 6 (19.4) 5 (20.0) ≥ 70 y 2 (6.5) 2 (8.0) Contact category Imported cases 15 (48.4) 9 (36.0) Primary cases 10 (32.2) 14 (56.0) Secondary cases 6 (19.4) 2 (8.0) Data are n (%) unless specified otherwise
y: year; d: dayTable 1. The baseline characteristics of recovered cases with COVID-19.
-
The laboratory findings of patients with COVID-19 from onset to hospital admission are shown in Table 2. Regarding leukocyte parameters, white blood cell (WBC), neutrophil (NE), lymphocyte (LY), and eosinophil (EO) counts below the lower limit of the RIs were observed in 14.3%-50.0% of patients, while both the basophil (BA) and monocyte (MO) counts beyond the upper limit of the RI were observed in 5.4% and 7.1% of patients, respectively. In terms of erythrocyte parameters, decreased red blood cell (RBC) counts, the levels of hemoglobin (HGB), hematocrit (HCT), mean corpuscular volume (MCV) and mean corpuscular hemoglobin (MCH) were observed in 3.6%-12.5% of patients. Regarding platelet parameters, platelet count (PLT) and thrombocytocrit (PCT) values below the lower limit of the RI were observed in 12.5% and 5.4% of the patients, respectively. In terms of coagulation parameters, the levels of activated partial thromboplastin time (APTT), prothrombin time (PT), and international normalized ratio (INR) above the upper limit of the RI were found in 8.6%-25.7% cases, while fibrinogen (FBG) levels below the lower limit of the RI were found in 17.1% cases. The concentration of high-sensitivity C-reactive protein (hsCRP) was higher than the upper limit of the RI in 48.8% of cases. Regarding serum cardiac markers, aspartate aminotransferase (AST), lactate dehydrogenase (LDH), creatine kinase (CK), creatinine kinase-muscle/brain activity (CK-MB), and cardiac troponin I (cTnI) values beyond the upper limit of the RI were observed in 6.4%-41.4% of the patients. In the liver function tests, alanine aminotransferase (ALT), γ-glutamyl transpeptidase (GGT), total bilirubin (TBIL), and direct bilirubin (DBIL) values above the upper limit of RI were found in 2.1%-23.4% of the patients, while cholinesterase (CHE), total protein (TP), albumin (ALB), globulin (GLB), and indirect bilirubin values below the lower limit of the RI were observed in 0.0%-57.4% of the patients. In kidney function tests, blood urea nitrogen (BUN) and creatinine (Cr) values above the upper limit of the RI were found in 2.1% and 4.3% of the patients, respectively. In electrolyte tests, potassium (K), sodium (Na) and chloride (Ca) values below the lower limit of the RI were observed in 4.2%-41.7% of the patients, respectively.
Analytes Reference intervals Median (P25-P75) Increase (n%) Decrease (n%) Male Female Leukocyte parameters WBC, ×109/L 3.50-9.50 5.24 (3.98-6.30) 1/56 (1.8) 8/56 (14.3) NE, ×109/L 1.80-6.30 3.40 (2.58-4.38) 3/56 (5.4) 9/56 (16.1) LY, ×109/L 1.10-3.20 1.20 (0.90-1.66) 1/56 (1.8) 21/56 (37.5) EO, ×109/L 0.02-0.52 0.02 (0.00-0.04) 0/56 (0.0) 28/56 (50.0) BA, ×109/L 0.00-0.06 0.02 (0.00-0.03) 3/56 (5.4) 0/56 (0.0) MO, ×109/L 0.10-0.60 0.31 (0.25-0.50) 4/56 (7.1) 0/56 (0.0) Erythrocyte parameters RBC, ×1012/L 4.30-5.80 3.80-5.10 4.69 (4.29-5.09) 2/56 (3.6) 6/56 (10.7) HGB, g/L 130-175 115-150 145 (133-158) 2/56 (3.6) 2/56 (3.6) HCT, L/L 0.400-0.500 0.350-0.450 0.420 (0.386-0.446) 1/56 (1.8) 7/56 (12.5) MCV, fL 82.0-100.0 89.6 (86.6-92.3) 3/56 (5.4) 2/56 (3.6) MCH, pg 27.0-34.0 31.0 (30.0-31.9) 4/56 (7.1) 2/56 (3.6) MCHC, g/L 316-354 345 (341-349) 3/56 (5.4) 0/56 (0.0) RDW, % 11.00-16.00 11.60 (11.28-11.90) 0/56 (0.0) 6/56 (10.7) Platelet parameters PLT, ×109/L 125-350 202 (164-231) 4/56 (7.1) 7/56 (12.5) MPV, fL 6.5-12.0 9.4 (8.6-10.0) 0/56 (0.0) 0/56 (0.0) PDW, % 9.0-17.0 12.5 (10.9-14.2) 4/56 (7.1) 0/56 (0.0) PCT, % 0.108-0.282 0.180 (0.149-0.199) 5/56 (8.9) 3/56 (5.4) Coagulation parameters TT, s 14.0-20.0 15.6 (15.0-16.2) 0/35 (0.0) 0/35 (0.0) APTT, s 22.2-38.0 34.7(31.9-36.2) 4/35 (11.4) 0/35 (0.0) PT, s 11.0-13.0 11.9 (11.6-13.0) 9/35 (25.7) 2/35 (5.7) INR 0.90-1.30 1.07 (1.00-1.16) 3/35 (8.6) 1/35 (2.9) FBG, g/L 2.00-4.00 2.20 (2.01-3.13) 5/35 (14.3) 6/35 (17.1) Cardiac markers parameters hsCRP, mg/L < 6.0 6.0 (2.4-22.6) 21/43 (48.8) - Mb, ng/ml 0.0-61.5 22.7 (19.4-26.0) 0/30 (0.0) 0/30 (0.0) cTnI, ng/ml < 1.50 1.30 (1.10-1.80) 12/29 (41.4) - CK, U/L 50-310 40-200 76 (55-114) 3/47 (6.4) 5/47 (10.6) CK-MB, U/L 0.0-24.0 15.0 (11.5-22.0) 10/47 (21.3) 0/47 (0.0) LDH, L 120-250 207 (184-258) 13/47 (27.7) 0/47 (0.0) AST, U/L 15.0-40.0 13.0-35.0 25.0 (20.0-29.5) 6/47 (12.8) 1/47 (2.1) Liver function parameters ALT, U/L 9.0-50.0 7.0-40.0 25.0 (19.0-44.0) 11/47 (23.4) 0/47 (0.0) GGT, U/L 10.0-60.0 7.0-45.0 23.5 (15.0-39.5) 8/46 (17.4) 0/46 (0.0) CHE, U/L 5000-12000 8426 (6981-9023) 0/39 (0.0) 0/39 (0.0) TP, g/L 65.0-85.0 67.8 (65.3-71.7) 0/47 (0.0) 10/47 (21.3) ALB, g/L 40.0-55.0 44.1 (42.2-45.7) 0/47 (0.0) 4/47 (8.5) GLB, g/L 20.0-40.0 23.7 (21.7-26.7) 0/47 (0.0) 7/47 (14.9) TBIL, pmol/L < 23.0 7.9 (6.8-12.8) 1/47 (2.1) - DBIL, pmol/L < 8.0 3.6 (3.2-5.1) 1/47(2.1) - IBIL, pmol/L 5.10-21.40 4.40 (3.45-7.00) 0/47 (0.0) 27/47 (57.4) Kidney function parameters BUN, mmol/L 3.10-8.00 2.60-7.50 3.69 (3.08-4.70) 1/47 (2.1) 9/47 (19.1) Cr, pmol/L 57.0-97.0 41.0-73.0 68.0 (58.8-76.7) 2/47 (4.3) 2/47 (4.3) CO2-CP, mmol/L 22.0-29.0 20.7 (18.9-22.4) 0/47 (0.0) 32/47 (68.1) Glu, mol/L 3.89-6.11 6.04 (5.54-6.69) 23/47 (48.9) 0/47 (0.0) Electrolyte parameters K, mmol/L 3.50-5.30 4.08 (3.89-4.37) 1/48 (2.1) 2/48 (4.2) Na, mmol/L 137-147 138 (137-140) 0/48 (0.0) 12/48 (25.0) Cl, mmol/L 99-110 100 (98-102) 0/48 (0.0) 20/48 (41.7) WBC, White blood cell; NE, Neutrophil; LY, Lymphocyte; EO, Eosinophil; BA, Basophil; MO, Monocyte; RBC, Red blood cell; HGB, Hemoglobin; HCT, Hematocrit; MCV, Mean corpuscular volume; MCH, Mean corpuscular hemoglobin; MCHC, Mean corpuscular hemoglobin concentration; RDW, Red blood cell distribution width; PLT, Platelet count; MPV, Mean platelet volume; PDW, Platelet distribution width; PCT, Thrombocytocrit; TT, Thrombin time; APTT, Activated partial thromboplastin time; PT, Prothrombin time; INR, International normalized ratio; FBG, Fibrinogen; hsCRP, High-sensitivity C-reactive protein; Mb, Myoglobin; cTnI, Cardiac Troponin I; CK, Creatine kinase; CK-MB, Creatinine kinase-muscle/brain activity; LDH, Lactate dehydrogenase; AST, Aspartate aminotransferase; ALT, Alanine aminotransferase; GGT, γ-glutamyl transpeptidase; CHE, Cholinesterase; TP, Total protein; ALB, Albumin; GLB, Globulin; TBIL, Total bilirubin; DBIL, Direct bilirubin; IBIL, Indirect bilirubin; BUN, Blood urea nitrogen; Cr, Creatinine; CO2-CP, Carbon dioxide combining power; Glu, Glucose; K, Potassium; Na, Sodium; Cl, Chloride Table 2. Laboratory findings of patients with COVID-19 at onset to hospital admission.
-
The trajectories of the laboratory tests over time are shown in Fig. 1. The average value of EO was near the lower limit of the RI at onset, and while it continued to significantly increase, the value was always below the upper limit of the RI until discharge. The average value of NE gradually increased from onset, peaking on day 12, and then steadily fell to the lower limit of the RI. The average value of LY approached the lower limit of the RI for the first 5 days and then rose slowly thereafter, reaching a peak around day 20. The NE/LY ratio peaked on day 5 and slowly declined thereafter. The average values of MO and BA showed U-shaped trends, peaking on day 17. The platelet parameters—PLT, PCT and mean platelet volume (MPV)—were within the RI in all cases. The average value of PCT peaked on day 7 and slowly declined thereafter, while the average value of MPV decreased sharply after day 7 and even approached to the lower limit of the RI. There was no significant change in erythrocyte parameters, including RBC, HGB, HCT, MCH, and MCHC. However, the average value of MCV showed an upward trend from day 8. The average value of cTnI sharply declined, and the average carbon dioxide combining power significantly increased throughout the course of the disease. Interestingly, the average value of serum sodium showed an upward trend after day 15. The other hematological and biochemical tests results were not shown a significant trend over time.
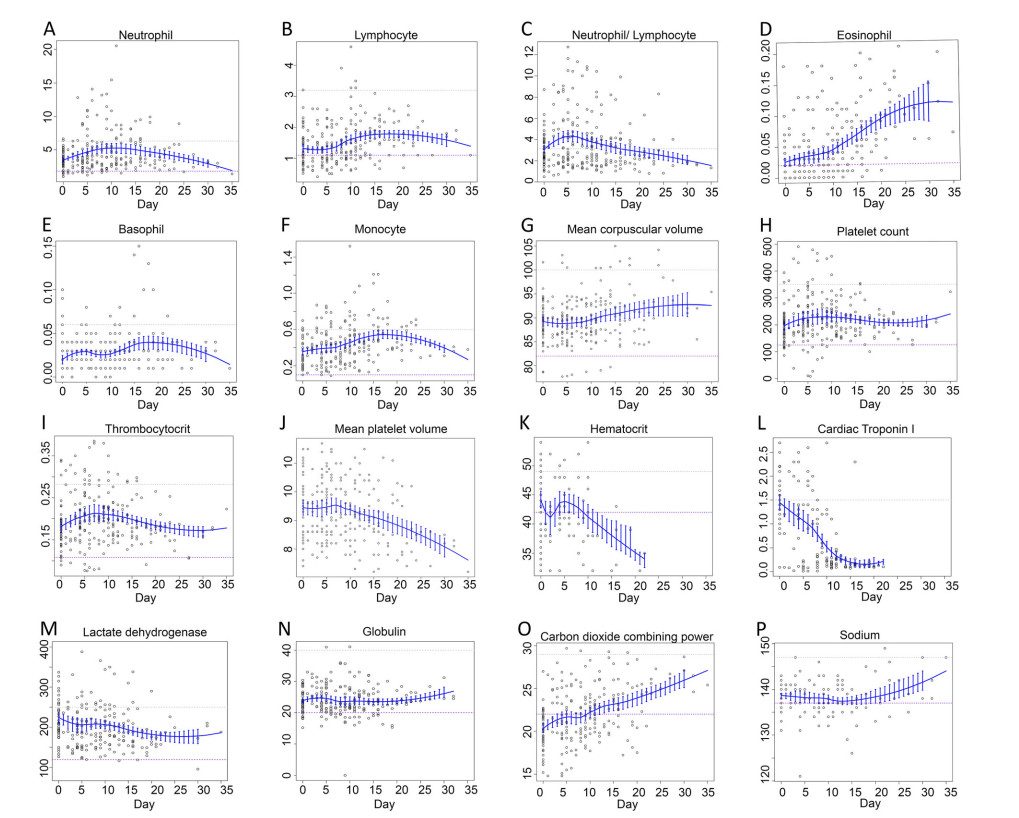
Figure 1. Temporal trajectories of laboratory parameters. A Neutrophil. B Lymphocyte. C Neutrophil/Lymphocyte. D Eosinophil. E Basophil. F Monocyte. G Mean corpuscular volume. H Platelet count. I Thrombocytocrit. J Mean platelet volume. K Hematocrit. L Cardiac Troponin I. M Lactate dehydrogenase. N Globulin. O Carbon dioxide combining power. P Sodium. Here, only the representative parameters over time are presented. The gray dotted line represents the upper limit of the RI, whereas the purple dotted line represents the lower limit.
-
The test results during the early period of hospitalization (< 5 days) are summarized as their respective means, which were used in the analysis hereafter. Cox regression models indicated that PCT, PLT, MO, LDH and GLB were predictors (P = 0.071, P = 0.041, P = 0.052, P = 0.023, P = 0.064, respectively). The correlation plot of these 5 variables, age and sex were presented in Fig. 2A. As expected, PCT and PLT were highly positively correlated with each other. Then the refined feature selection step was carried out with these 5 variables, age and sex as candidate markers. While LASSO selected LDH and GLB, backwards selection chose none of the variables, and stepwise selection chose LDH and PLT as predictors. Given that a certain feature selection method has its own advantages and disadvantages, the final model includes these three parameters in addition to age and sex which are clinically significant, as shown as the chosen predictors (Patil et al. 2020; Tadiri et al. 2020). The AUCs of these variables for predicting recovery at days 7, 14 and 21 with the LASSO, stepwise selection methods, and the final model are presented in Fig. 2B. Overall, the final model performed the best, justifying its superiority. As shown by the nomogram of this final model (Fig. 3), when PLT (P = 0.05), LDH (P = 0.03) and GLB (P = 0.58) levels in the early period were low, the chance of a quick recovery tended to decrease, whereas for a younger patient (P = 0.43) and a female patient (P = 0.33) the probability of quick recovery tended to be higher. Nevertheless, all parameters except LDH were not significant predictors.
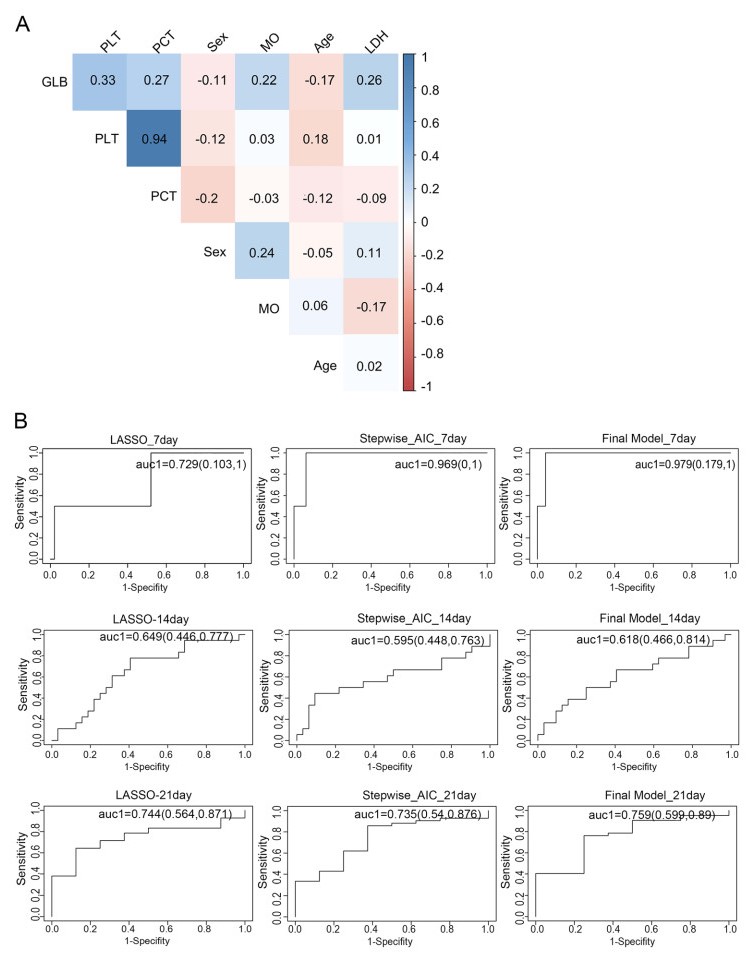
Figure 2. Feature selection process for relevant laboratory parameters that have prognostic value for recovery. A Correlation plot of the parameters selected by Cox regression models and age. B Areas under the ROC curves (AUCs) of three feature selection models for predicting recovery at days 7, 14 and 21. The final model including age, sex, lactate dehydrogenase (LDH), platelet count (PLT) and globulin (GLB) was used.
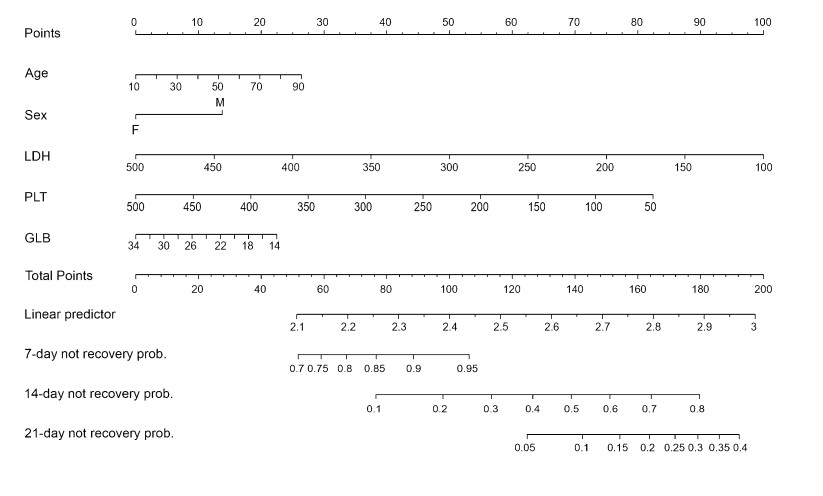
Figure 3. Nomogram to illustrate how age, sex, lactate dehydrogenase (LDH), platelet count (PLT) and globulin (GLB) in the early period of hospitalization (< 5 days) are related to recovery.
-
Twenty-four common type patients with COVID-19 were included in the validation set. For these patients, age ranged from 4 to 70, the ratio of male to female was 1.14:1 and the duration of hospitalization was 8-67 days.
Using the final model obtained from the training set (the previous cohort including patients from Changchun and Siping areas), as given in the nomogram plot, the risk scores of not recovery for the patients in the validation set were calculated and then the C-index statistics were obtained. As shown in Fig. 4, the corresponding C-indices are 0.825, 0.852, and 0.604 at the end points of day 8, day 14, and day 21, respectively (of note, since the shortest stay for the validation set is day 8, the C-index with day 7 cannot be computed).
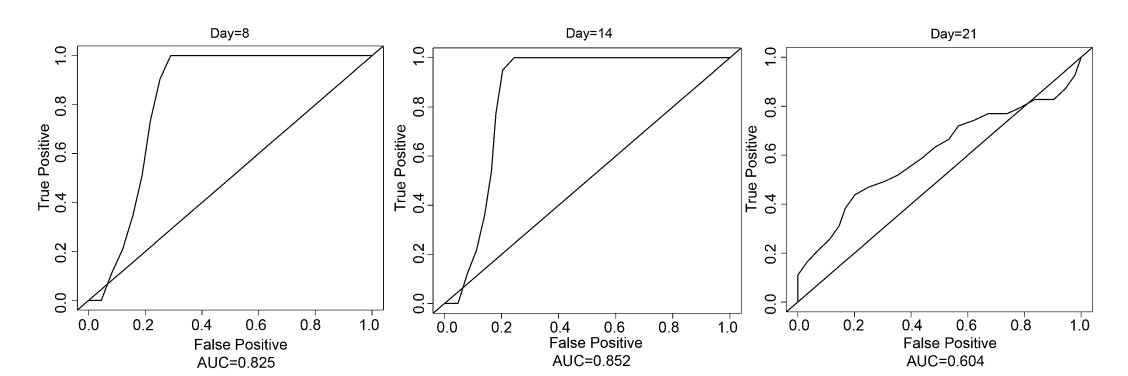
Figure 4. External Validation Results on the Jilin City data. AUC (C-index): Area under curve.
Demographics and Exposures
Laboratory Findings at Onset to Hospital Admission
Temporal Trajectories of Laboratory Tests
Predictors of Recovery
Validation of Nomogram Model
-
In this study, eosinopenia was found in 50.0% of cases at onset, which is similar to the incidence in recent research (Zhang et al. 2020). Continuously increasing patterns of EO could be used as an early predictor for COVID-19. For patients with confirmed COVID-19, a continuous rise in EO value may be a sign of recovery.
The value of LY in 37.5% of cases was reduced at onset in this study, consistent with other reports (Chen et al. 2020; Zhang et al. 2020). Lymphopenia showed that SARS-CoV-2 may mainly act on lymphocytes. In a recent study, the incidence of severe illness was 9.1% in patients aged ≥ 50 with an NE/LY < 3.13, and half of the patients aged ≥ 50 with an NE/LY ≥ 3.13 developed severe illness (Liu et al. 2020). In this study, the average NE/LY ratio was higher than 3.13 until the 16th day of onset, indicating that the of NE/LY ratio had a certain function. The PLT count was under the lower limit of the RI in 12.5% of cases at onset, which similar to recent research that reported low PLT counts in 12% of cases (n = 99) in a hospital (Chen et al. 2020) but significantly lower than the reported low PLT counts in 36.2% of cases (n = 1099) in another study (Guan et al. 2020). The change patterns of PCT and MPV indicated that platelet parameters may be predictors for recovery in patients. The erythrocyte parameters-counts of RBC, HGB, HCT, MCV and MCH were all less than 15% below the lower limit of the RI at onset. However, the average value of MCV showed an upward trend from day 8, indicating constant recovery thereafter. We speculate that with medical intervention, patients could experience an improvement approximately after 1 week of hospitalization. Further investigation is warranted to assess if day 7 or 8 is a turning point for recovery with medical intervention.
Acute cardiac injury was found in approximately 12% of patients with COVID-19 (Huang et al. 2020). In this study, the values of AST, LDH, CK, CK-MB and cTnI were beyond the upper limit of the RI and ranged from 6.4% to 41.4% at onset. Consistent with a previous report (Shi et al. 2020), cardiac injury was a common condition among hospitalized patients with COVID-19. Therefore, it is necessary to actively prevent and respond to myocardial injury and reduce the possibility of irreversible remodeling of the myocardium. Hepatic injury was also found, and kidney injury was not severe in this study. A disturbance of the electrolyte balance was also a common condition in patients with COVID-19. In this study, we found that multi-organ injuries, including immune deficiency, coagulation activation, myocardial injury, hepatic injury and kidney injury were observed in patients with COVID-19.
In this study, age, sex, LDH, PLT and GLB were selected as useful prognostic factors for recovery by the LASSO, backward and stepwise methods. A nomogram was established based on age, sex, LDH, PLT and GLB, and was used to predict the recovery rates at days 7, 14, and 21. All C-indices were more than 0.6 when verifying the nomogram. As indicated by a study (Laimighofer et al. 2016), a C-index of > 0.6 corresponds to a good predictive performance. Therefore, the final model including age, sex, LDH, PLT and GLB as predictors possessed a satisfactory prognostic value in predicting the recovery status of common COVID-19 patients.
The limitations of this study are as follows: (1) there were 56 patients enrolled in this study, and so the sample size may not be very large. Nevertheless, given that Jilin Province is one of the least affected area in China, this study covered approximately 70% of the diagnosed patients in Jilin Province. In addition, longitudinal laboratory measurements were collected, rendering the sample size of this study adequate for reliable statistical estimations; (2) The data of clinical manifestations in patients with COVID-19 were not included since this study mainly focused on the temporal trajectories of laboratory findings.
To the best of our knowledge, this is the first report of longitudinal change patterns of key laboratory parameters in patients with COVID-19. Age, sex, LDH, PLT and GLB may be used to predict the probability of recovery. The risk stratification and management of patients with COVID-19 could be improved according to the temporal trajectories of laboratory tests.
-
This work was supported by grants from Jilin Science and Technology Development Program (No. 20170623092TC-09, to Dr. Jiancheng Xu; No. 20190304110YY to Dr. Jiancheng Xu; No. 20200404171YY to Dr. Qi Zhou) and the First Hospital Translational Funding for Scientific and Technological Achievements (No. JDYYZH-1902002 to Dr. Jiancheng Xu).
-
JX, ST, and XZ conceived and designed the study. ST, CW and LC performed the analysis. XS, JW and XZ carried out tests. XZ, XS, JW, SL and QZ collected and analyzed the data. JX and ST wrote the first draft of the manuscript. All authors reviewed and edited the manuscript and approved the final version of the manuscript.
-
The authors declare that they have no conflict of interest.
-
This study was approved by the Ethics Committee of the First Hospital of Jilin University, Changchun Infectious Disease Hospital, Siping Infectious Disease Hospital and Jilin Infectious Disease Hospital. Data were collected from the electronic patient record.

 DownLoad: