


HTML
-
In addition to the intrinsic property of the tumor cells, inflammation in the tumor microenvironment also contributes to tumor initiation and progression (Grivennikov et al. 2010). Both tumor cells and normal cells in the tumor microenvironment can produce pro-inflammatory cytokines creating a milieu favorable for tumor progression (Balkwill 2009). One of the apical pro-inflammatory cytokines is TNFa (Wajant et al. 2003; Walczak 2011), which binds to TNFR1 or TNFR2 on the cell membrane to initiate signaling cascades. Depending upon the receptors, the adaptor molecules and the down-stream signaling intermediates engaged, TNF receptor signal complex orchestrates a myriad of cellular responses, such as apoptosis, autophagy, cell survival, inflammation, metabolism and cell migration in a cell-context dependent manner (Chen and Goeddel 2002; Aggarwal 2003). One of the best characterized TNFa signaling transducing molecules is NF-кB, a transcription factor (Hayden and Ghosh 2008), which is estimated to have over 1000 client genes (Lachmann et al. 2010). Thus the scope NF-кB plays in cellular physiology is wide-ranging (Baeuerle and Henkel 1994). And because of the critical roles it plays in cellular physiology, the activity of NF-кB is also regulated by myriad activators and inhibitors, which are spatially and temporally coordinated at every step of the signaling cascade and in a highly coordinated manner (Oeckinghaus and Ghosh 2009). Furthermore, the decoding of NF-кB signaling dynamic is also cell type specific (Nabe 1990).
As the master transcriptional regulator in the Treg developmental program, FOXP3 is rarely detected in normal nonlymphoid tissues other than lung and testes (Human Protein Atlas). Interestingly, FOXP3 is readily detected in a variety of tumor cell lines, including melanoma, cervical and breast cancers. As an X-linked tumor suppressor gene in breast cancer (Zuo et al. 2007), somatic mutations of FOXP3 or down-regulation of FOXP3 are commonly found in human breast cancer biopsy samples. These aberrant expression profiles also correlate significantly with HER-2/ErbB2 overexpression, two genes that are important in breast cancer biology (Zuo et al. 2007). More importantly, high FOXP3 expression has been correlated with favorable prognosis in patients with breast cancers (Merlo et al. 2009; Ladoire et al. 2011). However, whether there is an interplay between TNFa and FOXP3 remains inconclusive. It is also unknown how this interplay may affect cancer cell behavior.
A hallmark of typical autophagy (or macroautophagy) is the appearance of autophagosome, which subsequently fuse with lysosome to form autolysosome. This fusion process is stringently regulated by numerous positive and negative factors (Corona and Jackson 2018). Due to increase in energy consumption and cellular protein turnover in cancer cells, autophagy has been implicated in promoting cancer progression but repressing tumor initiation (Kimmelman 2011). Autophagy is known to be regulated by TNFa in a cell context dependent manner (Sivaprasad and Basu 2008; Ye et al. 2011). An important regulator of autophagy is synaptosome associated protein 29 (SNAP29) (Steegmaier et al. 1998), which is crucial in the fusion of lysosome and autophagosome (Itakura et al. 2012). In this process, SNAP29 binds to STX17, another core SNARE component on the autophagosome, which then binds to lysosome-localized VAMP8 to facilitate fusion of lysosome with autophagosome to deliver the lysosomal enzymes to degrade the entrapped contains (Wong et al. 1998).
Cellular prion protein (PrP) is a highly conserved and ubiquitously expressed GPI-anchored glycoprotein on the cell membrane (Prusiner and DeArmond 1990). PrP has been reported to have a plethora of functions, such as regulating cellular signaling, anti-apoptosis, copper homeostasis, autophagy and cell migration (Brown et al. 1997; Mouillet-Richard et al. 2000; Hugel et al. 2004; Roucou et al. 2005; Gao et al. 2019). Up-regulation of PrP has been detected in many cancers, including pancreatic cancer, gastric cancer, colon cancer, breast cancer, melanoma and oral squamous cells carcinoma (Li et al. 2010; Déry et al. 2013; Zhou et al. 2014; Corsaro et al. 2016; Lee et al. 2017; Atkinson et al. 2019). In some of these tumors, such as PDAC and melanoma, PrP exists as pro-PrP as defined by retaining its GPI-peptide signaling sequence (GPI-PSS) (Li et al. 2009, Li et al. 2010), of which a filamin A (FLNa) binding motif exists. FLNa is a cytolinker protein that links cell surface receptors, such as integrins to the cytoskeleton. FLNa thus plays an important role in cellular adhesion and migration (Stossel et al. 2001; Feng and Walsh 2004; Nakamura et al. 2011). Binding of pro-PrP to FLNa in cancer cells disrupts the normal physiologic function of FLNa, rewiring the cytoskeleton and rendering the tumor cells more aggressive in vitro and in vivo (Li et al. 2009). Most importantly, over-expression of PrP in PDAC, colon cancer and gastric cancer is correlated with poor prognosis of the patients (Li et al. 2009; Zhou et al. 2014; Atkinson et al. 2019).
Previously, we reported that PrP is required for TNFa induced NF-кB signaling activation in cancer cells when the cells are stimulated with TNFa for a short period time (Wu et al. 2017). In this setting, TNFa activation of NF-кB requires ubiquitination of receptor-interacting serine/threonine kinase 1 (RIP1) and TNF receptor-associated factor 2 (TRAF2). TNFa treatment increases the physical interaction between PrP and the deubiquitinase tumor suppressor cylindromatosis (CYLD). We proposed that PrP traps CYLD to prevent it from binding and deubiquitinating RIP1 and TRAF2. This interaction increases the availability of NF-кB for signaling, thus leading to proinflammatory cytokines production (Wu et al. 2017).
While PrP is important in mediating NF-кB signaling with TNFa treatment, it remains to be determined whether and how TNFa regulates the levels of PrP, and therefore affecting cancer cells behavior. Here, we report that TNFa treatment inhibits FOXP3 transcription to decrease the expression of SNAP29, which in turn reduces the formation of autolysosome, leading to increase of PrP and cancer cells migration. Thus, the FOXP3-SNAP29-PrP axis plays an important role for cancer cell migration under inflammation condition. Targeting this pathway may provide a potential therapeutic approach for cancer treatment.
-
M2 melanoma cell line was provided by Professor Thomas Stossel, Harvard Medical School and was grown in Minimum Essential Medium (MEM) (Gibco, NY, USA) with 10% fetal bovine serum (FBS) (Gibco), 100 U/mL of penicillin and streptomycin (PS). A549 cell line was purchased from ATCC and was cultured in RPMI 1640 medium (Gibco) supplemented with 10% FBS (Gibco), 1% sodium pyruvate, 1% GlutaMAXTM-1, 100 U/mL of PS. All cells were cultured in a 37 ℃, 5% CO2, 95% humidity incubator. Both cell lines have been tested as Mycoplasma free. PRNP null M2 melanoma cell line (38PrP-/-) was preserved in our laboratory.
Anti-PrP monoclonal antibodies (mAbs) (4H2) were produced and characterized as described (Yang et al. 2014) Abs against b-Actin were purchased from Tianjin Sungene Biotech (Tianjin, China); Abs against SQSTM1, LC3, SNAP29, LAMP1, LAMP2, FOXP3, IKZF1 were purchased from Santa Cruz Biotechnology (Dallas, USA). Alexa Fluor® 488 nm conjugated goat anti-mouse IgG, Alexa Fluor® 555-phalloidin and lipofectamine 2000 were purchased from Invitrogen (Carlsbad, USA); 6-Diamidine- 2'-phenylindole dihydro-chloride (DAPI) and proteinase inhibitor cocktail were purchased from Roche (Mannheim, Germany). Cbz–Leu–Leu–leucinal (MG132) and 3-MA were purchased from Sigma Chemicals (Missouri, USA). Cycloheximide, Chloroquine diphosphate, sp600125, QNZ, U0126, SB203580 were purchased from Selleck Chemicals (Texas, USA). Recombinant human TNFa was purchased from Pepro Tech (New Jersey, USA) and used at the concentration of 20 ng/mL.
-
The PRNP null M2 cells (38PrP-/-) were transduced by a lentiviral vector pHAGE expressing FLAG-PrP. The primers were listed in Supplementary Table S1. As a control, empty lentiviral vector was used to transduce 38PrP-/- cells with the same procedures.
-
To generate SNAP29 null M2 cell line, we used pX459 V2.0 (Kato-Inui et al. 2018) empty plasmid, the primers (100 μmol/L) (listed in Supplementary Table S2) were annealed and ligated to PX459 vector. The recombinant plasmids (2 μg) were transfected into M2 cells using Lipofectamine 2000 reagent (6 lL). Two days posttransfection, 2 μg/mL puromycin was added into the cell culture medium for 3 days. Single clones were selected and detected by DNA sequencing and Western blotting.
To generate FOXP3 null M2 melanoma cells, we used empty plasmid lentiCRISPRv2 puro (Sanjana et al. 2014). The targeted sequences were listed in Supplementary Table S2. Recombinant construct (5 μg) with pMD2G (2.5 μg) and PSPAX2 (3.75 μg) were co-transfected into 293 T cells in a 10 cm dish for 72 h. Cell culture medium was filtered with 0.45 lm filter. The retroviral stocks were used to infect M2 cells supplemented with 7.5 μg/mL polybrene (Sigma, USA) for 6 h, and cultured in fresh culture medium for 48 h. Cells were then selected with 2 μg/mL puromycin (Invivogen, USA) for 3 days.
To generate PRNP, SNAP29, and FOXP3-silenced A549 cells, the short hairpin RNAs were cloned into PLKO.1 plasmid. Lentiviruses were produced in HEK293T cells. PLKO.1 recombinant construct (5 μg) with pMD2G (1.25 μg) and pspAX2 (3.75 μg) were co-transfected into 293 T in a 10 cm petri dish for 72 h. All the other steps were the same as above. Knockout or knockdown effect was assayed by immunoblotting or by qPCR. The targeted sequences by shRNA were also listed in Supplementary Table S2.
-
PcDNA3.1-FOXP3 was constructed with the primers listed in Supplementary Table S1 using the cDNA cloned from M2 cells. The PCR-amplified sequences were gel purified and digested with BamHI and HindⅢ at 37 ℃ for 1 h (h). The digested sequences were further gel purified and inserted into pcDNA3.1 vector by standard molecular biology techniques.
PGL-1-2000 (SNAP29 protein promotor sequence) was amplified with the primers listed in Supplementary Table S1 using genomic DNA purified from M2 cells. The amplified sequences were gel purified and digested with MIUI and HindⅢ at 37 ℃ for 1 h. Cloning process is the same as FOXP3. PGL-1-1000, PGL-1-500, PGL-△1-500, PGL-△(161–168) were amplified with the primers listed in Supplementary Table S1 using PGL1-2000 promotor plasmid.
-
100 μL media containing 5 × 10³ cells were loaded in each well in a 96-well plate and cultured for 12 h. Cultured cells were treated with or without 20 ng/mL TNFα for 24 h, and 20 μL MTS were added to each well at 37 ℃ for 2 h. Absorbance was measured at 490 nm.
-
Cells were cultured in a 6-well plate until reaching 100% confluency. Wounds were created with a tip-cut 200 μL pipette tip. The cells were then subjected to treatment with TNFα (20 ng/mL) in a 6-well plate for 24 h and the cell culture medium was discarded. After washing 3 times with 37 ℃ PBS. Prewarmed fresh culture medium was added. The wound areas were imaged at 0 h, 24 h using inverted microscope. Image J (NIH) software was applied to quantify the wound areas.
-
Cells were serum starved in a 6 cm petri dish for 24 h. Trypsinized and re-suspended cells (5 × 10⁴) were then seeded in the upper chamber with 100 μL culture medium, and the lower chamber was filled with 750 μL culture medium with or without TNFα. Cells were cultured for an additional 24 h, and cancer cells in upper chamber were scraped with a Q-tip before fixing with 4% (w/v) paraformaldehyde for 30 min at RT. After fixation, cells at the bottom chamber were stained by 0.1% crystal violet for 30 min, and rinsed with flowing water. Images were taken with Olympus microscope.
-
The cells were rinsed three times with ice-cold phosphatebuffered saline (PBS). Lysis buffer (20 mmol/L Tris–HCl (pH 7.5), 150 mmol/L NaCl, 1 mmol/L EDTA, 1 mmol/L EGTA, 1% Triton X-100, 2.5 mmol/L sodium pyrophosphate, 1 mmol/L b-glycerol phosphate, 1 mmol/L Na3VO4, 1 mmol/L phenylmethylsulfonyl fluoride (PMSF), a protease inhibitor cocktail) was added into the cell culture petri dishes according to Li et al. (2009). Protein concentration was quantified using Coomassie brilliant blue G250 method and subjected to western blotting analysis.
The prepared samples were mixed with 4 × SDS loading buffer [40% glycerol (V/V), 250 mmol/L Tris–HCl pH 6.8 (V/V), 8% SDS (W/V), 0.04% bromophenol blue (W/V), and 20% 2-mercaptoethanol (ME) (V/V)]. Cell lysis were then heated at 100 ℃ for 10 min (mins) and loaded onto a 10% SDS-PAGE [30% Acrylamide solution (3.3 mL), 1 mol/L Tris–HCL (pH 8.8) (3.73 mL), 10% SDS 100 μL), TEMED 10 μL), 10% ammonium persulfate (APS) (50 μL), H2O 2.78 mL)], After electrophoresis, all proteins were transferred to a 0.45 lm nitrocellulose (NC) membrane (Merck Millipore, USA). NC membranes were then blocked in 3% bovine serum albumin (BSA) buffer with TBST (Tris buffered saline (TBS) plus 0.1% Tween- 20) at room temperature (RT) for 2 h and incubated with primary Abs overnight at 4 ℃. Bound primary Abs were then detected by corresponding HRP-conjugated secondary Abs. All proteins were quantified according on densitometry using the Image J software (NIH).
-
Cells were seeded on poly-L lysine coated glass bottom petri dishes (NEST, China). After cultured for 24 h, cells were rinsed twice with ice-cold PBS and fixed in 4% paraformaldehyde for 10 min at RT. After blocking with 1% BSA in PBST for 2 h at 25 ℃, the primary Abs were incubated with cells for 2 h at RT. Bound primary Abs were detected with Alexa Fluor-conjugated goat antimouse or rabbit anti-mouse specific Abs for 1 h. The nuclei were counterstained with DAPI (500 ng/mL) for 5 min. F-actin were stained with Alexa FluorTM 555 Phalloidin for 1 h at RT. The petri dish was then covered with anti-fade fluorescence medium (Beyotime) and the images were taken by confocal microscopy (UltraView Vox confocal microscope, Perkin Elmer).
-
Total RNA was extracted from cultured cells using the total RNA purification kit (GeneMark, Taichung, Taiwan) as instructed. Briefly, 1 μg of RNA was reverse transcribed using a PrimeScriptTM RT reagent kit with gDNA eraser (TaKaRa, Shiga, Japan). qPCR procedure was carried out using SYBR Green Supermix (Bio-Rad, CA, USA) on a Bio-Rad ConnectTM real-time PCR instrument (CFX ConnectTM Optics Module). The volume of each reaction is 20 μL. The template was diluted 10 times and b-Actin was used as a reference gene. Gene-specific primers were listed in Supplementary Table S3.
-
To determine the signaling pathways stimulated by TNFα, cells were cultured in a 12-well plate and were treated with 20 ng/mL TNFα in each well. 20 μmol/L sp600125 (JNK inhibitor), 20 μmol/L QNZ (NF-кB inhibitor), 20 μmol/L U0126 (MAPK inhibitor), 10 μmol/L SB203580 (p38MAPK inhibitor) was added separately into each well for 12 h. Cell lysates were collected and subjected to Western blot analysis.
-
Cells were seeded in a 6-well plate at about 80% confluency. mCherry-GFP-LC3 (2 μg) plasmid (a gift supplied by Professor Mingzhou Chen at Wuhan university, China) was transfected into M2 or A549 cells with Lipofectamine 2000 (6 μL) according to the manufacturer's protocol, and TNFα was added into medium for 12 h, cells were transferred into glass bottom dishes (NEST, China) and cultured for additional 24 h with treatment. The cells were then fixed in 4% paraformaldehyde for 20 min at RT. After blocking with 1% BSA in PBST for 2 h at RT, cells were counterstained with DAPI (500 ng/mL) for 5 min and the images were taken with a confocal microscopy. The graph shows the quantification of autophagosomes and lysosome by counting the average number of dots (green and red) in indicated number of cells from three experiments.
-
To determine the degradation pathway of PrP, cells were cultured in a 12-well plate at about 80% confluence. 100 μg/mL CHX, 5 mmol/L 3-MA, 20 μmol/L MG132, 50 μmol/L CQ were added to the plate separately or jointly as indicated for 12 h. Cell lysates were collected and subjected to Western blot analysis.
-
To show that TNFα partially blocked fusion between autophagosome and lysosome, we used bafilomycin A1 to treat A549 cells. GFP-mCherry-LC3 (2 μg) plasmid was transfected into M2 or A549 cells with Lipofectamine 2000 (6 μL) according to the manufacturer's protocol, and TNFα was added into medium for 12 h, cells were transferred into glass bottom dishes (NEST, China) and cultured for additional 24 h with treatment. 2 h before taking pictures, bafilomycin A1 (100 nmol/L) was added into the culture medium for cells treated with TNFα.
-
1 × 10⁵ cells of M2 were seeded in each well of a 24-well plate. 8 h later cells were transfected with lipofectamine 2000 (3 μL) containing pcDNA3.1-foxp3 (0.5 μg), pGLpromotor (0.3 μg), PRL-SV40 (0.1 μg) for each well in a 24-well plate. After 36 h, luciferase assays were performed using a dual-specific luciferase assay kit (Promega, Madison, WI) according to the manufacturer's protocol. All reporter assays were repeated at three times.
-
Student's t test (two-tailed) was used to analyze the data. All the experiments were repeated three times as indicted in the manuscript. Immunoblots analyses were performed with ImageJ. Quantitative data are expressed as the mean ± standard error of the mean. P < 0.05 was considered statistically significant.
Cell Lines, Antibodies and Reagents
Rescuing PrP in PRNP Null Cells
Establishment of Knockout and Knockdown Cell Lines
Construction of Plasmids
MTT Assay
Cell Migration Assays
Transwell Migration Assay
Western Blot Assay
Immunofluorescence Staining
RNA Extraction and Quantitative Real-Time PCR (RT-qPCR)
Signaling Pathway Analysis
Autophagy Analysis
PrP Degradation Assays
Bafilomycin A1 Treatment
Reporter Assays
Statistical Analyses
-
First, we investigated whether PrP expression affects cancer cell migration under TNFα stimulation. We knockedout PRNP in M2 cells by CRISPR/Cas9 or down-regulated PRNP in A549 cells by using shRNAi (Supplementary Fig. S1A), and then treated the silenced cells and control cells with or without TNFα for 24 h (h). It appears that cancer cells expressing PrP migrate faster when treated with TNFα in wound healing and transwell assays (Fig. 1A, 1B). This response is absent when PRNP is silenced (Fig. 1A, 1B, mid-panels). On the other hand, TNFα treatment does not affect cancer cell proliferation (Supplementary Fig. S1B). More importantly, when PrP expression is re-introduced in PRNP null M2 cells (Supplementary Fig. S1C), the rescued cells regain their ability to respond to TNFα treatment with increased migration (Fig. 1C). Hence, TNFα-stimulated cancer cell migration is PrP dependent.
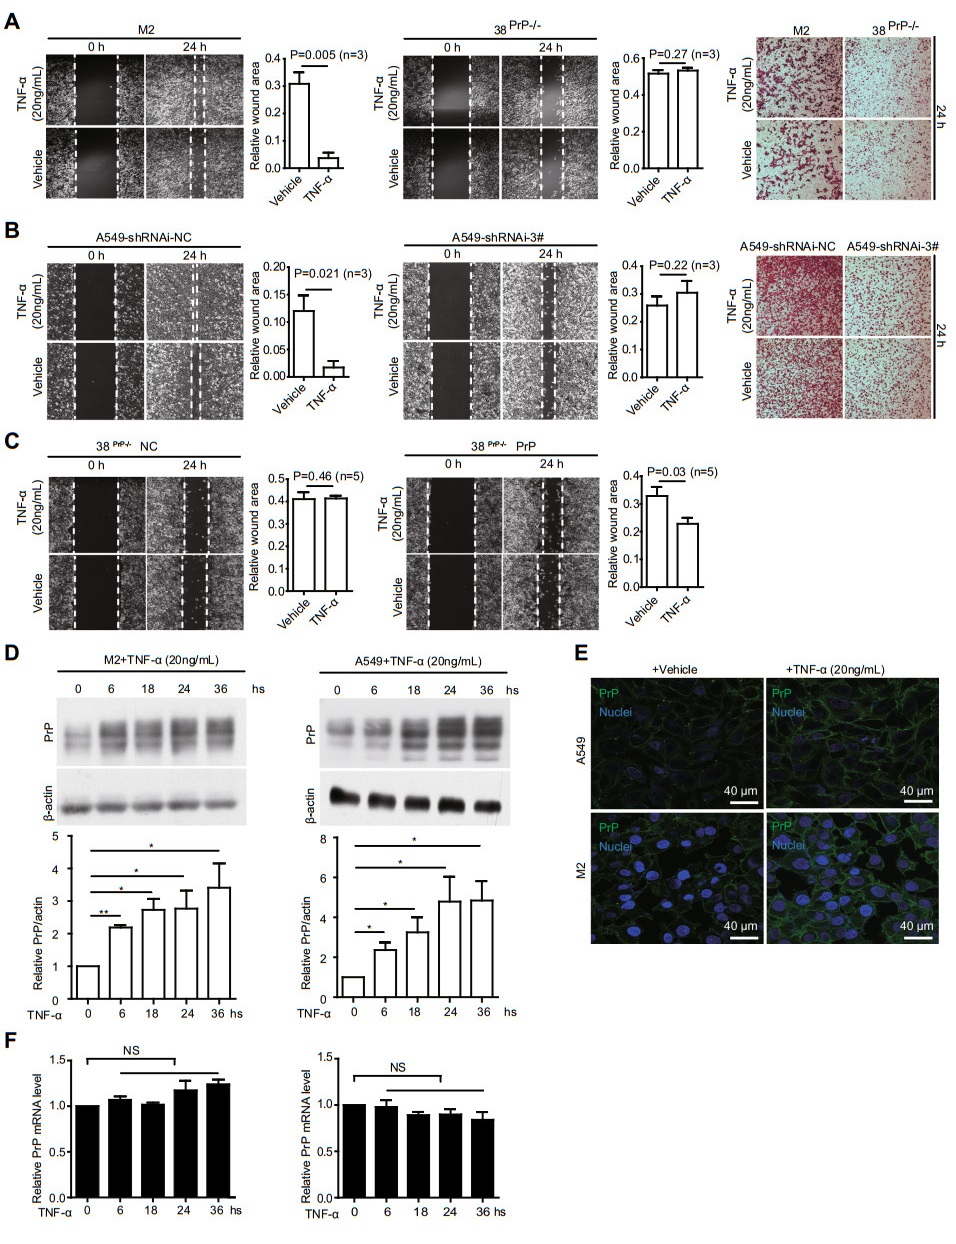
Figure 1. Cancer cells show a PrP dependent TNFα stimulated migration. A and B M2 or A549 but not PRNP null M2 (38PrP-/-) or PRNP silenced A549 cells (shRNAi-3#) showed a TNFα stimulated migration. PrP expressing M2 (1A, 1st and 3rd panels) or A549 (1B, 1st and 3rd panels) cells showed a higher mobility when treated with TNFα for 24 h based on wound healing and transwell assays. However, in the absence of PrP expression, TNFα treatment did not stimulate cancer cell migration (1A and 1B, middle panels and 3rd panels), objective magnification 10×. C When PrP was re-introduced back in PNRP null M2 cells, TNFα again activated cancer cell migration at 24 h post treatment based on a wound healing assay. Statistical analysis of five independent experiments showed that TNFα significantly stimulated PrP expressing cancer cell motility. Wound area was defined by pixels measured with IMAGE J software as following: the wound area pixels from time 24 h / pixels from time zero. 38PrP-/-NC: empty vector control, 38 PrP-/- PrP: PrP rescued cell line, objective magnification 10×. D TNFα treatment increased PrP expression in M2 and A549 cells. Immunoblotting of cell lysates with PrP specific antibody 4H2 showed that TNFα induced significantly more PrP expression at 6 h post treatment. *: P < 0.05; **: P < 0.01 (n = 4). PrP and actin protein levels were quantified using pixels measured by ImageJ. E Confocal immunofluorescence staining of PrP showed that TNFα treatment increased PrP expression on the cell membrane. F RT-qPCR showed that PRNP mRNA level was not significantly enhanced after TNFα treatment. Error bars represented standard error of the mean (SEM) of indicated experiments. Other than indicated, all experiments were independently repeated at least three times with similar results.
Since TNFα stimulated cancer cell migration depends on PrP expression, we investigated whether PrP level is upregulated in M2 and A549 cells after TNFα treatment. The expression of PrP is increased significantly at 6 h post treatment as demonstrated by immunoblotting (Fig. 1D). Immunofluorescence staining shows that PrP is detected on the cell surface (Fig. 1E). To determine whether upregulation of PrP is at the transcriptional level, we quantified the amount of PRNP mRNA at different time points post TNFα treatment by quantitative real time PCR; there is no increase in the levels of PRNP mRNA after TNFα treatment (Fig. 1F).
-
TNFα initiates signal transduction via multiple signaling intermediates, such as NF-кB, JNK, ERK or p38 MAPK (Baud and Karin 2001). We thus used specific inhibitors targeting one of these pathways to identify which signaling pathway is involved in the up-regulation of PrP after TNFα treatment. Only the inhibitor of NF-кB signaling (QNZ) is able to mitigate the up-regulation of PrP after TNFα treatment (Fig. 2A). Thus, elevated PrP expression is likely due to NF-кB activation and signaling. To prove that TNFα activates NF-кB signaling, we quantified TNFα mRNA by RT-qPCR at 4, 6, and 12 h post TNFα treatment, as expected NF-кB signaling is indeed stimulated (Fig. 2B). These results suggest that up-regulation of PrP by TNFα is NF-кB dependent.
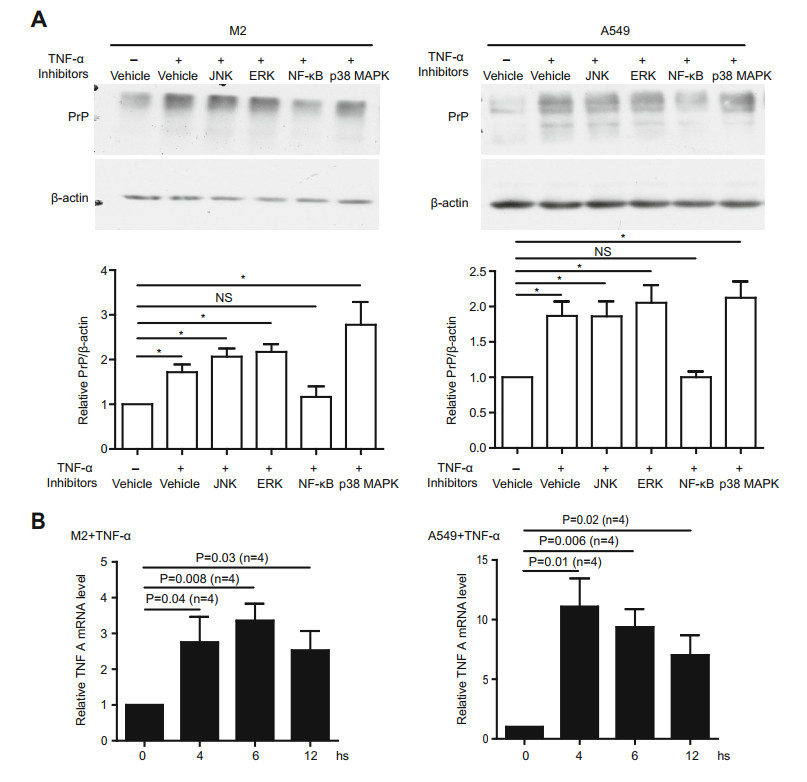
Figure 2. TNFα activated PrP up-regulation is NF-кB dependent. A TNFα elevated PrP expression depended on NF-кB signaling. Expression of PrP in M2 and A549 cells under treatment with sp600125, QNZ, U0126 or SB203580 was detected with 4H2. Only inhibitor specific for NF-кB signaling (QNZ) significantly mitigated PrP expression induced by TNFα treatment. *P < 0.05; NS: no significant difference. PrP and actin protein levels were quantified using pixels measured by ImageJ. B Long periods TNFα treatment stimulated NF-кB signaling. mRNA from M2, and A549 cells were quantified by RT-qPCR as described in the materials and methods. Activation of NF-кB signaling was assessed by the expression of TNFA mRNA at different time points post treatment. Significant differences were detected after the cells were treated with TNFα. Specific primers to quantify mRNA of TNFA were listed in Supplementary Table S3. Error bars represented SEM of indicated experiments. Other than indicated, all experiments were independently repeated at least three times with similar results.
-
Since TNFα treatment does not enhance the transcription of PRNP (Fig. 1F), we then investigate whether enhanced PrP expression is due to a decrease in PrP degradation. We treated cells with vehicle, MG132, 3-MA, or chloroquine (CQ) to inhibit the proteasome-dependent degradation, the formation of autophagosomes or lysosomes dependent degradation, respectively. Only 3-MA or CQ significantly enhances the PrP level (Fig. 3A). Blocking proteasome with MG132 does not alter PrP expression. Thus, PrP level may be regulated by autophagy. In addition, PrP levels are also significantly reduced when the cells are treated with cycloheximide (CHX), which is an inhibitor of block protein translation. However, comparing to CHX only, blocking lysosome degradation and protein translation at the same time greatly enhanced PrP level (Fig. 3B), suggesting PrP indeed undergo lysosome degradation. These results support that PrP level is regulated by NF-кB via autophagy.
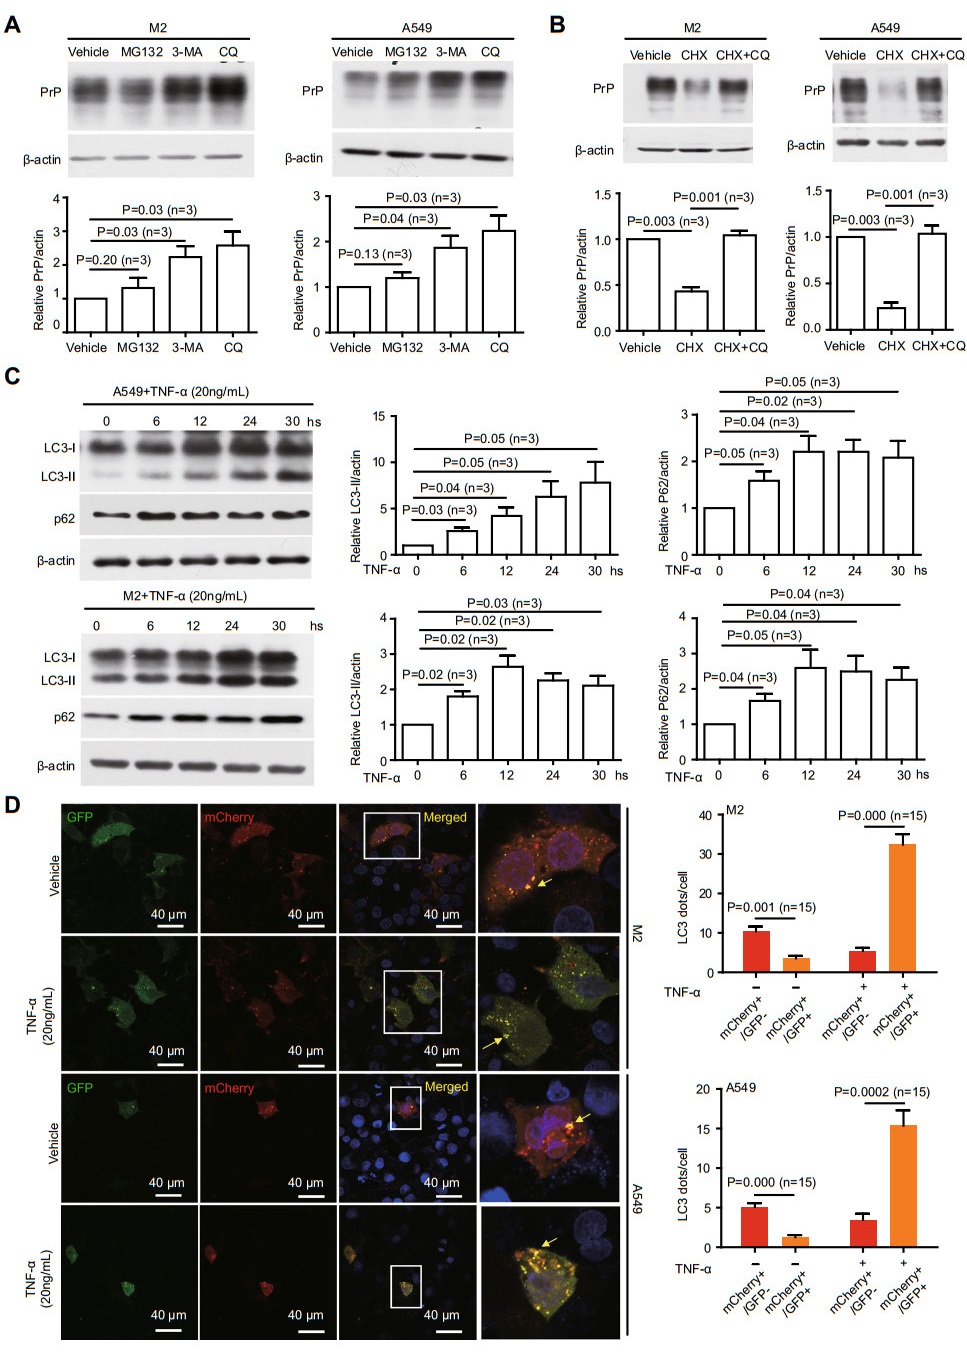
Figure 3. TNFα treatment reduces autolysosome formation. A PrP level was▶regulated by autophagy. M2 or A549 cells were treated with MG132, 3-MA, or CQ. 3-MA and CQ significantly increased PrP expression. B Blocking PrP translation reduced PrP level which could be reversed by CQ. C TNFα treatment enhanced p62 and LC3-Ⅱ. Cell lysates from TNFα treated M2, and A549 were immunoblotted with antibodies against p62 and LC3. Significant up-regulation of p62 and LC3-Ⅱ was observed at 6 h posttreatment. D Confocal Immunofluorescence staining showed that TNFα treatment significantly increased co-localization ofGFP-LC3 andmCherryLC3 in mCherry-GFP-LC3 transfected cells. On the contrary, fewer colocalization of GFP-LC3 and mCherry-LC3 was detected in the absence of TNFα treatment. The yellow fluorescence staining dots indicated autophagosomes not fused with lysosomes. Those cells in rectangle were enlarged to show more details of the LC3 dots. For analyzing autophagosomes and autolysosomes, LC3 dots per cell were counted manually. The graph showed the quantification of yellow LC3 dots and red LC3 dots from 15 cells in three independent experiments. P value was indicated. Error bars represented SEM of three experiments. Other than indicated, all experiments were independently repeated at least three times with similar results.
Next, we sought to analyze whether TNFα treatment indeed alters autophagy. We blotted M2 and A549 cell lysates with antibody specific for either LC3 or p62, two of the best-established markers for autophagy flux (Kabeya et al. 2000; Klionsky et al. 2012). Lipidation of LC3-I generating lapidated LC3-Ⅱ allows the docking of specific cargos and adaptor proteins such as p62 completing the formation of autophagosome (Kabeya et al. 2000). We detected enhanced levels of LC3-Ⅱ starting at 6 h post TNFα stimulation (Fig. 3C), implicating that autophagosome formation is activated by TNFα treatment. Additionally, we also observe enhanced level of p62 (Fig. 3C), indicating that autophagosome fusion with lysosome is inhibited.
To further investigate if autolysosome formation is diminished under TNFα treatment, we use a well-established protocol of transfecting a mCherry-GFP-LC3 plasmid into M2 and A549 cells and quantify the numbers of puncta of the GFP and mCherry LC3 signals (Ding et al. 2014). GFP is attenuated in the acidic conditions by lysosomes-dependent degradation whereas the mCherry is not. Therefore, red fluorescence indicates that the fusion between autophagosome and lysosome has occurred. On the contrary, yellow fluorescence indicates that autophagosome does not fuse with lysosome. We observed more yellow dots, which represent GFP-positive and mCherry-positive autophagosomes in cells treated with TNFα. Thus, the fusion between autophagosome and lysosome is indeed reduced when cells are treated with TNFα (Fig. 3D, arrows indicating co-localization between GFP and mCherry). To further prove that TNFα reduces fusion between autophagosome and lysosome, the cells were further treated with Bafilomycin A1 (BafA1), which prevents the maturation of autophagic vacuoles by inhibiting late stage fusion between autophagosomes and lysosomes (Pasquier 2016). We added BafA1 into the cell culture medium for an additional 2 h where A549 cells previously been treated with TNFα. BafA1 treatment indeed totally blocked the fusion between autophagosome and lysosome comparing to A549 cells treated only with TNFα (Supplementary Fig. S2). Hence, TNFα treatment does not disrupt the generation of autophagosome but significantly, although not completely blocked the fusion between autophagosome and lysosome.
-
The fusion of autophagosomes and lysosomes is pivotal in autophagy flux. LAMP1, LAMP2 and SNAP29 have been reported to be critical in autolysosome formation (Morelli et al. 2014). Thus, we investigated whether TNFα treatment decreased the expression of these proteins. We found that only SNAP29 but neither LAMP1 nor LAMP2 showed a significant decreased at 6 h post TNFα treatment in both cell lines (Fig. 4A). Next, we investigated whether the reduction in SNAP29 after TNFα treatment is at the transcription level by RT-qPCR. Indeed, the level of SNAP29 mRNA is significantly reduced in both cell lines after TNFα treatment (Fig. 4B). Therefore, TNFα treatment impacts transcriptional factor(s) for SNAP29 to repress its transactivation.
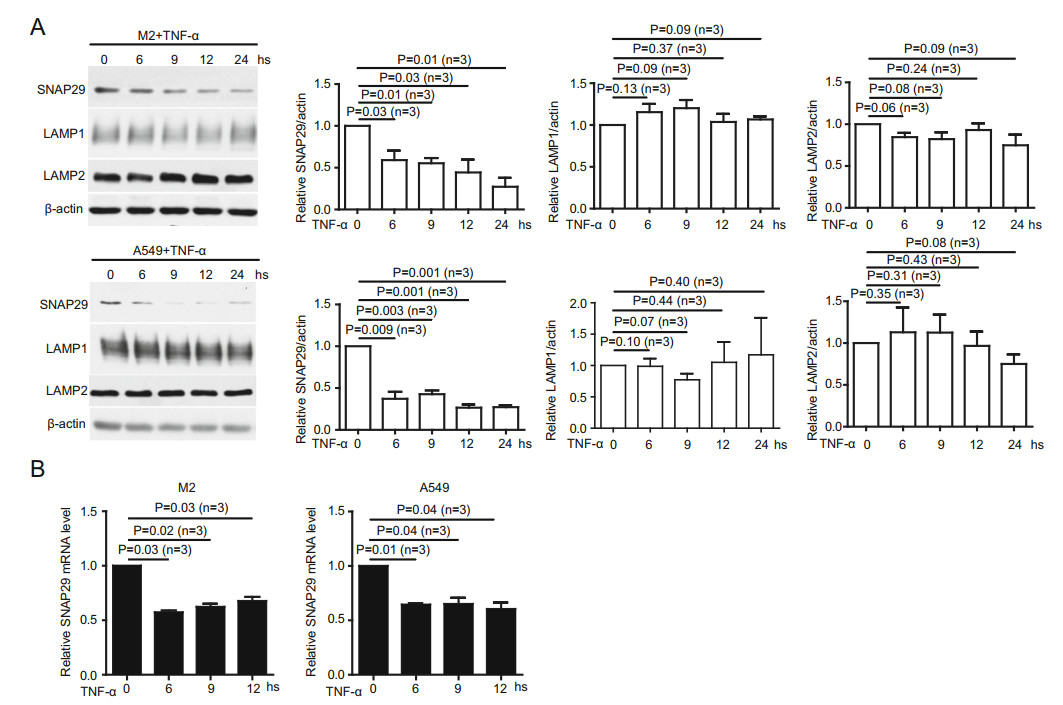
Figure 4. TNFα treatment reduces autolysosome formation by decreasing SNAP29 expression. A Immunoblotting of cell lysates from M2, and A549 cells treated with TNFα for different periods of time showed that SNAP29 but neither LAMP1 nor LAMP2 protein was significantly mitigated at 6 h post-treatment. SNAP29, LAMP1, LAMP2, and actin protein levels were quantified using pixels measured by ImageJ. B RT-qPCR with specific primers against SNAP29 showed TNFα treatment significantly reduced mRNA levels of SNAP29 in M2 and A549 cells. P values were indicated. Error bars represented SEM of three experiments. Other than indicated, all experiments were repeated at least three times.
-
Based on these observations, we posit that cancer cells without SNAP29 have reduced autolysosome formation to accumulate PrP, which then promotes cell mobility. To test this hypothesis, we knocked out SNAP29 in M2 cells by CRISPR/Cas9 and down-regulated SNAP29 in A549 cells by shRNAi (Fig. 5A). As expected, the protein levels of LC3-Ⅱ, p62 and PrP were increased in SNAP29 downregulated and SNAP29 null cells compared to control cells (Fig. 5A), indicating that fusion between autophagosome and lysosome is reduced in the absence of SNAP29. Interestingly, all these occurred in the absence of TNFα treatment. When comparing cells with or without SNAP29 expression, we observed that there were significantly more yellow dots in cells without SNAP29 expression, implying that silencing SNAP29 is sufficient to inhibit autolysosome formation without TNFα treatment (Fig. 5B). Accordingly, an increase in cell motility in cells without SNAP29 expression is also observed (Fig. 5C).
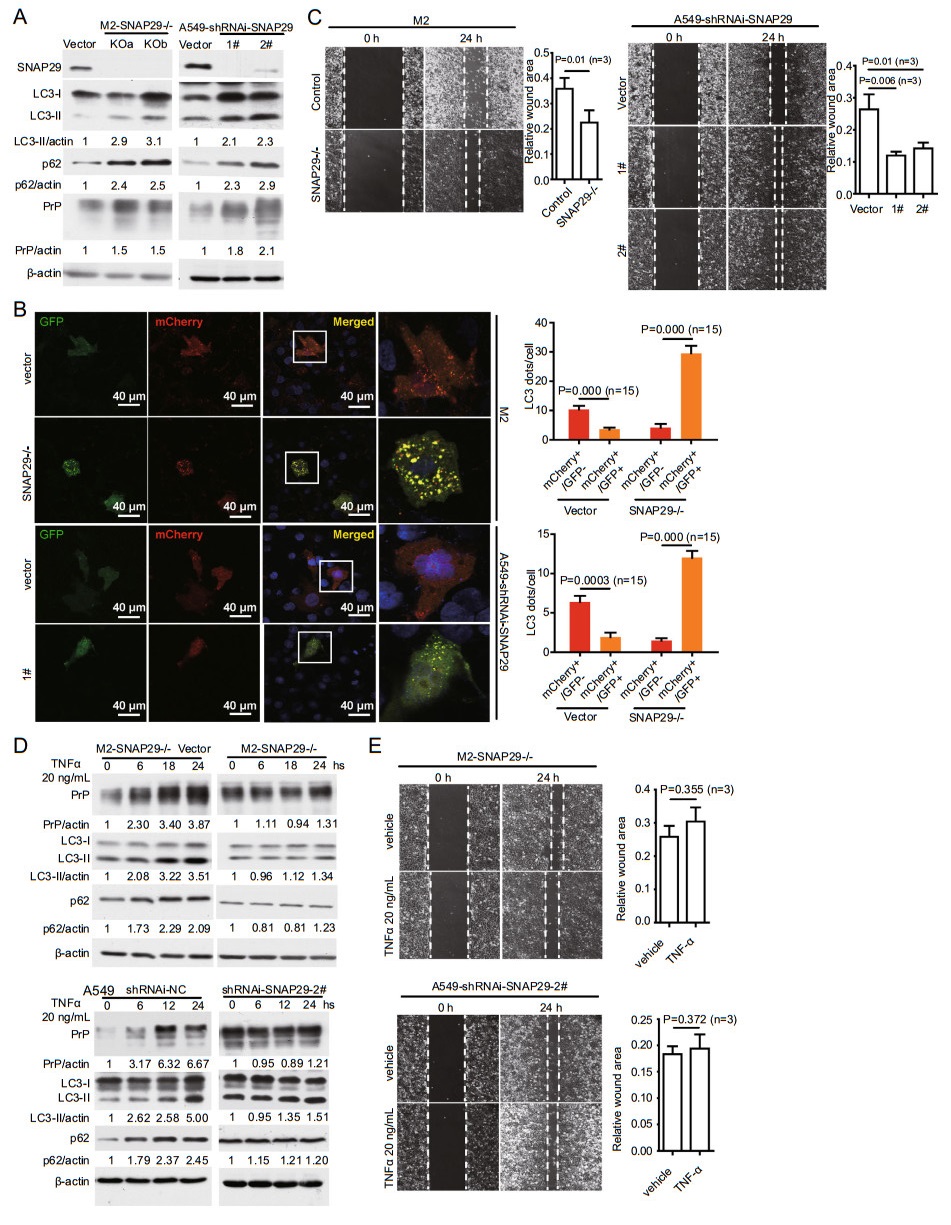
Figure 5. KO SNAP29 reduces autolysosome formation and enhances cancer cell migration independent of TNFα treatment. A SNAP29 in M2 or A549 cells were knocked out by CRISPR/Cas9 or knocked down by shRNAi targeting to different sites. Immunoblotting with antibody specific to SNAP29 confirmed the silencing of SNAP29. As a consequence, enhanced levels of LC3-Ⅱ, p62, and PrP were detected. SNAP29, LC3-Ⅱ, p62, PrP, and actin protein levels were quantified using pixels measured by ImageJ. B Silencing SNAP29 reduced autolysosome formation. Confocal immunofluorescence staining showed that in the absence of SNAP29 there was a significantly more co-localization of GFP-LC3 and mCherry-LC3. Those cells in rectangle were enlarged to show more details of the LC3 dots. The graph shows the quantification of yellow LC3 dots and red LC3 dots from 15 cells in three independent experiments. P values were indicated. C Silencing SNAP29 enhanced cancer cell migration by a wound healing assay. Significant more wound healing was observed in A549 and M2 cells lacking SNAP29 expression at 24 h post wounding. P values were indicated, objective magnification 109. D TNFα treatment of SNAP29 silenced M2 or A549 cells no longer enhanced the levels of LC3-Ⅱ, p62, PrP. Cell lysates were harvested and analyzed by immunoblotting (right panels). In contrast, elevated levels of LC3-Ⅱ, p62, and PrP were detected in SNAP29 expressing cells treated with TNFα (left panels). E TNFα treatment of SNAP29 silenced M2 and A549 cells did not increase cancer cell motility. Cell mobility was assayed at 24 h post vehicle or TNFα treatment. No significant enhancement of cell movement was detected when SNAP29 silenced M2 and A549 cells were treated with TNFα. Objective magnification 109. Error bars represented SEM of three experiments. Other than indicated, all the experiments were repeated at least three times. SNAP29-/-: SNAP29 null cells (KO a & KO b are two different sites targeted for knockout); 1# &2#: A549 cells targeted by two different shRNAi-SNAP29 sequences listed in Supplementary Table S2; Vector: empty vector control transfected A549 cells or M2 cells.
We then investigated whether SNAP29 silenced cells can still respond to TNFα. SNAP29 null cells were treated with or without TNFα and the levels of LC3-Ⅱ, p62, and PrP were detected. We found that in the absence of SNAP29 these molecules were not increased even when the cells were treated with TNFα (Fig. 5D, 5E). Accordingly, when the SNAP29 silenced cells were treated with TNFα, they did not show enhanced mobility (Fig. 5E). Therefore, simply silencing SNAP29 is sufficient to up-regulate the expression of LC3-Ⅱ, p62 and PrP, as well as promoting cell migration. The fact that the SNAP29-/- cells do not respond to TNFα stimulation suggests that the primary target of TNFα is SNAP29.
-
Decrease of SNAP29 mRNA level after TNFα treatment (Fig. 4B) suggests that the transcription factor(s) responsible for SNAP29 activation may have been down-regulated. Several transcriptional factors have been implicated in activating SNAP29 (Saito et al. 2001). We also tried to identify transcriptional factors for SNAP29 using the USCS database (https://genome.ucsc.edu/index.html). We found that in M2 and A549 cells FOXP3 mRNAs and protein levels were decreased after TNFα treatment for 4 h (Fig. 6A). These results suggest that FOXP3 expression is regulated by TNFα treatment via NF-кB signaling. To verify this possibility, we further treated M2 and A549 cells with TNFα plus QNZ. We found that FOXP3 transcription was no longer mitigated (Fig. 6B, right panels) when NF-кB activation was blocked (Fig. 6B, left panels). Therefore, TNFα treatment indeed reduces FOXP3 expression via activating NF-кB, which in turn regulates SNAP29 expression. If true, SNAP29 expression at mRNA and protein levels should be reduced without TNFα treatment once FOXP3 was silenced. To test this hypothesis, we silenced FOXP3 with shRNAi and detected the effect on SNAP29 expression. Silencing FOXP3 in fact significantly reduces SNAP29 mRNA and protein levels (Fig. 6C, Supplementary Fig. S3). Thus, FOXP3 is transactivating SNAP29 in this scenario. FOXP3 is a lineage-specific transcription factor with [(A/G)(T/C)AAACA] being its core binding motif (Sadlon et al. 2010). To further confirm that FOXP3 could activate SNAP29 transcription, the dualluciferase reporter assay was performed by co-transfecting an exogenous FOXP3 plasmid and a SNAP29 promoter in M2 cells (Fig. 6D). The overexpression of FOXP3 increases the 1–2000 (- 2000 bp upstream of the first exon, - 2000 to 0), 1–1000 (- 1000 to 0), 1–500 (- 500 to 0) SNAP29 promoter activity significantly over that of the empty vector control group (Vector) (Fig. 6D). As expected, deleting 1–500 (- 2000 to - 501), and 161–168 (D161–168) of the FOXP3-binding site in the SNAP29 promoter abrogates the activity (Fig. 6D). These results support our interpretation that FOXP3 is indeed a transcriptional factor for SNAP29, and the predicted TGCTGAC motif (D161–168) is the binding site for FOXP3 (https://jaspar.genereg.net/) (Fig. 6D).
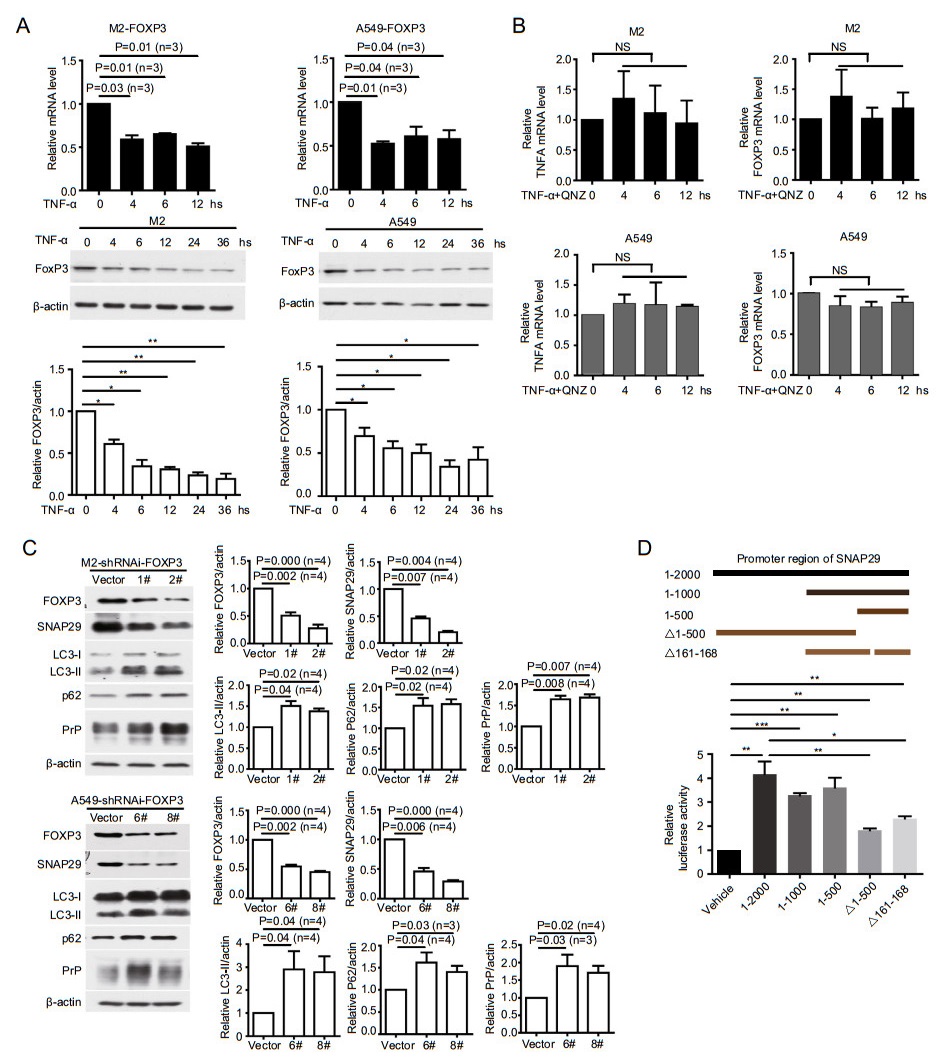
Figure 6. TNFα treatment reduces FOXP3 to dampen SNAP29 expression. A TNFα treatment dampened the expression of FOXP3. M2 and A549 cells were treated with TNFα for different periods of time as indicated; FOXP3 mRNA levels were quantified by RT-qPCR. In some situations, p values were indicated or *P < 0.05; **P < 0.01, (n = 3). B Cancer cells blocking NF-кB activation no longer had decreased FOXP3 mRNA levels. Relative TNFA expression was quantified from the same treatment indicating that NF-кB activation was blocked by the inhibitor. NS: not statistically significant. C Silencing FOXP3 significantly reduced SNAP29 but enhanced LC3-Ⅱ, p62 and PrP. Cell lysates were harvested and analyzed by immunoblotting. D FOXP3 bound the promoter region of SNAP29. FOXP3 was expressed in M2 cells transfected with plasmids containing different regions of SNAP29 promoter (top panels indicating the plasmids used in the luciferase assays). The TGCTGAC motif of SNAP29 promoter was one of the motifs required for luciferase activity. *P < 0.05; **P < 0.01, ***P < 0.001, (n = 4). Indicated protein levels were quantified using pixels measured by ImageJ. P values were indicated, Error bar represented SEM of indicated experiments. Other than indicated, all the experiments were repeated at least three times.
-
If TNFα induced down-regulation of SNAP29 is mainly mediated by FOXP3, we expect that FOXP3-silenced cancer cells should not have diminished SNAP29 at mRNA level when treated with TNFα. In line with our hypothesis, we detected a reduction of SNAP29 mRNA in control cells but not in FOXP3-silenced cells (Fig. 7A). Accordingly, the protein levels of SNAP29, LC3-Ⅱ, p62 and PrP remained unchanged in FOXP3-silenced cells after TNFα treatment (Fig. 7B). On the contrary, TNFα stimulated elevation of LC3-Ⅱ, p62 and PrP in the presence of FOXP3 (Fig. 7B). Most importantly, silencing FOXP3 abolishes the effect of TNFα-induced cancer cell migration (Fig. 7C, 7D). Collectively, these results support the conclusion that FOXP3 is the major transcriptional factor for SNAP29. When treated with TNFα, cancer cells down-regulate FOXP3 to repress activation of SNAP29, which in turn reduces autolysosome formation, resulting in accumulating of PrP as well as promoting cell migration (Fig. 8).
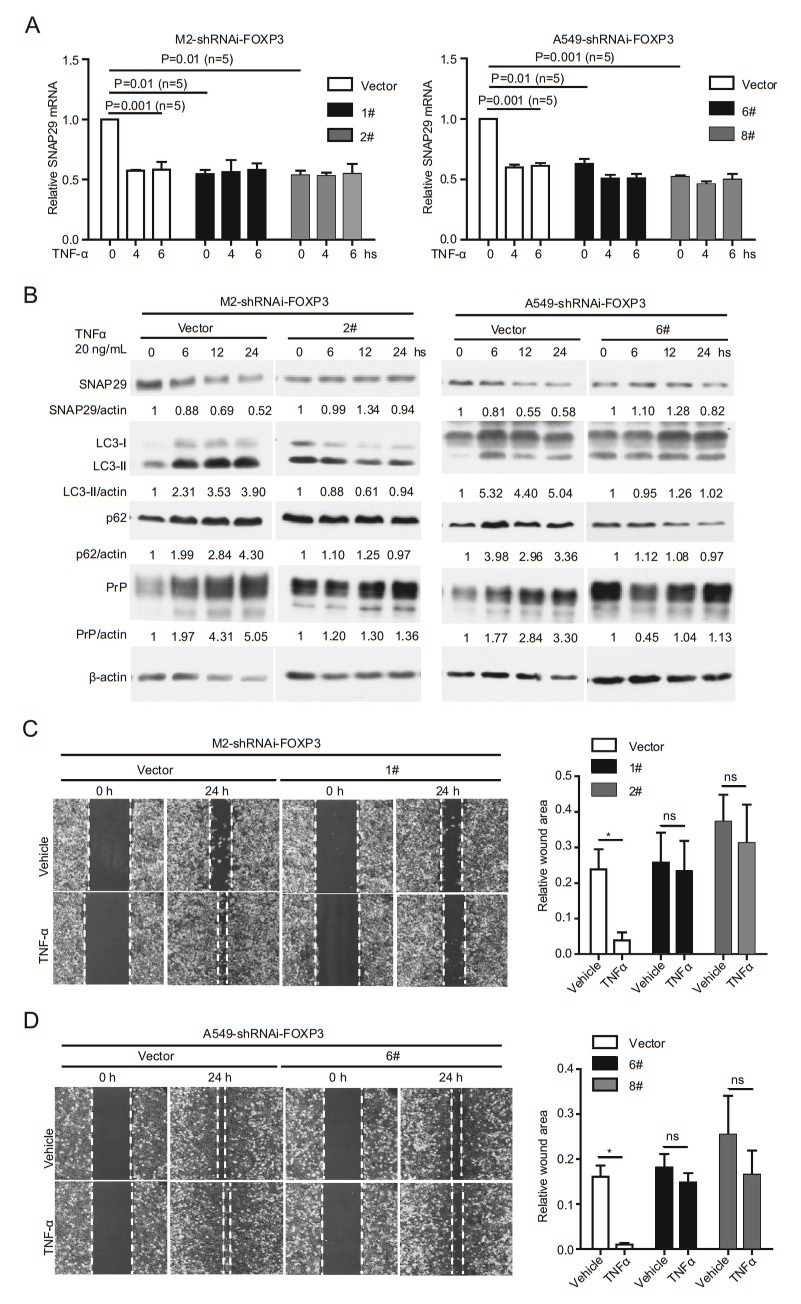
Figure 7. Cancer cells do not respond to TNFα treatment in the absence of FOXP3. A TNFα treatment did not induce SNAP29 down regulation at the mRNA level in FOXP3 silenced cells. In contrast, TNFα treatment of FOXP3 expressing cells reduced SNAP29 mRNA to a level comparable to the SNAP29 level. P values were indicated, (n = 5). B TNFα treatment neither downregulated SNAP29 nor upregulated PrP, p62 and LC3-Ⅱ at the protein level in cells lacking FOXP3 (2# and 6#). On the contrary, in cells expressing FOXP3, down-regulation of SNAP29, and up-regulation of p62, LC3-Ⅱ, and PrP were detected when cells were treated with TNFα (vector). C and D TNFα treatment did not enhance cell mobility when FOXP3 was silenced. Cell mobility was assayed at 24 h post vehicle or TNFα treatment. No significant enhancement of cell movement was detected when FOXP3 silenced M2 (C) and A549 (D) cells were treated with TNFα. Objective magnification 109. Indicated protein levels were quantified using pixels measured by ImageJ. P values were indicated, Error bar represented SEM of indicated experiments. Other than indicated, all the experiments were repeated at least three times. Vector: empty vector control transfected A549 cells or M2 cells. 1# & 2# were different shRNAi targets for FOXP3 in M2 cells. 6# & 8# were different shRNAi targets for FOXP3 in A549 cells.
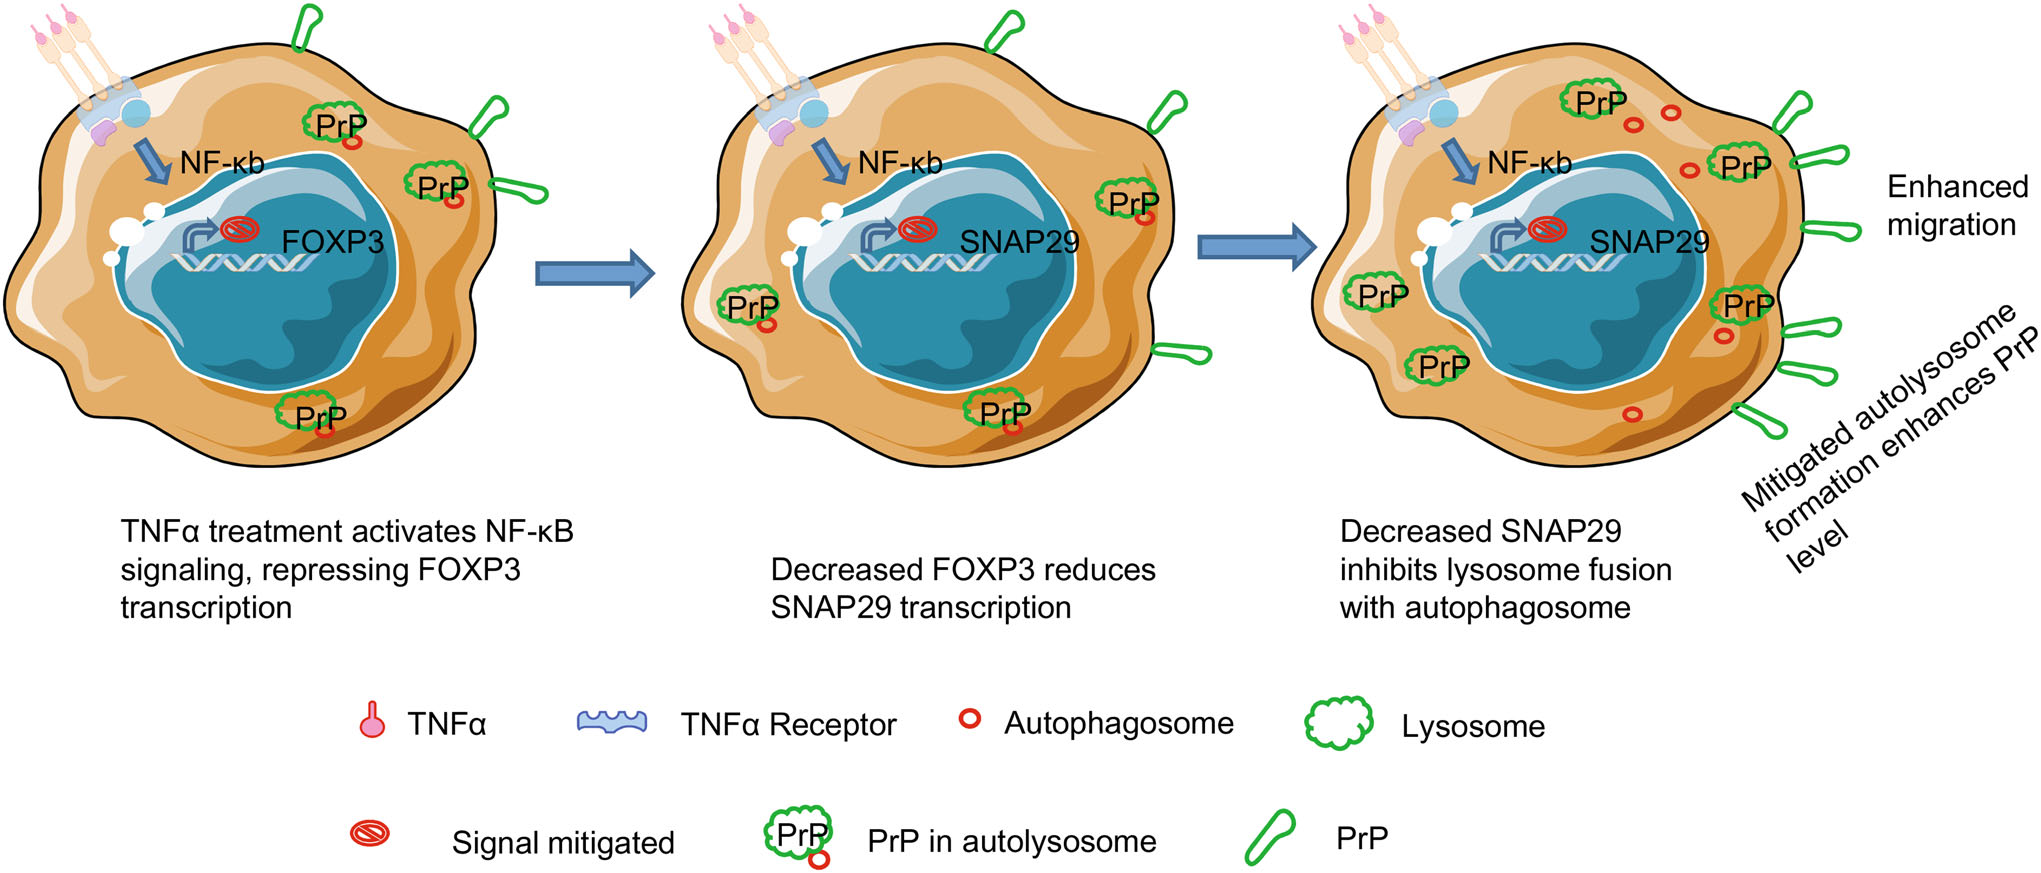
Figure 8. Proposed model to show how TNFα treatment induces cancer cell migration via reducing autolysosome formation. TNFα treatment stimulates NF-кB signaling, which transcriptionally represses the expression of FOXP3. As a consequence, reduced FOXP3 transactivates less SNAP29, leading to inhibited fusion between autophagosome and lysosome. Since PrP is degraded in autolysosome, decreased autolysosome results in higher PrP level, which in turn facilitates cancer cell migration.
TNFα Stimulates Tumor Cell Migration in a PrP Dependent Manner
Up-Regulation of PrP by TNFα Is NF-кB Dependent
TNFα Decreases Autophagy by Reducing Autolysosome Formation
TNFα Reduces Autolysosome Formation by Decreasing SNAP29 Expression
Silencing SNAP29 Reduces Autolysosome Formation, Enhances PrP Expression and Increases Cancer Cell Migration Independent of TNFα Treatment
TNFα Reduces Transcriptional Factor FOXP3 Expression to Dampen SNAP29 Expression
TNFα Treatment Does Not Mitigate Autophagy and Migration in FOXP3-Silenced Cancer Cells
-
Here, we report that TNFα stimulates M2 melanoma cells and A549 lung cancer cells migration via a novel TNFαNF-кB-FOXP3-SNAP29 axis. This conclusion is based on the following observations: (1) TNFα enhances cancer cell migration in a PrP and NF-кB dependent manner (Figs. 1, 2); (2) TNFα up-regulates PrP expression by mitigating autophagy to reduce the turn-over of PrP (Fig. 3); (3) TNFα reduces autophagy by down-regulating SNAP29 (Fig. 4); (4) silencing SNAP29 decreases autolysosome formation, enhances PrP expression and cancer cell migration in the absence of TNFα treatment (Fig. 5); (5) TNFα treatment reduces SNAP29 expression by dampening FOXP3, a transcription factor for SNAP29 (Fig. 6); (6) TNFα neither affects SNAP29 and PrP expression nor enhances cancer cell migration in the absence of FOXP3 (Fig. 7). While it is clear that TNFα stimulated cell migration can be blocked by reducing the amount of SNAP29, we cannot exclude the probability that additional pathways that are involved significantly.
TNFα treatment up-regulates the expression of PrP as well as promoting the migration of two different human tumor cell lines; enhanced migration is PrP dependent. Upregulation of PrP is not due to an increase in transcription of PRNP (Fig. 1F) and requires the activation of NF-кB (Fig. 2A). The enhancement of PrP expression is mediated by events occur post-translationally. Further biochemical analysis reveals that the enhancement is due to a reduction in autophagy, which is consistent with previous reports that PrP is degraded in autolysosome or lysosome (Aguib et al. 2009; Nakagaki et al. 2013; Pataer et al. 2020). However, it should be noted that PrP have also been reported to cycle between the cell surface and early endosome (Aguib et al. 2009). Others have also reported that some PrP are degraded via an endoplasmic reticulum associated degradation (ERAD)-proteasome dependent pathway (Aguib et al. 2009; Nakagaki et al. 2013). Hence, it is likely that PrP turn-over is cell-context dependent. Previously we have reported that PrP has a half-life of about 5 h in M2 cells (Li et al. 2010). Experiments are now in progress to determine whether the half-life of PrP is indeed prolonged after TNFα treatment.
The role autophagy plays in modifying TNFα induced PrP up-regulation is further supported by additional biochemical analysis. Two of the markers of autophagy LC3-Ⅱ and p62 are significantly increased in both tumor cell lines upon TNFα treatment (Fig. 3C). Confocal imaging analysis of the numbers of LC3 puncta in cells treated or not treated with TNFα also supports this conclusion (Fig. 3D). Therefore, treatment with TNFα does not mitigate the formation of autophagosome. However, after TNFα treatment the level of SNAP29 is significantly reduces at protein as well as at mRNA level (Fig. 4). These results suggest that the dominant effect of TNFα on autophagy is at the autophagosome and lysosome fusion process.
The strongest evidence supporting the role SNAP29 plays in this process derived from silencing SNAP29 in these two cell lines. Silencing SNAP29 in both cell lines increases the levels of LC3-Ⅱ and p62 as well as PrP (Fig. 5A). As expected, silencing SNAP29 also enhances the migration of the two tumor cell lines in wound healing assays (Fig. 5C). The effects of TNFα on autophagy is expected to have a global effect impacting the turn-over of some other proteins in addition to PrP. It will be interesting to identify the turn-over of other proteins which are modulated after TNFα treatment. Some of these proteins may play an important role in tumor progression.
NF-кB has many client genes (Lachmann et al. 2010). Of the transcription factors that we investigated, only FOXP3 faithfully recapitulates the expected phenotypes; when FOXP3 is silenced, it blocks TNFα induced reduction of SNAP29 and enhancement of LC3-Ⅱ, p62 and PrP (Fig. 7). Most importantly, silencing FOXP3 abrogates the effects of TNFα-induced cancer cell migration (Fig. 7). Furthermore, there is a reduction of SNAP29 mRNA in control but not in FOXP3-silenced cells (Fig. 6). Our conclusion that FOXP3 is a transcription factor for SNAP29 is further confirmed in a promoter reporter assay carried out in M2 cells (Fig. 6D). However, there might be additional motif(s) on SNAP29 promoter regions that could be recognized by FOXP3 based on the luciferase assays (Fig. 6D).
To our knowledge the finding that FOXP3 is a bona fide transcription factor for SNAP29 has not been reported before. Much works on FOXP3 have been focused on the role it plays in the biology of Treg. Higher levels of FOXP3 predict a favorable outcome for patients with endometrical cancer whereas overexpression of PrP implicates a poorer prognosis for patients with endometrical cancer (human protein atlas). This is consistent with the observation that a reduction of FOXP3 may up-regulate PrP in cancer cells treated with TNFα. While we have provided strong evidence that treatment with TNFα down-regulates the expression of FOXP3 in two different cancer cell lines. The underlying mechanisms have not been addressed. Previous reports showed that TNFα decreased FOXP3 mRNA and protein levels through transformation growth factor (TGF)- Smad or Jak-Stat signaling pathway (Valencia et al. 2006; Zorn et al. 2006; Zhang et al. 2013; Goldstein et al. 2016). It is possible that in these two cell lines TGF is also involved in this axis.
We reported earlier that binding of pro-PrP to filamin A (FLNa) disrupts the normal physiologic function of FLNa and renders the tumor cells more aggressive and invasive (Li et al. 2009). Since M2 cells lack FLNa, the underlying mechanism by which the enhanced expression of PrP promotes M2 cells migration remains to be investigated. Recently, Ke et al., showed that PrP could mediate M2 cell migration via Akt-hsp27-F-actin axis (Ke et al. 2020). Thus, it is possible that the increased PrP expression may enhance tumor cell migration via this pathway. Another possibility is that M2 cell although lacking FLNa expresses tubulin, which has been reported to bind PrP (Nieznanski et al. 2005). Interaction between PrP and one of the cytoskeletal proteins that is important in cell migration may facilitate M2 cell migration. On the other hand, FLNa expressing A549 cells (Human Protein Atlas) are phenocopies of M2 cells when treated with TNFα (Fig. 1A, 1B). Therefore, to elucidate the underlying mechanism by which TNFα modulates cellular migration in various cell types will require additional biochemical analysis. In summary, we have established a causal relationship between TNFα signaling, autophagy and cancer cell migration. Interrupting this axis may provide a mean to control tumor cell metastasis.
-
This work was supported by grants from the National Science Foundation of China (31670170 & 81560442), from MOST (2018YFA0507201), from the Natural Science Foundation of Guangdong Province (2017ZC0236). We thank the Core Facility and Technical Support of Wuhan Institute of Virology for excellent assistance in Confocal Microscopy (Dr. Ding Gao) and Flow Cytometry (Ms. Juan Min).
-
HL and CL designed the experiments; HL performed the experiments; HL, RW, ZY, J Z, SC, RS, SG, MS, ZG, JX, MSSy, and CL analyzed the data; HL and CL wrote the paper; CL and MSSy edited the manuscript.
-
The authors declare that they have no conflicts of interest with the contents of this article.
-
This article does not contain any studies with human or animal subjects performed by any of the authors.

 DownLoad: