-
According to the report of the Joint United Nations Programme on HIV/AIDS at the end of 2006, almost 40 million people are living with human immunodefi-ciency viruse (HIV) or acquired immunodeficiency syndrome (AIDS) worldwide, and nearly 11 000 new infections occur every day. Although the use of highly active antiretroviral therapy (HAART) has signifi-cantly improved life expectancy and quality for people living with HIV and AIDS by controlling viral replication (16), there are many drawbacks, including side effects, viral resistance and the very high cost of the treatment that restricts its utility especially in developing countries. Thus, in order to control the spread of HIV effectively, the development of inexpensive, safe and efficacious vaccines is be-coming a very urgent matter. An ideal vaccine should protect against HIV infection, which depends on effective and specific humoral and cellular responses induced by the vaccine.
The envelope (Env) glycoprotein located on the surface of the HIV is the major target of the humoral immune response. However, the Envs of wild-type HIV isolates are not very immunogenic and do not effectively induce broad neutralizing antibodies (NAbs), which represent the major weapon of prophylactic vaccines. There are several reasons for this pheno-menon. Firstly, the conserved receptor and coreceptor binding sites of Env are covered by complex glycoside chains and variable loops (21). Secondly, the steric restrictions caused by the complicated conformations of Env disable the antigen presentation of the conserved epitopes and their recognition by B cells (20). Since reverse transcriptase has no proof-reading function, innumerable mutant viruses are generated under selection by immune pressure in order to elude the humoral and cellular immunity systems (11, 24).
Despite all these defense mechanisms, some broadly reactive monoclonal antibodies (mAbs), such as b12, 2G12, 4E10 and 2F5, can neutralize primary isolates from different genetic subtypes (4). In addition, some serum samples collected from non-progressive individuals have broadly neutralizing activities (6, 12). Thus, HIV-1 Env has the potential of inducing NAb production. However, its complex structure leads to weak NAb induction against its natural structure. Also, induced NAbs are not sufficiently strong and effective to prevent HIV infection. In order to improve the immunogenicity, especially the ability to induce NAbs, the natural structure of HIV-1 Env needs to be modified.
In the present study, 11 Env mutants were designed and generated by site-directed mutagenesis of the epitopes of NAbs or regions around these epitopes and deletions of variable regions in HIV-1 Env. The immunogenicities of the mutants in Balb/c mice were evaluated using single-cycle infection neutralization assays and gamma interferon Enzyme Linked Im-munospot (IFN-γ ELISPOT).
HTML
-
An SHIV chn19 peptides-complete set (Cat# 4974) spanning the gp160 gene of HIV (kindly provided by Dr. Jianqing Xu, National Center for AIDS/STD Control and Prevention, Chinese CDC) was used as stimulus. In total, there are 86 peptides of 20 amino acids each that overlapped by 10 amino acids. The identity between Wt Env used in present study and the peptide pool was 86.4% at amino acid level. Four peptide pools were formulated, including Env1 (first 22 peptides), Env2 (second 22 peptides), Env3 (third 22 peptides) and Env4 (last 20 peptides). The final concentration for each peptide used in ELISPOT assays was 4 μg/mL.
-
Two pseudoviruses generated with an env-deficient HIV-1 backbone vector (pSG3ΔEnv) and rev/env expression plasmids were employed. The rev/env gene in expression plasmid for pseudovirus Wt was cloned from the D-GPEi plasmid expressing codon-optimized gag-pol and env genes of CRF08-B/C strain, which was isolated from Guangxi, China, while that for pseudovirus 74-2 was isolated from Xingjiang, China, and belonged to strain CRF07-B/C. The amino acids identity of the two isolates was 87.8%.
-
The D-GPEi plasmid (kindly provided by Dr. Wei Kong of College of Life Science, Jilin University) expressing codon-optimized gag-pol and env genes of CRF08-B/C strain was used as the parent plasmid for further modification, and designated as plasmid Wt. The alanine mutations, deglycosylations and V1V2 deletion were generated by in vitro mutagenesis using double-stranded DNA templates and selection of mutants with Dpn I as described previously (15, 27). For each mutation, the two primers contained the desired mutation and occupied the same starting and ending positions on opposite strands of the plasmid DNA (Table 1). The alanine mutations were accomplished by directly changing the sequence coding for X to coden for A. The glycosylation sites (NX(T/S)) were deleted by changing the sequence coding for N to that for Q. The primers designed for V1V2 deletion were composed of the upper and lower sequences adjacent to the expected deletion. DNA synthesis was carried out by PCR in a 50 µL reaction volume using 1 µL of denatured plasmid template (0.1 ng/µL), 50 pmol of upper and lower primers and 5 U of high-fidelity thermostable polymerase PrimeStar (Takara, Dalian, China). PCR amplification was carried out for one cycle of denaturation at 98℃ for 5 min, then 18 cycles of 98℃ for 15 s and 68℃for 15 min, followed a final extension at 72℃ for 10 min.

Table 1. Primers for Env modifications
The amplicons were treated with the restriction enzyme Dpn I for 1 h at 37℃. Since Dpn I specifically cleaves fully GMe6ATC sequences, the bacterially generated DNA used as a template for amplification was digested, whereas the DNAs synthesized during the course of the in vitro reaction was Dpn I-resistant, which were rich in the desired mutants, were recovered by transforming Escherichia coli strain-DH5 to antibiotic resistance. The successful mutations were confirmed by restriction enzyme analysis and sequencing.
Plasmids containing the desired mutants were amplified in E. coli Germany) according to the manufacturer's instructions. The concentration of each plasmid was determined according to the optical density provided that the following require-ments were met: A260 > 0.1, A320≤0.01, 1.8 < A260/A280 < 2.0 and A260/A230 > 2.0. Each plasmid was adjusted to a final concentration of 0.5 mg /mL and stored at-20℃ until use.
-
293T cells were transfected with the plasmid Wt and modified plasmids, respectively, using Lipofec-tamine 2000 (Invitrogen, California, USA) according to the manufacturer's instructions. 48 h after trans-fection, the cells were collected in 500 μL of PBS, diluted by 1:2 in SDS loading buffer and boiled for 5 min. Aliquots (10 μL) of the diluted samples were separated on a 10% SDS-PAGE, and transferred onto a nitrocellulose membrane (Whatman, Brentford, UK). The membrane was incubated with a 1: 1 000 dilution of HIV-1 antibody-positive sera in PBS containing 0.05% Tween 20 and 5% nonfat milk for 1.5 h, extensively washed and incubated in a 1:1 000 dilution of alkaline phosphatase-conjugated goat anti-human IgG. After washing, a substrate was added to detect the antigen-antibody complexes.
-
Six-week-old BALB/c mice were housed and main-tained in accordance with relevant guidelines and regulations. All mice were anesthetized before vacci-nation by intraperitoneal injection of pentobarbital sodium. Subsequently, groups of 10 mice were in-jected intramuscularly in the quadriceps of each hind limb with each of the plasmid Wt and mutant plasmids on days 0, 14, 28 and 42. The injection dose contained 40 μg, with 20 μg given per leg. Immediately after the immunization, the injection sites were spanned by two needles at 0.5 cm and electroporated with six square wave pulses in 6 s (field strength: 72 V/cm) using a TERESA-EPT (TERESA, Shanghai, China). The mice were sacrificed at 2 weeks after the last immunization. Sera were freshly collected and stored at-20℃ for neutralization assays, while spleen cells were collected in a sterile manner for ELISPOT assays.
-
The numbers of IFN-γ-secreting T cells specific for env gene products in splenocytes from the immunized mice were determined using an IFN-γ ELISPOT kit (BD Bioscience, California, USA). Briefly, polyviny-lidene difluoride-backed 96-well plates were coated with a purified anti-mouse INF-γ mAb (μg/mL) at 100 μL per well, and incubated at 4℃ overnight. The wells were washed with 200 μL of PBS containing 0.05% Tween 20 and blocked for 2 h with RPMI1640 medium containing 10% FCS at room temperature. Mice splenocytes were isolated and red blood cells (RBCs) were lysed with RBC lysis buffer (Sigma-Aldrich, Missouri, USA). The cells were then washed twice with R10 complete culture medium (RPMI-1640 containing 10% FCS, 100U/mL penicillin and 100μg/mL streptomycin) and resuspended in R10. After counting, the splenocytes were adjusted to 8×10⁶ cells/mL. The peptide pools were added directly to the wells at 50 μL per well followed by the addition of cells (50 μL per well). The final concen-trations were 4 μg/mL for each peptide and 4×10⁵ cells per well for cells. For each mouse, two control wells with no peptides were set up by substituting 50 μL of R10 for the 50 μL of peptide pools. Next, the 96-well ELISPOT plates were incubated for 20 h at 37℃ under 5% CO2. After the incubation, the ELISPOT plates were treated according to the kit's instructions. Finally, IFN-γ spot-forming cells (SFCs) were counted using a BioReader 4000 Pro-X (Biosys, GmbH, Germany). The results were expressed as the number of SFC per 106 cells. The number of IFN-γ-secreting T cells was calculated by subtracting the background control value (no peptides) from the established SFC count. The SFCs from the four Env peptide pools were compiled together as the total ELISPOT result for each mouse. To evaluate the effects of the mutations on the Env-specific T-cell immune responses, the percentage increase was calculated using the following formula: [(SFCs for each mouse – mean SFCs for the Wt group) / mean SFCs for the Wt group] × 100.
-
Briefly, 100 TCID50 of pseudovirus was incubated with 10 μL of mouse sera in duplicate for 1 h at 37℃ in a total volume of 150 μL of growth medium in 96-well flat-bottom culture plates (BD Bioscience, California, USA). Freshly trypsinized cells (1×10⁴ cells in 100 μL of growth medium containing 37.5 μg/mL DEAE-dextran) were added to each well. Neutralization assays conducted with PBS-immuni-zing sera showed an important facilitation effect of the pseudovirus infection. A similar phenomenon has been described previously (14) and was independent of Env-specific antibody present in sera. To account for the relatively high background and variability frequently observed with mouse antisera, samples collected from control animals immunized with PBS served as controls for nonspecific neutralization (14). Therefore, one set of eight control wells received cells, sera from mice immunized with PBS and virus (virus control), while another set of two wells received cells only (background control). After a 48-h incubation, 150 μL of culture medium was removed from each well and 100 μL of Bright Glo reagent (Promega, Wisconsin, USA) was added instead. After a 2-min incubation at room temperature to allow cell lysis, 100 μL of each cell lysate was transferred to 96-well solid white plates for measurement of the luminescence using a GloMaxTM 96 Micro plate luminometer (Pro-mega, Wisconsin, USA). The results correspond to the mean of two experiments carried out in duplicate. The percentage of neutralization was calculated according to the following formula: [(luminescence of virus control − luminescence of test serum) / luminescence of virus control] × 100.
-
The Mann-Whitney U test (SPSS14.0) was used to assess whether the percentages of neutralization against a pseudovirus differed between mutant and Wt sera. This method was also employed for the analysis of Env-specific T-cell responses between the mutant and Wt groups.
Peptide pools
Pseudoviruses
DNA vaccine construction
In vitro expression and analysis of mutants
Animals and vaccination
ELISPOT assay
Neutralization assay
Statistical analysis
-
The F176A and S365A mutations were each reported to be able to improve the immunogenicity of Env (23). In the present study, the two mutant sites were combined and introduced into one recombinant plasmid, with the intention of exposing the 2G12 binding sites (Fig. 1A). This mutant was designated M2 (Table 2).
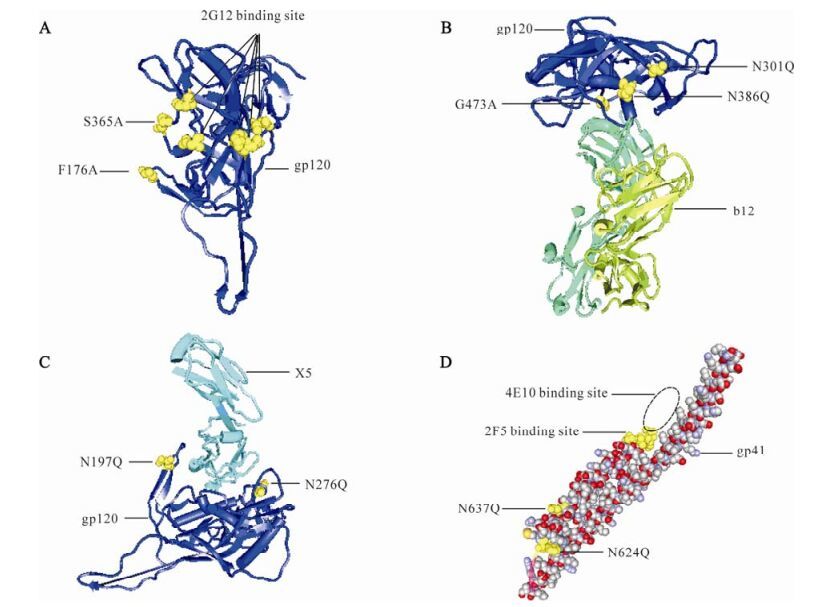
Figure 1. Neutralizing antibody epitopes and mutation sites in the 3-dimensional structure of Env. The highlighted yellow molecules are the mutation sites and Nabs binding sites. A: 3-dimensional structure of gp120. B: Interaction of gp120 and NAb b12. C: Interaction of gp120 and Fab X5. D: 3-dimensional structure of gp41.

Table 2. Expected mutant combinations and their targeted epitopes
A 3D model of the interaction between mAb b12 and gp120 is shown in Fig. 1B. From the model, the glycoside chains of N301 and N386 may prevent the b12 binding site of Env from being exposed. In addition, gp120 containing the G473A mutation was reported to cause an almost 10-fold increase in b12 binding relative to that of the Wt gp120 (23). To expose the b12 epitope of Env, N301Q, N386Q and G473A were clustered together to form group B (Fig. 1B). As observed from the interaction of gp120 and Fab X5, the glycoside chains of N197 and N276 may restrict exposure of the Env X5 epitope, which lies in the CD4-induced (CD4i) region (Fig. 1C). Therefore, mutations N197Q and N276Q were clustered together as group C to make the X5 epitope accessible to im-mune responses. The five mutant sites were combined and formed one mutant, designated M5-1 (Table 2).
There are five potential N-linked glycosylation sites in gp41HxB2, namely N611, N616, N624, N637 and N674. However, in the gp41used in the present study, the corresponding N674 disappears. In order to expose the epitopes of 2F5 and 4E10, N624 and N637 were clustered together as group D and mutated to Q to remove the glycoside chains (Fig. 1D). The two mutants combined with the three mutant sites (N301Q, G473A and N386Q) for mAb b12 formed one mutant, designated as M5-2 while those combined with two mutant sites (N197Q and N276Q) for exposure of the Env X5 epitope formed another mutant, designated M4 (Table 2).
Furthermore, the three mutant sites (N301Q, G473A and N386Q) for improving mAb b12 binding, two mutant sites (N197Q and N276Q) for exposure of the Env X5 epitope and two mutant sites (N624 and N637) for exposure of the 2F5 and 4E10 epitopes were combined together and formed one mutant, designated M7 (Table 2).
Deletion of V1V2 in Env has been reported to lead to the induction of broader NAbs with higher potency (5, 19, 29). Therefore, V1V2 deletion mutations were introduced into the parent and mutated plasmids to obtain another six new mutants designated dWt, dM2, dM5-1, dM5-2, dM4 and dM7 (Table 2). Finally, all 11 mutants were confirmed by sequencing.
-
After transient expression in 293T cells followed by western blotting analysis, the gp160 precursor and mature gp120 were observed in all cell lysates for both Wt and mutant Envs (Fig..2A and 2B). Mutant M2, consisting of F176A and S365A, involving no deglycosylation, had little influence on the apparent molecular mass of Env, and its size was similar to that of Wt. The removal of glycoside chains had clear effects on the apparent molecular mass of Env. The size reduction of Env was compatible with the number of glycoside chain removed. The sizes of mutants M4, M5-1 and M5-2, involving the removal of four glycoside chains, were similar. However, their sizes were smaller than those of Wt and mutant M2, but larger than that of mutant M7, which involved the removal of six glycoside chain. Deletion of the V1V2 loop had a significant influence on the apparent molecular mass of Env, which was reduced compared to the apparent molecular mass of Env. Thus, mutants dWt, dM2, dM5-1, dM5-2, dM4 and dM7 with deletion of the V1V2 loop were significant smaller than their original mutants. The results of the western blotting analysis further proved that the mutations had been successfully introduced into the parent Env.
-
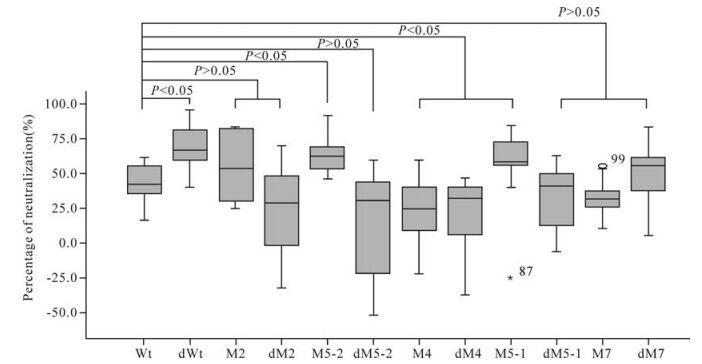
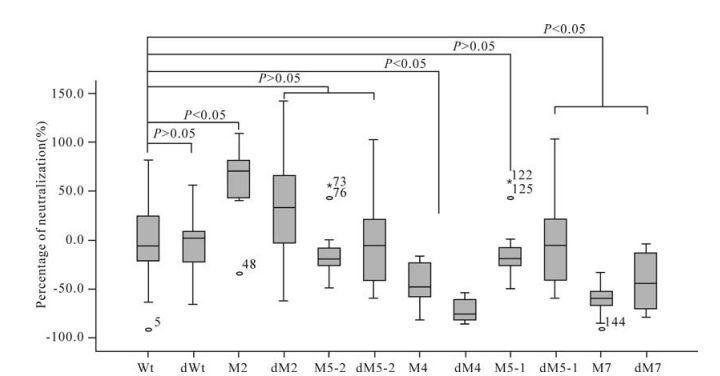
Two pseudoviruses containing the Wt and 74-2 env genes, respectively, were used to detect the neutrali-zation activities of immunized mouse sera. The average neutralization activity was 42.2% in immunized mouse sera with plasmid Wt when detected with pseudovirus Wt. Five mutants (dWt, M2, M5-2, M5-1 and dM7) induced higher neutralization activities (67.0%, 53.9%, 62.5%, 58.0% and 53.9% respectively) than plasmid Wt, while the remaining six mutants (dM2, dM5-2, M4, dM4, dM5-1 and dM7) induced lower activities (28.7%, 30.0%, 24.8%, 31.6%, 38.9% and 30.8% respectively) than plasmid Wt, when detected with pseudovirus Wt (Table 3). The neutralization activities for pseudovirus Wt induced by mutants dWt, M5-2 and M5-1 were significantly higher while those induced by mutants M4 and dM4 were significantly lower, than that induced by plasmid Wt (P < 0.05). The neu-tralization activities induced by the remaining mutants did not show statistically significant differences from that induced by plasmid Wt (P > 0.05) (Fig. 3).

Table 3. Neutralization activities of mouse sera
The average neutralization activity induced by plasmid Wt was 27.3% when detected with pseudovirus 74-2. Six mutants (dWt, M2, M5-2, M5-1, dM5-1 and dM7) induced higher neutralization activities (64.6%, 74.3%, 48.1%, 35.1%, 74.0% and 29.6%, respectively) than plasmid Wt, while the remaining five mutants (dM2, dM5-2, M4, dM4 and M7) induced lower activities (10.3%, 21.6%, 11.7%, 25.8% and 17.6%, respectively) than plasmid Wt (Table 3). Three mutants (dWt, M2 and M5-2) in-duced significantly higher neutralization activities than plasmid Wt (P < 0.05) while the neutralization activities induced by the remaining mutants were not significantly different from that induced by plasmid Wt (P > 0.05) (Fig. 4).
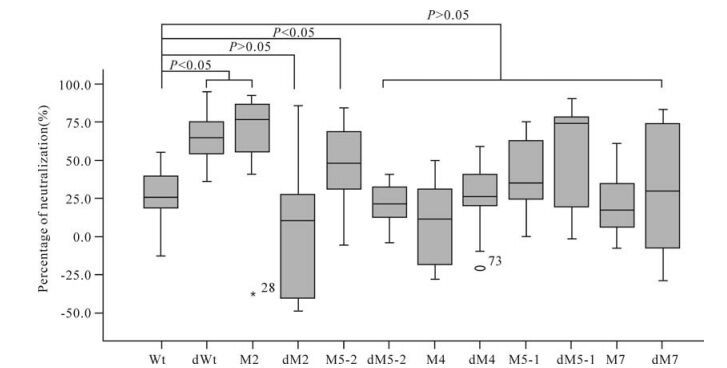
Figure 4. Neutralization assay results for the immunized mice with pseudovirus 74-2. For each distribution, the horizontal lines represent the minimum, 25th, 50th (median), 75th and maximum values.
Five mutants (dWt, M2, M5-2, M5-1 and dM7) induced higher neutralization activities than plasmid Wt when detected with both pseudoviruses. However, only the neutralization activities induced by mutants dWt and M5-2 showed statistically significant diffe-rences from that of plasmid Wt (P < 0.05) (Fig. 3 and 4).
-
Env-specific T-cell responses in immunized micewere tested using IFN-γ ELISPOT assays after stimulation of splenocytes with SHIVCHN19 peptide pools. Compared with Wt Env, most of the mutants, including dWt, M5-2, dM5-2, M4, dM4, M5-1, dM5-1, M7 and dM7, showed decreases in Env-specific T-cell induction, with specific decreases of 9.0%, 32.7%, 21.3%, 53.2%, 78.1%, 43.6%, 61.1%, 66.4% and 53.5%, respectively. Statistically significant differences were only observed for mutants M4, dM4, dM5-1, M7 and dM7. Only mutants M2 and dM2 tended to elicit more Env-specific T cells than Wt Env, with increases of 52.3% and 19.6%, respectively. However, statistical significance was only reached for mutant M2 (Fig. 5).
Selection of mutants
Wt and mutant Env expression in transiently trans-fected cells
Neutralization activities of mouse sera
Env-specific T-cell immune responses
-
A major concern for HIV-1 vaccine development is the lack of immunogens with the ability to elicit effective and broad NAbs that can protect against infection. As the main target of NAbs, enormous efforts have been focused on improving the imm-unogenicity of Env. However, Envs from primary isolates are incapable of eliciting effective NAbs due to their genetic diversity and complex conformation (4). In the present study, our strategy for Env modifi-cation was NAb-directed. While considering the im-portance of Env-specific T-cell responses (1), the influence of structural modifications on the ability of Env to elicit cellular immunity was also evaluated.
According to a previous report (23), mutation of residues F176 (V2 loop) and S365 (C3 loop) in gp120 to alanine caused a 4-fold and an 18-fold increase, respectively, in 2G12 binding relative to that seen with wild-type gp120, indicating that mutations in the V2 and C3 loops affect 2G12 binding to its carbohy-drate epitope. Mutant M2 containing both site mutations (F176A and S365A) was able to elicit both higher titers of NAbs and higher levels of Env-specific T-cell responses in mice than Wt Env. Stati-stical significance was observed in the pseudovirus 74-2 neutralization assay and Env-specific IFN-γ ELISPOT assay. While these two site mutations can individually improve the exposure of the 2G12 epitope, their combination causing more significant perturbations of the Env conformation may bring about unexpected alterations to Env, which may further improve the exposure of the 2G12 epitope or other NAb epitopes. Further studies should be carried out to clarify these issues. Similar to the case for the elicitation of higher titers of NAbs, the reason of the enhanced Env-specific T-cell responses may lie in the significant perturbations of the Env conformation. Such conformational changes may expose the T-cell response epitopes more effectively, although further studies are required to identify the exposed epitopes.
Under pressure from human immunity and antiviral therapy, an enormous number of viruses with genetic diversity are generated and most of the differences among isolates lie in the variable regions. These regions contribute to inaccessibility of the CD4 binding site and coreceptor binding site, in addition to blocking the binding of NAbs to their epitopes in Env (29). Therefore, variable loop deletion may be helpful in exposing the conserved epitopes in the conserved regions more effectively. Our present study further confirmed this hypothesis, since mutant dWt (V1V2 deletion) sera had higher neutralization activities than Wt sera in both pseudovirus neutralization assays, and the results of both assays reached statistical signifi-cance. However, little effect on the Env-specific T-cell responses was observed for this modification strategy, which may be due to little or no influence on the presentation of major T-cell epitopes.
Mutants dM2 had little influence on the ability to elicit Env-specific T-cell responses to Env, and decreased NAbs titers were detected in sera for this mutant compared to Wt sera, although statistical significance was not reached. These findings may have arisen because the modifications led to a more successful shielding of NAb epitopes with little influence on the exposure of the T-cell epitopes. Interestingly, while variable loop deletion and mutant M2 both greatly enhanced the NAb elicitation ability, mutant dM2 could not even induce NAbs as potently as Wt Env. Therefore, the V1V2 deletion and mutation in mutant M2 may interfere with each other to alter the direction of the Env conformational changes and block the access of NAb epitopes.
Antibodies specific for CD4 binding site (CD4bs) inhibit the binding of CD4 to gp120 and consequently interfere with virus attachment to the target cells. CD4bs is comprised of residues from C2, C3 and C4, and confers the conserved character of these domains, thereby explaining the cross-reactivity of anti-CD4bs mAbs when tested for their ability to bind to gp120 molecules from viruses of diverse subtypes (17). However, most anti-CD4bs mAbs fail to neutralize primary isolates, with the exception of mAb IgG1b12, which neutralized 45 of 90 primary isolates (50%) from diverse subtypes and 22 of 30 primary isolates (73%) of subtype B (2, 4). Eliminating the V3 N306 glycan of HIV-1BRU, which corresponds to the N301 glycan of HIV-1HxB2, enhanced the immunogenicity of a DNA vaccine based on Env (3). A 3G mutant containing N304Q, corresponding to N301Q of HIV-1HxB2, enhanced the binding of broadly NAbs to mutated HIV-1 Envs expressed on the cell surface (18). The location of N301 in Env is approximately at the b12 binding site. Moreover, loss of an N-linked glycosylation site at position 386 resulted in an enhanced neutralization sensitivity of HIV-1 (10) and rendered the CD4 and b12 binding sites more easily exposed (9). In addition, the G473A mutation achieved an almost 10-fold increase in b12 binding compared to that of Wt Env (23). Theoretically, mutations N301Q, G473A and N386Q may improve mAb b12 binding. Meanwhile, binding of Env to CD4 and a coreceptor is believed to initiate a series of conformational alterations that play key roles in the fusion process leading to viral entry (7, 8). Interaction of the coreceptor with the Env-CD4 complex induces the formation of intermediate Env conformations that may indicate conserved structures among primary isolates of different HIV-1 genetic subtypes that could be used as vaccines (22). Anti-CD4-induced mAbs bind to the gp120 bridging sheet, which is a beta-sheet consisting of four antiparallel beta-strands contributed by the C4 region and the V1V2 stem (21). Fab X5, selected from a phage display library derived from an HIV-1-infected donor whose serum displayed strong neutralizing activity (22), is a typical anti-CD4i mAb. Fab X5 can potently neutralize R5, X4 and R5X4 viruses, including primary isolates from different clades. The N-linked glycosylation at position 197 and 276, lying near the CD4i region (Fig. 2C), is conserved. Deleting the glycoside chains of these two sites may facilitate a more ready exposure of the NAb epitopes lying in CD4i region. M5-1, composed of N301Q, G473A, N386Q, N197Q, and N276Q, was designed to induce antibodies against the NAb b12 epitope and CD4i region. In both the neutralization assays, sera from mice immunized with M5-1 neutralized the pseudovirus more potently than that of Wt. The combination of these site mutations may expose the NAbs b12 and X5 epitopes better than Wt, or just present one of the two epitopes more effectively, or even expose other epitopes. These aspects remain to be clarified in future studies. Unlike the results of the neutralization assays, Env-specific T-cell response elicited by M5-1 was lower than that of Wt. The alteration of conformation caused by the M5-1 mutations may make the Env-specific T-cell epitopes more inaccessible. dM5-1, constructed by employing V1V2 deletion to M5-1, differed from M5-1 in immunogenicity. Compared to M5-1, sera from mice immunized with dM5-1 could neutralize pseudovirus 74-2 more potently but could not neu-tralize pseudovirus Wt efficiently. This may be because that V1V2 deletion applied to M5-1 further perturbed the Env conformation, thereby causing dM5-1 to elicit new antibodies with a narrow spectrum that could neutralize 74-2 more potently, whereas the antibodies elicited by M5-1 with neutrali-zation activity against Wt could not be induced efficiently by dM5-1. The V1V2 deletion in M5-1 may block access to Env-specific T-cell epitopes, which may be responsible for the decrease in the T-cell response of mice immunized with dM5-1 compared with those immunized with M5-1.

Figure 2. In vitro expression of DNA vaccines encoding Wt Env and its mutants in 293T cells analyzed by western blotting of cell lysates. A blank vector was used as a mock control. 1/11, marker. 2/12, vector vr1012; 3/13, Wt; 4, dWt; 5, M2; 6, dM2; 7, M5-2; 8, dM5-2; 9, M4; 10, dM4; 14, M5-1; 15, dM5-1; 16, M7; 17, dM7.
Compared to gp120, gp41 is more conserved and less glycosylated. Among the mAbs directed against gp41, only 2F5 and 4E10 have a broadly neutralizing activity. 2F5, which has a linear epitope located near the transmembrane domain at aa 662-667 (13, 26, 28), has a broad and a potent activity, and neutralized 60 of 90 isolates (67%) from various virus subtypes (2, 4). 4E10, which recognizes a predominantly linear and relatively conserved epitope at aa 671-677 proximal to the epitope recognized by 2F5 (30), is the most broadly neutralizing mAb described to date (2, 4, 30). Deletion of N635 glycan, corresponding to N637 of HIV-1HxB2, enhanced the binding affinity of NAb 2F5 (18, 25). Deletion of the glycans of N624 and N637, lying near the epitopes of 2F5 and 4E10, could theoreti-cally expose these epitopes more effectively. In our present study, mutations N624Q and N637Q and those directed against NAbs b12 and X5 were combined together in different ways, forming M5-2, M4 and M7.
Sera from mice immunized with mutant M5-2 had higher titers of NAbs than Wt sera and the enhan-cements reached statistical significance in both neutrali-zation assays. This may be due to better exposure of the expected epitopes for NAbs b12, 4E10 and 2F5, or maybe just one or two of these epitopes, or even other epitopes. In contrast to the enhanced NAb titers, the Env-specific T-cell responses for M5-2 were unfortun-ately decreased compared with Wt, and statistical significance was observed. This may be because the conformational change blocked the presen-tation of T-cell epitopes. Deleting the V1V2 region of the M5-2 may block the NAbs' epitopes, but present the Env-specific T-cell epitopes more effectively, which resulted in the decrease of the neutralization activity but in-crease of the cellular response for mice immunized with dM5-2 compared with mice immunized with M5-2.
Mutant M4, designed to induce antibodies against epitopes of X5, 2F5 and 4E10, is composed of N197Q, N276Q, N624Q, and N637Q. Compared to Wt, the abilities of mutant M4 to elicit NAbs and Env-specific T-cell responses were greatly weakened. The NAb and Env-specific T-cell epitopes may be buried more deep in M4 than in Wt due to the combination of these mutations. Mutations such as N276Q and N637Q, could singly enhance the immunogenicity of Env. However, the combination of these mutations appear to alter the conformation of Env in the wrong direc-tion, suggesting that the Env conformation may be significantly altered where some of the originally ex-posed epitopes are buried in the mutants. The dM4, generated by deleting the V1V2 region of M4, may have more effectively exposed the NAb epitopes and shielded T-cell epitopes thereby resulting in higher humoral and lower cellular immunogenicities than that of M4.
M7 is a total assembly of the site mutations examined in the present study, except for the two mutations (F176A and S365A) directed against NAb 2G12. Unfortunately, mutant M7 could not elicit these NAbs which it directs against, as expected. Similar to mutant M4, the humoral and cellular immunogen-icities of M7 were much lower than those of Wt, which may be because mutant M7 contains all the site mutations of M4. Deleting the V1V2 region may expose the NAb epitopes more effectively and hinder the Env-specific T-cell epitopes more strongly, similar to the relationship between dM4 and M4.
In this study, although several exciting immunogens, such as mutants M2, dWt, M5-1, M5-2 and so on, have been obtained, there are some interesting pheno-mena that cannot currently be explained properly and need to be further elucidated. In addition, although plasmid DNA immunization followed by electro-poration could enhance the antibody titers of the sera and T-cell responses, it is still a long way from preventing infection and controlling virus replication. Therefore, future studies may need to focus on employing viral vectors for these mutants and modifying the gp160 mutants to gp140.






 DownLoad: