


HTML
-
During the processes of independent cross-species transmission, different HIV lineages were formed, and these included HIV-1 M, N, O, and P, and HIV-2. The HIV-1 M group has been further subdivided into nine subtypes, A-D, F-H, J, and K, according to the variation in genetic distance of these amino acids. This variation is generally 8-17% and up to 30% within subtypes, whereas between subtypes, it is generally 17-35% and up to 42%, depending on the genomic regions used for subtyping (Hemelaar J, 2012; Sharp P M, et al., 2011). With the increasing sensitivity and range of sequencing techniques, increasing numbers of circulating recombinant forms (CRFs) have been reported.
The globally uneven distribution of the different HIV-1 subtypes and CRFs reflects the molecular epidemiology of the virus. In southern and eastern Africa, the predominant subtype is C, and this makes up 52% of HIV-1 infections worldwide. By contrast, in West and Central Africa, the vast majority of infections are caused by CRF02_AG, while in East Africa, subtypes A and D and their CRFs are the dominant subtypes (Delatorre E O, et al., 2012; Hemelaar J, 2012; Kallings L O, 2008; Morris C N, et al., 2006; Njai H F, et al., 2006; Pollakis G, et al., 2003; Shen C, et al., 2011; Tebit D M, et al., 2011; Worobey M, et al., 2008; Zhu T, et al., 1998). Within the homosexual populations in North and South America, Western and Central Europe, Australia, Asia (for example, Hong Kong, Japan, Korea, Taiwan etc.), North Africa, the Middle East, South Africa, and Russia, subtype B is the predominant subtype (Buonaguro L, et al., 2007; Delatorre E O, et al., 2012; Gilbert M T P, et al., 2007; Junqueira D M, et al., 2011; Moran D, et al., 2007; Paraskevis D, et al., 2009). In South America, in addition to the B, C, F, and BF subtypes, recombinant virus subtypes also coexist, and infections caused by the BF recombinant viruses (including CRF12_BF, CRF17_BF, CRF29_BF, and CRF29_BF) accounted for 80% of the HIV-1 infections in Argentina. In Eastern Europe, A1 is the predominant subtype, but subtypes B and CRF03_AB are also common in this region (Bello G, et al., 2007; Masciotra S, et al., 2000; Paraschiv S, et al., 2012; Pérez L, et al., 2006; Sierra M, et al., 2007; Silveira J, et al., 2012; Villanova F E, 2010; Walker P R, et al., 2005).
In contrast to Africa, all subtypes in Asia seem to have originated from different founder events, including the CRF01_AE, B, and C subtypes, as well as the various CRFs derived from these three subtypes. It is worth mentioning that the B subtype in Asia can also be divided into two types; in evolutionary terms, one is closer to the subtype B found in Europe and America, while the other is genetically distant, forming a clear clustering branch in the phylogenetic tree called B' or Thai B. The coexistence of HIV-1 subtypes in East Asia leads to various CRFs, which are dominant in particular regions such as the BC recombinant epidemic among drug users in Northwestern and Southeastern China, and the various Thai-B and CRF01_AE recombinants found in Thailand and Myanmar (Li Y, et al., 2010; Liao H, et al., 2009; Liu J, et al., 2011; Meng Z, et al., 2012).
The central role that HIV diversity plays in HIV transmission suggests the necessity for global HIV epidemic monitoring and a reasonable sampling strategy. In addition, studies of the association of diversity with spread, viral load, and disease progression may also give crucial clues for the prevention and treatment of HIV (Butler I F, et al., 2007; Fryer H R, et al., 2011; Restif O, 2009; Spira S, 2003; Taylor B S, et al., 2008).
Exploration of the signature patterns in the HIV genome could be the first step toward studying HIV diversity. Data mining of biological sequence requires identifying the rules, extracting features and inferring models from a large but specific biological dataset in order to classify, recognize or predict new data. This usually involves pattern mining and clustering of biological sequences, and these two techniques can usually be used interchangeably (Poonpiriya V, et al., 2008). The performance and effectiveness of the various biological sequence pattern mining and clustering methods differ, depending on the characteristics of the algorithms and the datasets used (Cai Y-D, et al., 2010; Dybowski J N, et al., 2011; Zhao Y, 2011).
Although traditional phylogenetic analysis of HIV sequences supports study of HIV origin, evolution, and dissemination, it is generally unsuitable for application to large samples because of the computational requirements (Blair C, et al., 2011). In the current study, we used an efficient method of data mining known as RIPPER (Repeated Incremental Pruning to Produce Error Reduction). This method is suitable for large-scale sample analysis (Avenue M, et al., 1994) to comprehensively analyze global HIV sequence patterns. We particularly focused on analyzing the Env regions, which cover most of the currently available datasets and include the maximum amount of information (Lynch R M, et al., 2009).
In our study, we compiled four datasets from four HIV-1 pandemic hotspots with different epidemiological and evolutionary features: Southeast Asia, China, Africa, and Southern Africa, and focused in our analysis on answering the following three questions.
1) For the four epidemiological hotspots with different epidemiological features, can we identify signature patterns that are characteristic of HIV-1 sequences from the four geographic classes?
2) Is the performance of the signature pattern inference the same for all four datasets?
3) Can we understand the scope of signature pattern analysis and the application of these patterns?
-
The global HIV-1 sequences and associated information were retrieved from the Los Alamos HIV sequence database (http://www.hiv.lanl.gov/).
-
The dataset was downloaded from LANL HIV Sequence Alignments
(http://www.hiv.lanl.gov/content/sequence/NEWALIGN/align.html) by setting Alignment type as Filter alignment (all complete sequences), Year as 2011, Organism as HIV-1, DNA/Protein as PRO, Region as Env, and Subtype as ALL.
The original downloaded dataset comprised 3,261 sequences. After removing problematic sequences, especially those with ambiguous amino acids, 2,762 sequences were extracted. The HXB2 Env sequence was used as a reference of amino acid position (with number 1 corresponding to the first Met residue).The combined set was realigned using the software MUSCLE (version 3.5) (Edgar R C, 2004) with default parameters.
The following four datasets were compiled based on the alignment of the aforementioned 2762 sequences. For inference of the signature patterns for Env sequences sampled in Southeast Asia, we obtained an aligned set of 312 Southeast Asian and 2,450 non-Southeast Asian Env sequences by extracting sequences with labels of "TH, " "CN, " "MY, " or "VN" in the sequence headers. For inference of the signature patterns for Env sequences sampled in China, we obtained an aligned set of 162 Chinese and 2,600 non-Chinese Env sequences from the above overall alignment by extracting the sequences with the label of "CN" in the sequence headers. For the inference of signature patterns for Env sequences sampled in Africa, we obtained an aligned set of African Env sequences by extracting the sequences with labels of African countries in the sequence headers. African samples were separated into five regions as follows:
1. Southern ("AO", "ZM", "ZW", "BW", "ZA", "NA");
2. Central ("CF", "CM", "CG", "GA", "AO").
3. Western
("ML", "GH", "NE", "NG", "SN", "GM", "BJ").
4. Eastern ("ET", "UG", "KE", "SO", "TZ", "RW").
5. Northern ("EG", "SD", "LY", "MA", "TN").
For the inference of signature patterns of Env sequences sampled in Africa, we obtained an overall aligned set of 1,103 African and 1,659 non-African Env sequences, whereas for the inference of signature patterns for Env sequences sampled in Southern Africa alone, we selected only the Southern African sequence described above ("AO", "ZM", "ZW", "BW", "ZA", "NA"), which gave an aligned set of 599 Southern African and 2,163 non-Southern African Env sequences.
Extraction of all labels and the manipulation of characters were performed using the R scripts (Supplementary material 1). The supplementary materials and the four alignment files are available on the website of Virologica Sinica: http://www.virosin.org.
-
To deduce the signature patterns of the four datasets, we used JRip software (Witten I H, et al., 2011) in RWeka (Hornik K, et al., 2009), which can be used in the R environment (Gentleman R C, et al., 2004; Hornik K, et al., 2009) (http://cran.r-project.org). JRip implements RIPPER, which is an incremental machine learning method. In addition, the rule sets can be inferred directly from the training datasets, thus this method is suitable for the fast inference of rules from large datasets. Further association studies and plotting were performed in the R environment.
-
To certify the inference of signature patterns, we tested the classification assessment of the signature patterns. We assessed in detail the performance of signature patterns in the classification of Env sequences of Southeast Asian or non-Southeast Asian samples. We performed a full 'leave-one-out' classification run with the same set of 2,762 Env sequences used above; each of the sequences was omitted once from the training data, and a set of signature patterns was learned by RIPPER from the remaining 2,761 sequences and their class labels as described above. This was followed by the classification of the remaining one sequence as either Southeast Asian or non-Southeast Asian, based on this set of signature patterns. Comparison of the 2,761 predicted and true class labels allowed for an assessment of the prediction performance. The same procedure was used for assessment of classification of the other three datasets.
-
In an attempt to explain the positions captured in the pattern inferences from the information theory, R-package bio3d (Grant B J, et al., 2006) was used to manipulate and analyze sequences. Using the "entropy" function, we could compute Shannon entropies Sj for alignment position j based on a 22-letter alphabet, including the conventional amino acid, the gap symbol "-, " and "X" (this letter was last not used here), according to the following formula:
with the relative frequency Pij of letter i at alignment position j.
-
Owing to the limitations of phylogenetic analysis, such as computational requirements, we considered in this study only one specific pattern corresponding to subtype B and Thai-B (B') in Southeast Asian sequences, as this analysis might provide important clues to specific geographic origin corresponding to the Chinese HIV-1 B'pandemic and help to interpret identified patterns from a phylogenetic viewpoint, which might exclude founder effects.
Making use of the maximum likelihood (ML) method to reconstruct phylogenetic trees, we analyzed a set of 954 global HIV-1 subtype B (B') Env sequences, with 10 HIV-1 subtype D sequences added as an outgroup. The substitution model we chose was HIVb + I + Gamma, and the heuristic tree searches used Nearest-neighbor interchange (NNI), and branch support estimation used approximate likelihood ratio (aLTR). After obtaining the phylogenetic tree, the association of amino acid pattern with the phylogenetic clustering branches was plotted with the R-package ape (Paradis E, et al., 2004).
Dataset compilation
Rule inference
Assessment of signature pattern inference
Entropy calculation for pattern positions
Phylogenetic analysis for pattern positions
-
Inspired by our previous findings of Chinese HIV-1 genome signature patterns (Wang Y, et al., 2013), and based on a large body of epidemiological evzidence that Chinese HIV-1 sequences have a close phylogenetic relationship with Southeast Asian sequences, we tested the signature patterns for Southeast Asian Env sequences.
After compiling the first aligned dataset, which comprised 312 Southeast Asian and 2,450 non-Southeast Asian Env sequences (label strategy and methods are shown in Materials and methods) and applying rule inference, we obtained the following 7 rules and "x" reprents the amino acid position.
1. (x219 = T) and (x722 = H) => SE=TRUE (185.0/28.0)
2. (x108 = V) and (x725 = G) and (x63 = T) => SE=TRUE (64.0/8.0)
3. (x553 = R) and (x190 = S) => SE=TRUE (44.0/4.0)
4. (x375 = H) and (x148 = G) and (x820 = I) => SE=TRUE (20.0/0.0)
5. (x219 = T) and (x108 = V) and (x742 = K) => SE=TRUE (12.0/4.0)
6. (x746 = T) and (x317 = L) and (x698 = I) => SE=TRUE (6.0/0.0)
7. => SE=FALSE (2431.0/25.0)
The first rule translates as: "Env sequences that have both a T at amino acid position 219 and a H at position 722 could be considered as Southeast Asian sequences." Sites 219 and 722 were numbered according to the HXB2 reference sequence. This first rule covered 185 sequences, with 28 false positives (that is, sequences not from Southeast Asia). The other rules can be interpreted analogously. The seventh rule "= > Southeast Asian = FALSE" means that if none of the previous six rules has been found in a sequence, it is a non-Southeast Asian sequence. The false-negative rate with this rule is about 1%. The total prediction accuracy for the combination of all 7 rules in distinguishing Southeast Asian from non-Southeast Asian sequences was 97.5%.
-
To address the statistical errors for the classification of signature patterns, we tested the classification performance of signature pattern inference. We performed a full 'leave-one-out' classification as described above, run with the same set of 2,762 Env sequences; each of the sequences was omitted once from the training data, and a set of signature patterns was learned by RIPPER from the remaining 2,761 sequences and their class labels. This was followed by the classification of the omitted sequence in this set of signature patterns as being Southeast Asian or non-Southeast Asian. Comparison of the 2,761 predicted and true class labels allowed assessment of the prediction performance. The receiver operating characteristic (ROC) curve and area under the curve (AUC) indicated good performance of the signature patterns mentioned above (Supplementary material 2).
-
In general, each individual rule covered two or three non-adjacent positions in the above set of patterns. Of the 1,157 alignment sites, only 14 sites were found to occur within the whole rule set made up of the 7 rules. In addition, some of the 14 sites occurred frequently within the whole rule set.
In an attempt to investigate this phenomenon further, we computed the sequence entropy for all alignment sites and plotted it against the frequency of occurrence in the above 6 rules rather than rule 7 (Fig. 1). The figure showed that the most frequently occurring sites within these rules tended to be those with higher entropy. However, there were some striking outliers, such as alignment sites 108,219, and 820, which occurred more frequently but had lower entropy, suggesting that these sites are less variable but more informative in Southeast Asian sequences.
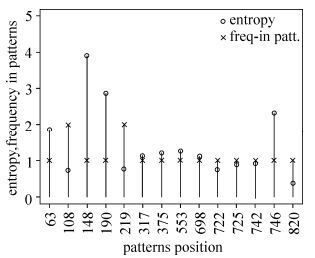
Figure 1. Sequence entropy and frequency of alignment sites occurring in Southeast Asia signature patterns. The 14 different aligned positions (according to the HXB2 numbering) deduced by the rule set from Southeast Asian HIV-1 Env sequences are listed on the X-axis. Shannon entropy readings are shown as circles and position frequency in patterns is shown as crosses.
-
Generally, the classification of HIV into groups and subtypes is based on the variation in genetic distance in HIV sequences. Thus, the HIV-1 subtype itself can be considered as being composed of HIV-1 strains with distinct signature patterns. As for the sequences from Southeast Asia, we would also anticipate that the inferred rules might at least suggest subtype features. We therefore investigated whether such rules existed for the Southeast Asia isolates.
As shown in Fig. 2, some deduced rules were subtype-specific. For example, we found that patterns 1 and 4 were almost exclusively associated with CRF01_AE, whereas pattern 2 reflected features of subtypes C, CRF07_BC, CRF08_BC, and BC recombinants (the latter three recmbinants are chimeric with subtype C in Env), and pattern 3 was characteristic of subtypes B and 01B.
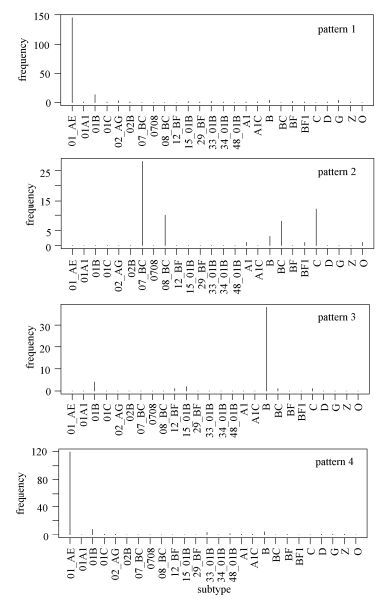
Figure 2. Signature patterns of Southeast Asian HIV-1 Env sequences and subtypes. The frequency of subtypes is shown for the first four patterns inferred from Southeast Asian HIV-1 Env sequences.
-
After investigating associations between rules and subtypes, we next considered the associations between rules and geographical variations. The specific sites 108 and 219, which occurred frequently in all the aforementioned 7 patterns (Fig. 3), are not characteristic of subtype but rather of their origin, that is, Southeast Asia.
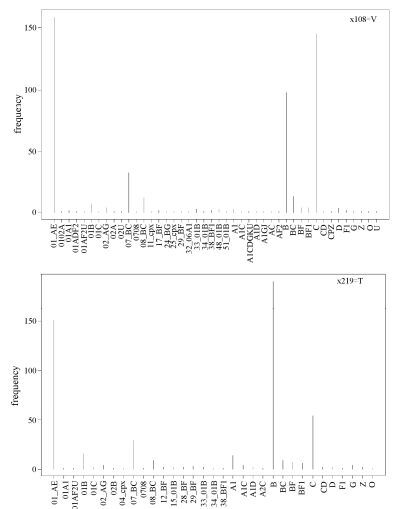
Figure 3. Relationship of signature patterns of positions 108 and 219 from Southeast Asian HIV-1 sequences with subtypes. The frequency of subtypes is shown for positions 108 and 219 inferred from Southeast Asian HIV-1 Env sequences. These two specific positions, which occur frequently in the whole rule set, are characteristic of having Southeast Asian origin, rather than being subtype-specific.
-
To explain these patterns from a phylogenetic viewpoint, we compared the position combination that frequently occurred in patterns, (x553 = R) and (x190 = S), with the evolutionary relationship of this amino acid combination. Again, because the phylogenetic analysis was limited by computational capacity, we only considered the global subtype B/B'linkage, which is the major pandemic subtype both in Southeast Asia (B') and worldwide (B). To this end, we constructed an ML phylogenetic tree for a set of 954 subtype B/B'amino acid sequences of HIV-1 Env, with 10 subtype D sequences as an outgroup (Fig. 4). Most of the Southeast Asian subtype B sequences were found to lie in a separate cluster distinct from the pandemic global subtype B sequences (Fig. 4, top left: green cluster). Sequences with R553 or S190 only (not the combination of both) were distributed throughout the whole tree (Fig. 4, bottom left and top right: blue and red branches), whereas sequences with both R553 and S190 together were found to lie in similar branches with the Southeast Asian cluster (Fig. 4, bottom right: yellow cluster). In general, this first rule of (x553 = R) and (x190 = S) is consistent with phylogenetic clustering of the Southeast Asian or subtype B/B'clusters.
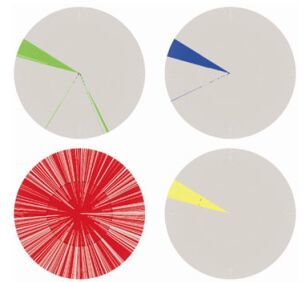
Figure 4. Maximum likelihood phylogenetic tree of global HIV-1 subtype B/B' Env sequences. The graph is colored for geographic and amino acid features. Top left: green indicates sequences from Southeast Asia; bottom left: red indicates with sequences with x553 = R; top right: blue indicates sequences with x190 = S; bottom right: yellow indicates sequences carrying the signature pattern (x553 = R) and (x190 = S).
-
Although we previously completed the rule inference of Chinese HIV-1 genome signature patterns in a combined dataset of 1,047 Chinese and 1,288 non-Chinese sequences (Wang Y, et al., 2013), here we compiled a second aligned dataset, which comprised 162 Chinese and 2,600 Non-Chinese Env sequences (the whole alignment was the same as that for the other three datasets). From this, we obtained 11 rules (Supplementary material 3).
In general, two to five sequence sites were included in each separate rule, and almost all of them were not close to each other. In addition, some sites appeared many times in the whole pattern, such as sites 108 and 219. The most interesting site was site 108, which occurred in five patterns, suggesting a key role for this site in all the Chinese sequences. Although the false-positive rate of the separate pattern was relatively high, the overall false-negative rate was only 0.78%. The whole rule set can be used to distinguish Chinese-specific sequences, with an overall classification accuracy of 98.3%.
-
There are multiple hints of HIV in Africa. Firstly, West and Central Africa were the sites of origin of HIV, which evolved through cross-species transmission of simian immunodeficiency virus in other primates to humans. Secondly, sub-Saharan Africa is the most severely affected region for HIV infection, with a rate of 4.9% in the population, and it accounts for 69% of HIV infections worldwide. Moreover, as outlined in the introduction, the geographical distribution of subtypes and CRF is complex.
Thus, we expected that extending our analysis to the whole African sequences would reveal different patterns specific to these sequences. After compiling the third aligned dataset, which comprised 1,103 African and 1,659 non-African Env sequences and applying rule inference, we obtained 13 rules (Supplementary material 4). We calculated that the combination of all 13 rules would give a total prediction accuracy of 88.4% in distinguishing African from non-African sequences, with a predicted false-negative rate of 7%.
-
Compared to the relatively homologous HIV-1 diversity in Southeast Asia, the highest diversity of whole African HIV-1 sequences may be one of the reseans of less prediction efficiency.
Nevertheless, taking into consideration of 1,167 alignment sites, these rules were still relatively effective at classification. As before, we found that some sites appeared many times in the whole patterns, such as sites 219 (5 times), 315 (4 times), and 720 (3 times). Fig. 5 shows the analysis of the first two patterns specifically. Some deduced rules seemed to be subtype-specific, whereas others were not. For example, rule 1 was found to be associated almost exclusively with subtype C, whereas rule 2 captured features of subtypes C, D, A1D, and CRF02_AG.
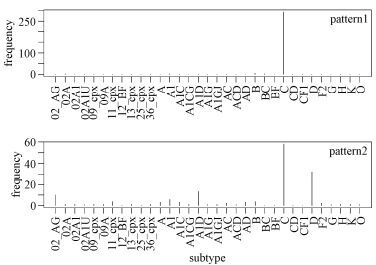
Figure 5. Signature patterns of African HIV-1 sequences and subtypes. The X-axis shows all the subtypes in the compiling dataset of African origin. The first two patterns were the most representative, and thus subtype frequencies were compared with these patterns.
-
The main focus of HIV research is Southern Africa, which has the highest HIV infection rates and most severe HIV pandemics. However, the genetic diversity of HIV in Southern Africa is the lowest.
After compiling the fourth aligned dataset which comprised 599 Southern African and 2163 Non-Southern African Env sequences and applying rule inference, we obtained 6 rules (Supplementary material 5).
The whole signature patterns were extremely succinct, covering 10 different and adjacent sequence sites and a total of 1,167 alignment sites. Although the false-positive rate for separate patterns was relatively high, the overall false-negative rate for rule 6 was 0.35%, and the combination of the six rules (rule set) was able to separate Southern African from non-Southern African sequences with a prediction accuracy of 91.2%. The whole deduced five signature patterns of Southern African HIV-1 sequences were exclusively specific with subtype C. Besides, the informative site 21 was dominant in the whole rule set, suggesting its key role in all the sequences from Southern African. When linking the specific site with the subtypes in Southern African, we also find an extremely dominant pattern with subtype C.
-
Since many of the signature patterns inferred above were associated exclusively with specific subtypes and CRFs, we further investigated geographical and evolutionary associations for different subtypes worldwide.
To this end, three sets of patterns were inferred from global subtype C, B and all possible recombination forms chimeric with CRF01_AE Env sequences, including the rules obtained from inference of subtype C Env sequences worldwide, the rules obtained from inference for subtype B Env sequences worldwide and the rules obtained from inference for all possible recombination forms chimeric with CRF01_AE Env sequences worldwide (Supplementary material 6-8).
Comparative analysis of the above three sets of patterns gave an indication of subtypes. As Fig. 6 shows, the signature patterns of HIV-1 global subtype C sequences were extremely common in Zambia (southern Africa), which may also hint at the origin of HIV-1 subtypes and the necessity for paying special attention to this area. Somewhat differently, Fig. 7 shows that signature patterns of HIV-1 global subtype B sequences were associated with some pandemic countries, such as United States, Brazil, Great Britain, Cyprus, and Japan. We also found that site 21 is present in all three rule sets implying some fundamental importance for this site. In detail, there are distinct patterns at single position 21 with glycine, leucine and isoleucine corresponding to subtype C, B and all possible recombination forms chimeric with CRF01_AE, also dominating the above regions separately.
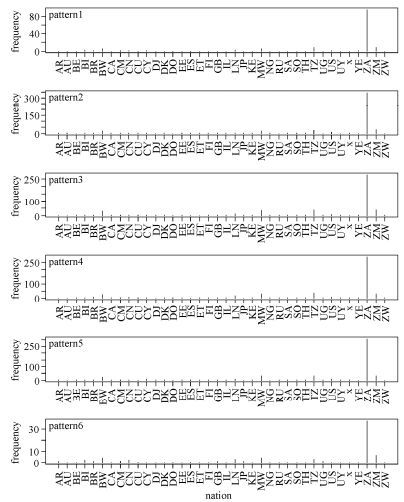
Figure 6. Signature patterns of HIV-1 global subtype C sequences and countries. The X-axis shows all the countries from which HIV-1 subtype C sequences were sampled. All six patterns are shown, with their frequency distribution in the sampled countries.
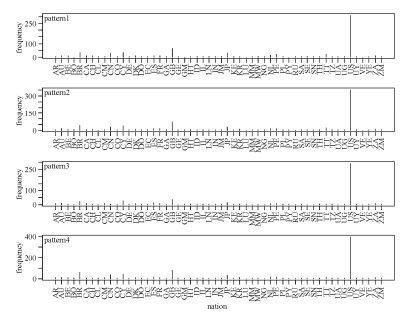
Figure 7. Signature patterns of HIV-1 global subtype B sequences and countries. The X-axis shows all the countries from which HIV-1 subtype B sequences were sampled. All five patterns are shown, with their frequency distribution in the sampled countries.
Rule inference for Southeast Asian HIV-1 Env sequences
Statistical errors for the classification of signature patterns
Analysis of signature patterns found in Southeast Asian HIV-1 sequences
Inferred rules are associated with HIV-1 subtypes
Inferred rules are characteristic of geographic sampling
Support by phylogenetic analysis for the position combination (x553 = R) and (x190 = S)
Rule inference for Chinese HIV-1 Env sequences
Rule inference for African HIV-1 Env sequences
Analysis of signature patterns found in African HIV-1 sequences
Rule inference for Southern Africa HIV-1 Env sequences
Extensive study on signature patterns for Env sequences of different subtypes sampled worldwide
-
Normally, to infer sequence patterns linked with specific classifications (such as a host group) correctly, it is necessary that the sequences or sequence sites are variable, and that a sufficient number of sequences are available for statistical analysis. The simple method of rule inference can be used to deduce the patterns of global HIV-1 lineages. However, the effectiveness of this approach varies somewhat among lineages.
Geographically, Southern African HIV-1 sequences, which have the lowest diversity performed best in signature pattern inference, whereas for the whole African sequences, the accuracy of prediction was lower. Compared with the results for rule inference in Chinese and Southeast Asian sequences, these two geographic samplings had no distinct effect on the overall prediction accuracy of signature pattern inference.
We observed that signature patterns of subtype C had extremely high representation in certain of the sampled countries, which may hint at the importance of this region in the early stages of the epidemic. However, it is possible that the sampling bias may have influenced this result. By contrast, the signature patterns of subtype B sequences were associated with different countries. We found that site 21 had clearly distinct patterns among all three subtypes of the global HIV-1 sequence.
When we analyzed the effect of other genome regions (Gag, Pol) on pattern inference, we also found qualitatively similar results (unpublished data).
-
Because there are no specially designed knowledge-mining algorithms, the results are difficult to explain and are unable to meet the requirements of biological research. Thus, appropriate analytical methods are needed to further explain the results of data mining. For example, we can refer to particular features of aligned sequences (WebLogo) (Crooks G E, et al., 2004), immune epitope prediction methods (NetMHC) (Lundegaard C, et al., 2008), mutational modeling methods (pyMOL) (Delano W L, et al., 2004), information theory, and related methods (direct coupling analysis) (Morcos F, et al.) to explain the significance of global HIV-1 sequence patterns from the viewpoints of evolutionary conservation, immune escape, structural stability, and physical contact separately. The preliminary analyses are shown in Fig. 8 and 9.
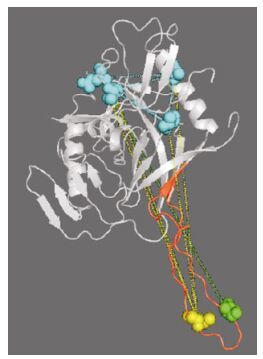
Figure 8. The deduced physical contacts of the sites found in the Chinese sequence patterns. The background structure shown is gp120, with the V3 region marked in red. The two residues of signature pattern 1 are marked by a green sphere (residue 309) and a yellow sphere (residue 317). The lines connecting these indicate high-DI pairs. Those high-DI amino acid pairs that include residue 309 or residue 317 are shown as blue spheres, and are located in the V2, C2, and V4 regions.
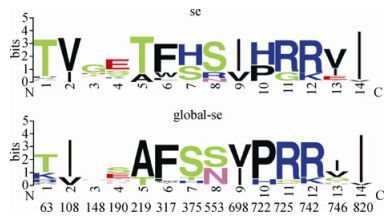
Figure 9. Results from two datasets: (a) dataset of Southeast Asian sequences and (b) dataset of global sequences covering only the pattern positions inferred from the previous six patterns. Program used was WebLogo version 3.3 (accessed June 3, 2013).
-
The ideal solution for controlling the HIV infection situation is to develop vaccines; however, the diversity of HIV challenges the development of such vaccines.
Normally, vaccine strains can be designed either using sequences from contemporary strains (strains within the region), ancestral sequences, artificial consensus sequences, or central sequences in the phylogenetic tree. So far, all Phase Ⅲ vaccines have been based on the original strain sequence, and as it is considered similar to the contemporary epidemic strain, cross-linking reaction might be induced increasingly. In addition, vaccine design has also focused on the HIV conserved genome region because on the one hand, these regions are more easily recognized by cross-reacting T-cells, while on the other hand, mutations in conserved regions will influence virus fitness. Another development of vaccines is to increase coverage of the epitope so as to increase T-cell response (Fauci A S, et al., 2008; Karlsson Hedestam G B, et al., 2008; Tebit D M, et al., 2011; Walker B D, et al., 2008; Yang O O, 2009). Therefore, our findings should be considered further in the context of vaccine development. For example, patterns characteristic of geographic areas may show a cross-reactivity effect, in contrast to patterns associated with subtype. Sites 108 and 219, which are conserved but informative in the patterns, in the detection of entropy, and in the evolutionary relationship, should also be considered during vaccine design.
Scopes of signature pattern analysis
Mechanisms of these signature patterns
Application of these signature patterns
-
We gratefully acknowledge the funding by the Chinese Key National Science and Technology Program in the 12th Five-Year Period, grant 2012ZX10001006-002;
And the Deutsche Forschungsgemeinschaft (http://www. dfg.de), grant TRR60/A6; the University of Duisburg-Essen (http://www.uni-due.de)
-
Yan Wang: Performed the experiments and wrote the article
Reda Rawi: Paticipated in a portion of experiments
Daniel Hoffmann: Designed the project
Binlian Sun: Designed the project and revised the article
Rongge Yang: Designed the project and revised the article
-
The supplementary materials and the four alignment files are available on the website of Virologica Sinica: http://www.virosin.org.

 DownLoad: