-
Rasmussen’s encephalitis (RE) is a rare pediatric neurological disorder with an incidence rate of about 1.8 per 10 million in Europe (Varadkar et al., 2014). Focal epilepsy, progressive hemisphere atrophy, and a decline in cognitive function are representative clinical characteristics of the disease. Without surgical intervention, RE patients gradually develop severe clinical symptoms including intractable epilepsy and severe deterioration of neurological function (Bauer et al., 2002). Currently, hemispherectomy is the only effective method for controlling seizures and cognitive deterioration. However, homonymous hemianopia and hemiplegia are inevitable, although both may be present before surgery (Guan et al., 2014; Varadkar et al., 2014).
RE was first reported by Theodore Rasmussen and his colleagues in the late 1950s. They described three individuals presenting with focal seizures due to chronic encephalitis and defined this special encephalitis as “Rasmussen’s encephalitis” (Rasmussen et al., 1958). Since then, cases of RE have been reported worldwide. Although neuroscientists have made many attempts to identify the cause of RE over the past few decades, the etiology and pathogenesis of RE remain unclear. Several factors are thought to be associated with the occurrence of this syndrome, including viral infection and abnormal immune modulation. Pathological characteristics observed in the brains of RE patients mainly include lymphocyte infiltration, neuron loss, vascular cuffing, and microgliosis, which are similar to those observed in viral encephalitis (Pardo et al., 2004). Therefore, it has been proposed that viral infection may be an important cause of RE.
Previously, components of several viruses were detected in the brain tissues of patients with RE. These included enterovirus, human cytomegalovirus (HCMV), herpes simplex virus 1 (HSV-1), human papillomavirus (HPV), and Epstein-Barr virus (EBV), indicating the involvement of viral infection in RE (Friedman et al., 1977; Walter and Renella, 1989; Power et al., 1990; Farrell et al., 1991; Jay et al., 1995; Chen et al., 2016). This finding was further supported by a report from Takahashi et al. (2006) , who found that nearly 50% of patients with RE had a prior history of viral infection or vaccination. However, as many kinds of viruses can be detected in RE brain tissues, RE does not seem to be a specific viral encephalitis. In other words, viral infection may be just one factor that triggers the disease. Therefore, it has been speculated that interactions between viral infection and immune responses may be involved in the pathogenesis of RE.
The innate immune system is an important part of the overall immune system and provides an immediate defense against infection. The innate immune system recognizes conserved molecular patterns in pathogens, such as bacterial cell wall molecules and viral and fungal products, via germ-line encoded receptors called pattern recognition receptors (PRRs). Toll-like receptors (TLRs) are one of the most important classes of PRRs, modulating innate immune responses and influencing the development of adaptive immunity (Matin et al., 2015; Verma and Bharti, 2017). TLRs have been identified in many species. In mammals, these receptors have been assigned numbers 1 to 11 (TLR1–TLR11). Among the TLRs, TLR3 and TLR9 are expressed in endosomes and act as antiviral TLRs that recognize viral replication products (dsRNA) and unmethylated CpG oligodeoxynucleotides (Alexopoulou et al., 2001). The binding of these ligands activates the TRIF- or MyD88-dependent signaling pathway, which amplifies the inflammatory response signal and finally releases cytokines and anti-viral factors. TLR3 and TLR9 thus play important roles in combatting DNA virus infections.
Several viruses are neurotropic, and infection with these can lead to nervous system disorders such as encephalitis, encephalopathy, meningitis, and neuritis. It has been reported that several viral antigens can be detected in the human central nervous system, including in the endosomes of immune cells and neurons (Bsibsi et al., 2002). Previously, others and we reported the detection of HCMV, HSV-1, and EBV in RE brain tissues (Walter and Renella, 1989; Farrell et al., 1991; Zhang et al., 2017). Because TLR3 and TLR9 are important PRRs for DNA viruses, it is speculated that the TLR3 signal pathway is activated by viral dsRNA through TRIF, a downstream molecule of TLR3, leading to the release of proinflammatory cytokines and tissue injury. In this study, we first determined the expression levels of human herpesviruses (HHVs) in the brain tissues of RE patients and found significantly elevated levels of EBV (an HHV) antigens in RE brain tissues, accompanied by enhanced expression of TLR3/TRIF and TLR9. High expression of EBV is associated with increased brain atrophy in RE patients. Our results suggest that interactions between EBV and TLR3 may be associated with RE occurrence and progression.
-
A total of 26 patients with RE, admitted to Sanbo Brain Hospital from April 2008 to December 2013, were enrolled in the study (Zhang et al., 2017). Clinical diagnosis was made according to the European diagnostic criteria (Bien et al., 2005). The control group consisted of 16 patients who underwent surgical treatment for cerebral trauma, generally matched with the RE patient group for age and excluding other nervous system diseases. After craniotomy, at least two blocks of brain tissues from different areas were collected from patients with RE. The tissues were fixed, embedded in paraffin, sliced to a thickness of 6 μm, and then subjected to histopathological analysis via hematoxylin & eosin (HE) staining and the detection of EBV, TLR, and TRIF expression via immunohistochemical (IHC) staining. In the control group, brain samples were obtained from the edges of the resected damaged cortex.
-
Each patient was performed with a MRI scanner (Siemens 3.0T TIM Trio MRI, Germany) to diagnose the disease before the operation in Sanbo Brain Hospital. Abnormal cortical and/or subcortical hyperintense signals compared with the signals of the contralateral hemisphere on T2 and FLAIR images were observed in 18 RE patients.
-
The sections were incubated with xylene solution to remove paraffin and hydrated with the serially reduced concentration alcohol solution. Then the section was stained with Mayer’s hematoxylin for 5 min, followed by staining with eosin Y solution for 3 min. The sections were dehydrated with 95% alcohol (× 2 times) and 100% alcohol (× 2 times) respectively, followed by incubation with xylene. Finally the section was mounted and observed with a microscope.
-
Paraffin sections were treated according to a routine IHC method (Zhang et al., 2017). After removing paraffin, sections were incubated with 3% peroxide-methanol and 1% bovine serum albumin for blocking endogenous peroxidase activity and nonspecific antibody binding sites, respectively. For antigen retrieval, sections were heated to 100 °C for 15 min in sodium citrate-hydrochloric acid buffer solution, followed by incubation with antibody against EBV latent membrane protein 1 (LMP1) (ab78113, Abcam, Cambridge, UK), TLR3 (ab62566), TLR9 (ab12121), and TRIF (ab13810) at 4° C overnight. After washing with PBS, sections were incubated with horseradish peroxidase (HRP)-labeled secondary antibodies for 60 min at 25 °C. Finally, diaminobenzidine substrate was added for coloration. Then, the sections were counterstained with hematoxylin and photographed (Olympus BX61, Japan).
-
The atrophy grade (AG) of each patient was defined according to MRI characteristics and ranged from 0 to 3 (Zhang et al., 2017), with a higher AG indicating more severe atrophy of the brain.
IHC results were evaluated using a scoring methodology described previously (Allred et al., 1998; Wang et al., 2003). In brief, yellow or brown stained particles in the cell cytoplasm or nucleus were considered positive signals and analyzed using image analysis software (Image-Pro Plus 6.0; Media Cybernetics Inc., Bethesda, MD, USA). The scoring system combines the percentage of positive cells, categorized as 0 (< 5%), 1 (5%–25%), 2 (26%–50%), 3 (51%–75%), or 4 (> 75%), and a subjective assessment of staining intensity, scored as 0 (colorless), 1 (light yellow), 2 (yellow or brown), or 3 (dark brown). These scores are added together to give overall IHC scores of ≤ 1 for negative staining, 2–3 for weakly positive, 4–5 for moderately positive, and > 6 for strongly positive staining.
-
Statistical analysis was performed using SPSS 13.0 software. Fisher’s exact test was performed to determine the correlation between the expression of EBV antigens or TLR3 expression and the severity of brain atrophy. P-values < 0.05 were considered statistically significant.
-
There were 16 males and 10 females in the RE group, with a mean age of seizure onset of 5.8 years and a mean age at surgery of 7.5 years. Notably, about half of these had a definite preceding infection history. The 16 patients in the control group were generally matched with the RE patient group for age.
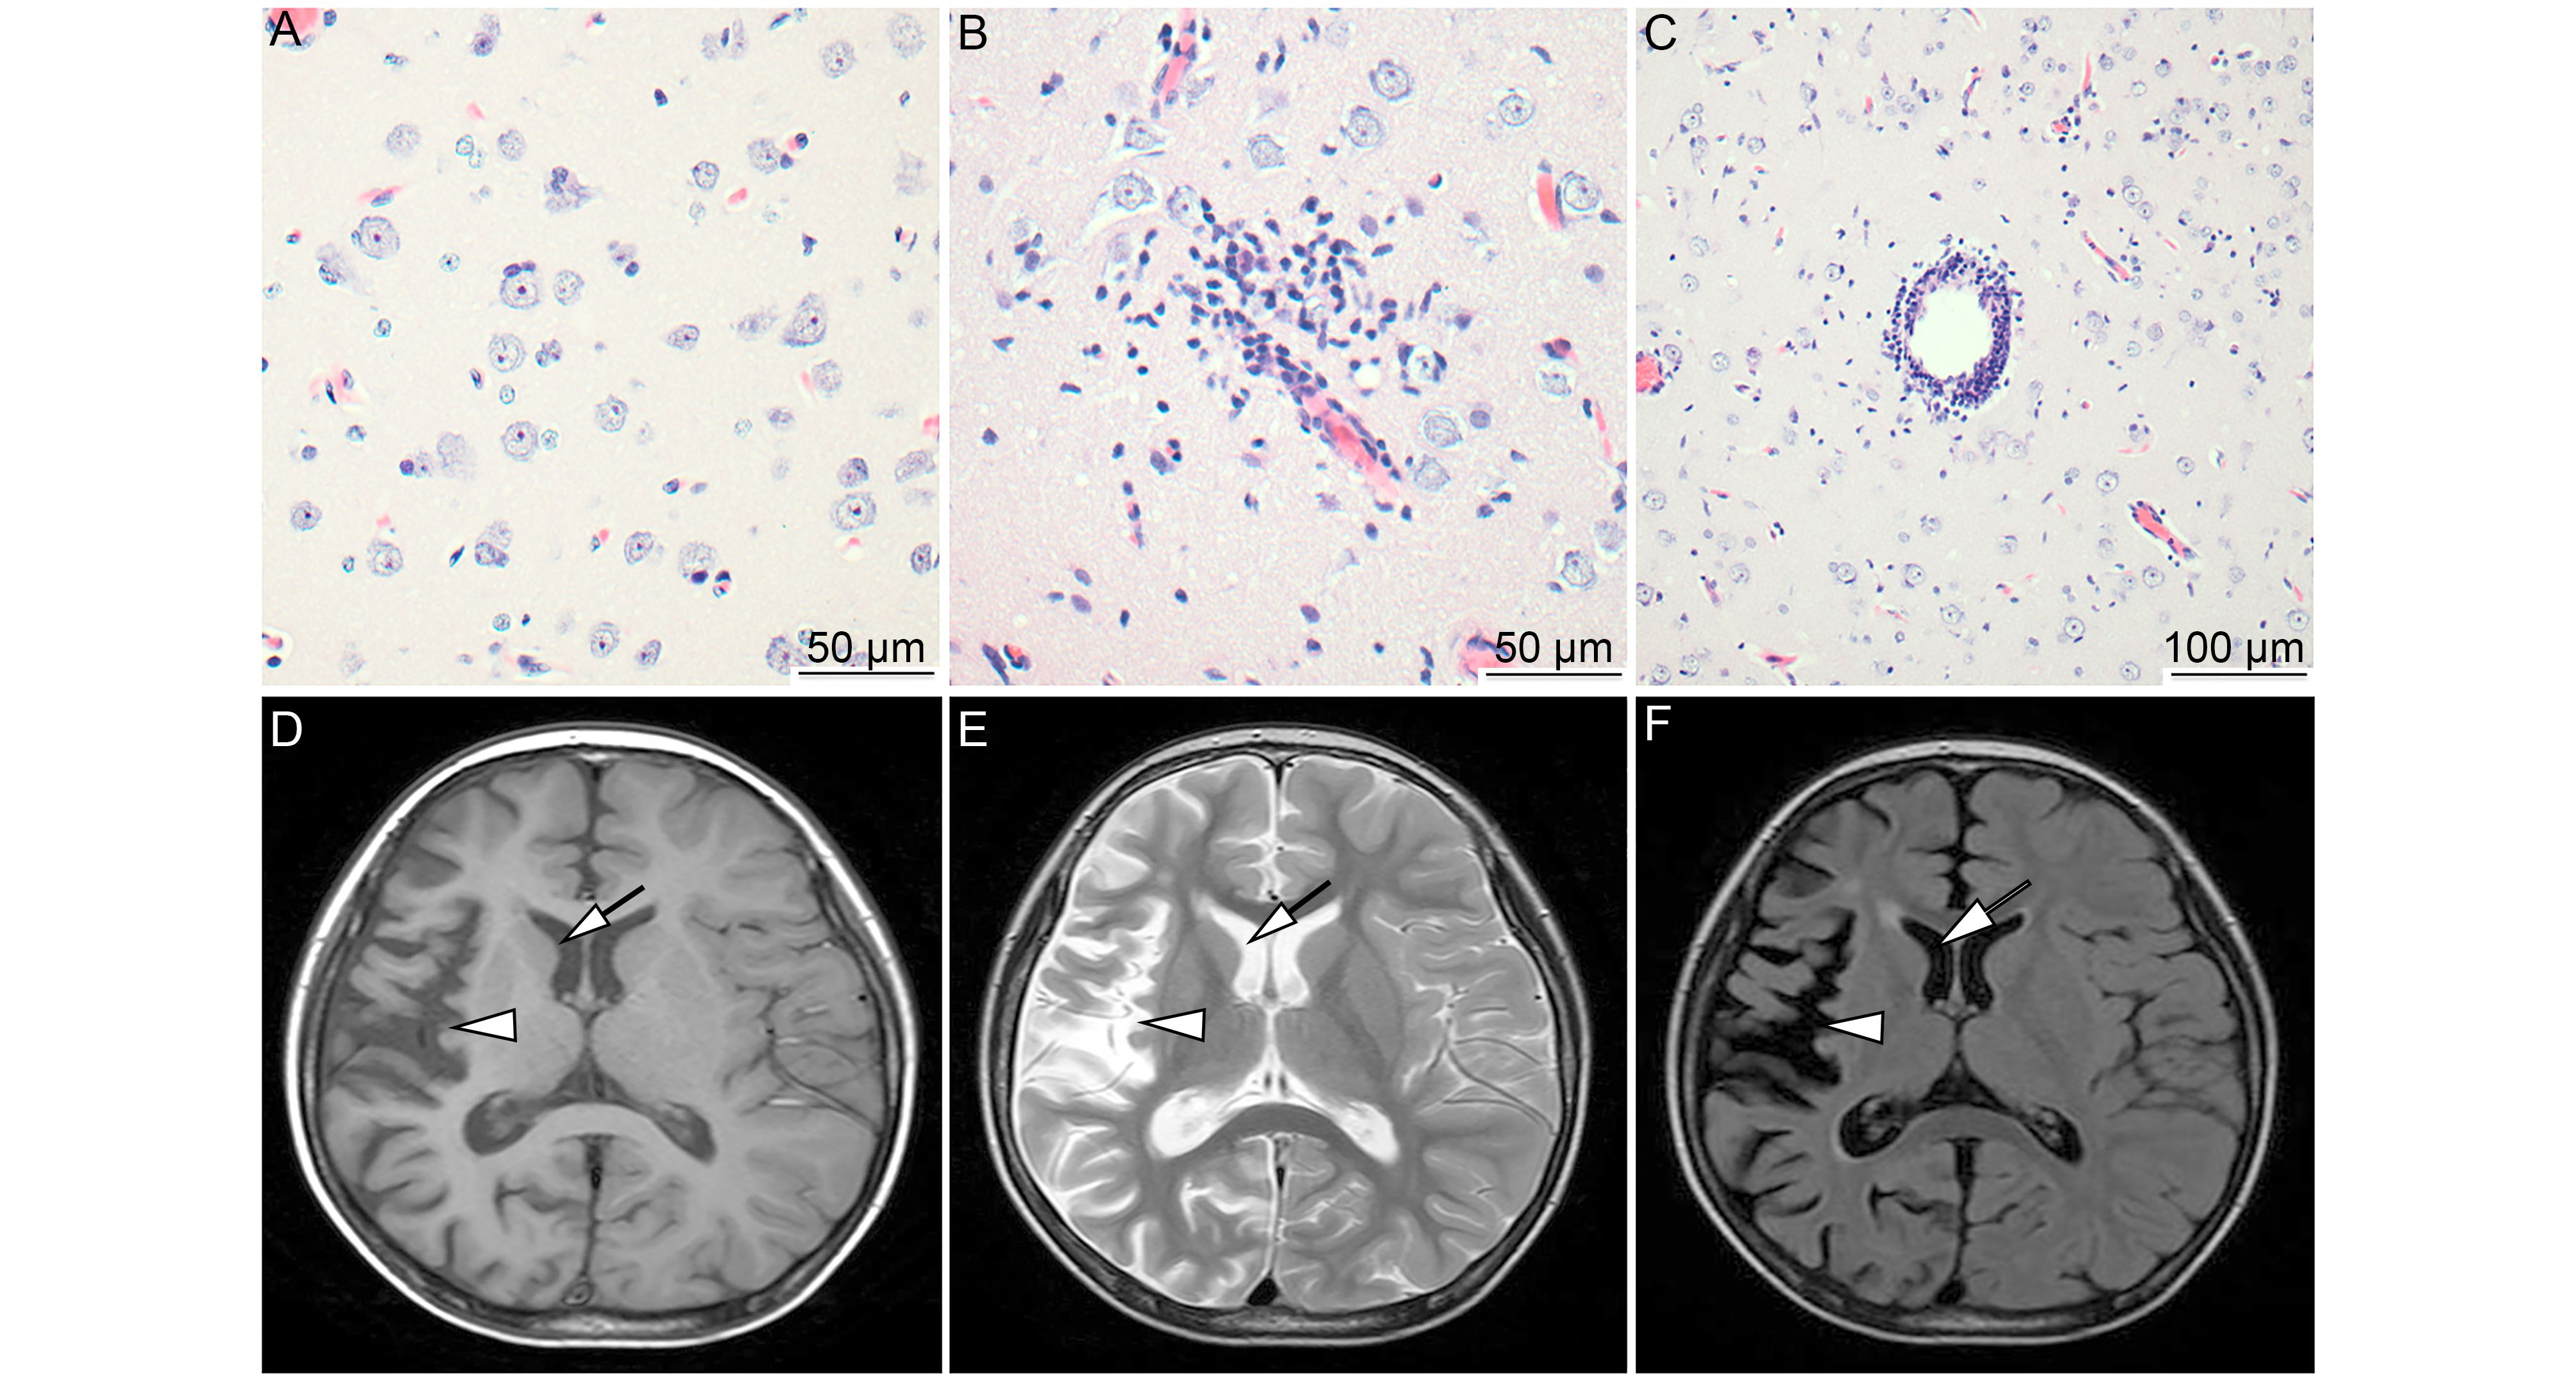
All clinical signs and treatments for patients with RE were described previously (Zhang et al., 2017). In our study, all RE patients were diagnosed according to clinical signs, histopathological changes in brain tissue, and magnetic resonance imaging (MRI) of the brain. All patients showed epilepsia partialis continua (EPC) that did not respond to antiepileptic drugs. According to HE staining, typical pathological characteristics were present in RE brain tissues, such as neuronal loss, neuronophagia (Figure 1A), microglial and lymphocytic nodules (Figure 1B), and perivascular cuffing (Figure 1C). According to MRI, unihemispheric focal cortical atrophy was observed to varying degrees, and most patients (18/26 cases) showed unilateral enlargement of the ventricular system and T2/FLAIR hyperintense signal in cortical or subcortical regions (Figure 1D–1F). These clinical signs, pathological changes, and MRI results support the diagnosis of RE.

Figure 1. MRI characteristics and pathological changes in the brains of RE patients. Typical pathological changes of RE were observed, including neuronophagia (A, scale bar = 50 μm), microglial and lymphocytic nodules (B, scale bar = 50 μm), and perivascular cuffing (C, scale bar = 100 μm). Atrophy of the right hemisphere cortex (arrows) and widening of the sulcus and caudate nucleus (arrowhead) were determined based on T1, T2, and FLAIR with hyperintense signal (D, E, and F). Brain atrophy confined to a single cerebral hemisphere is the most characteristic MRI feature of RE.
-
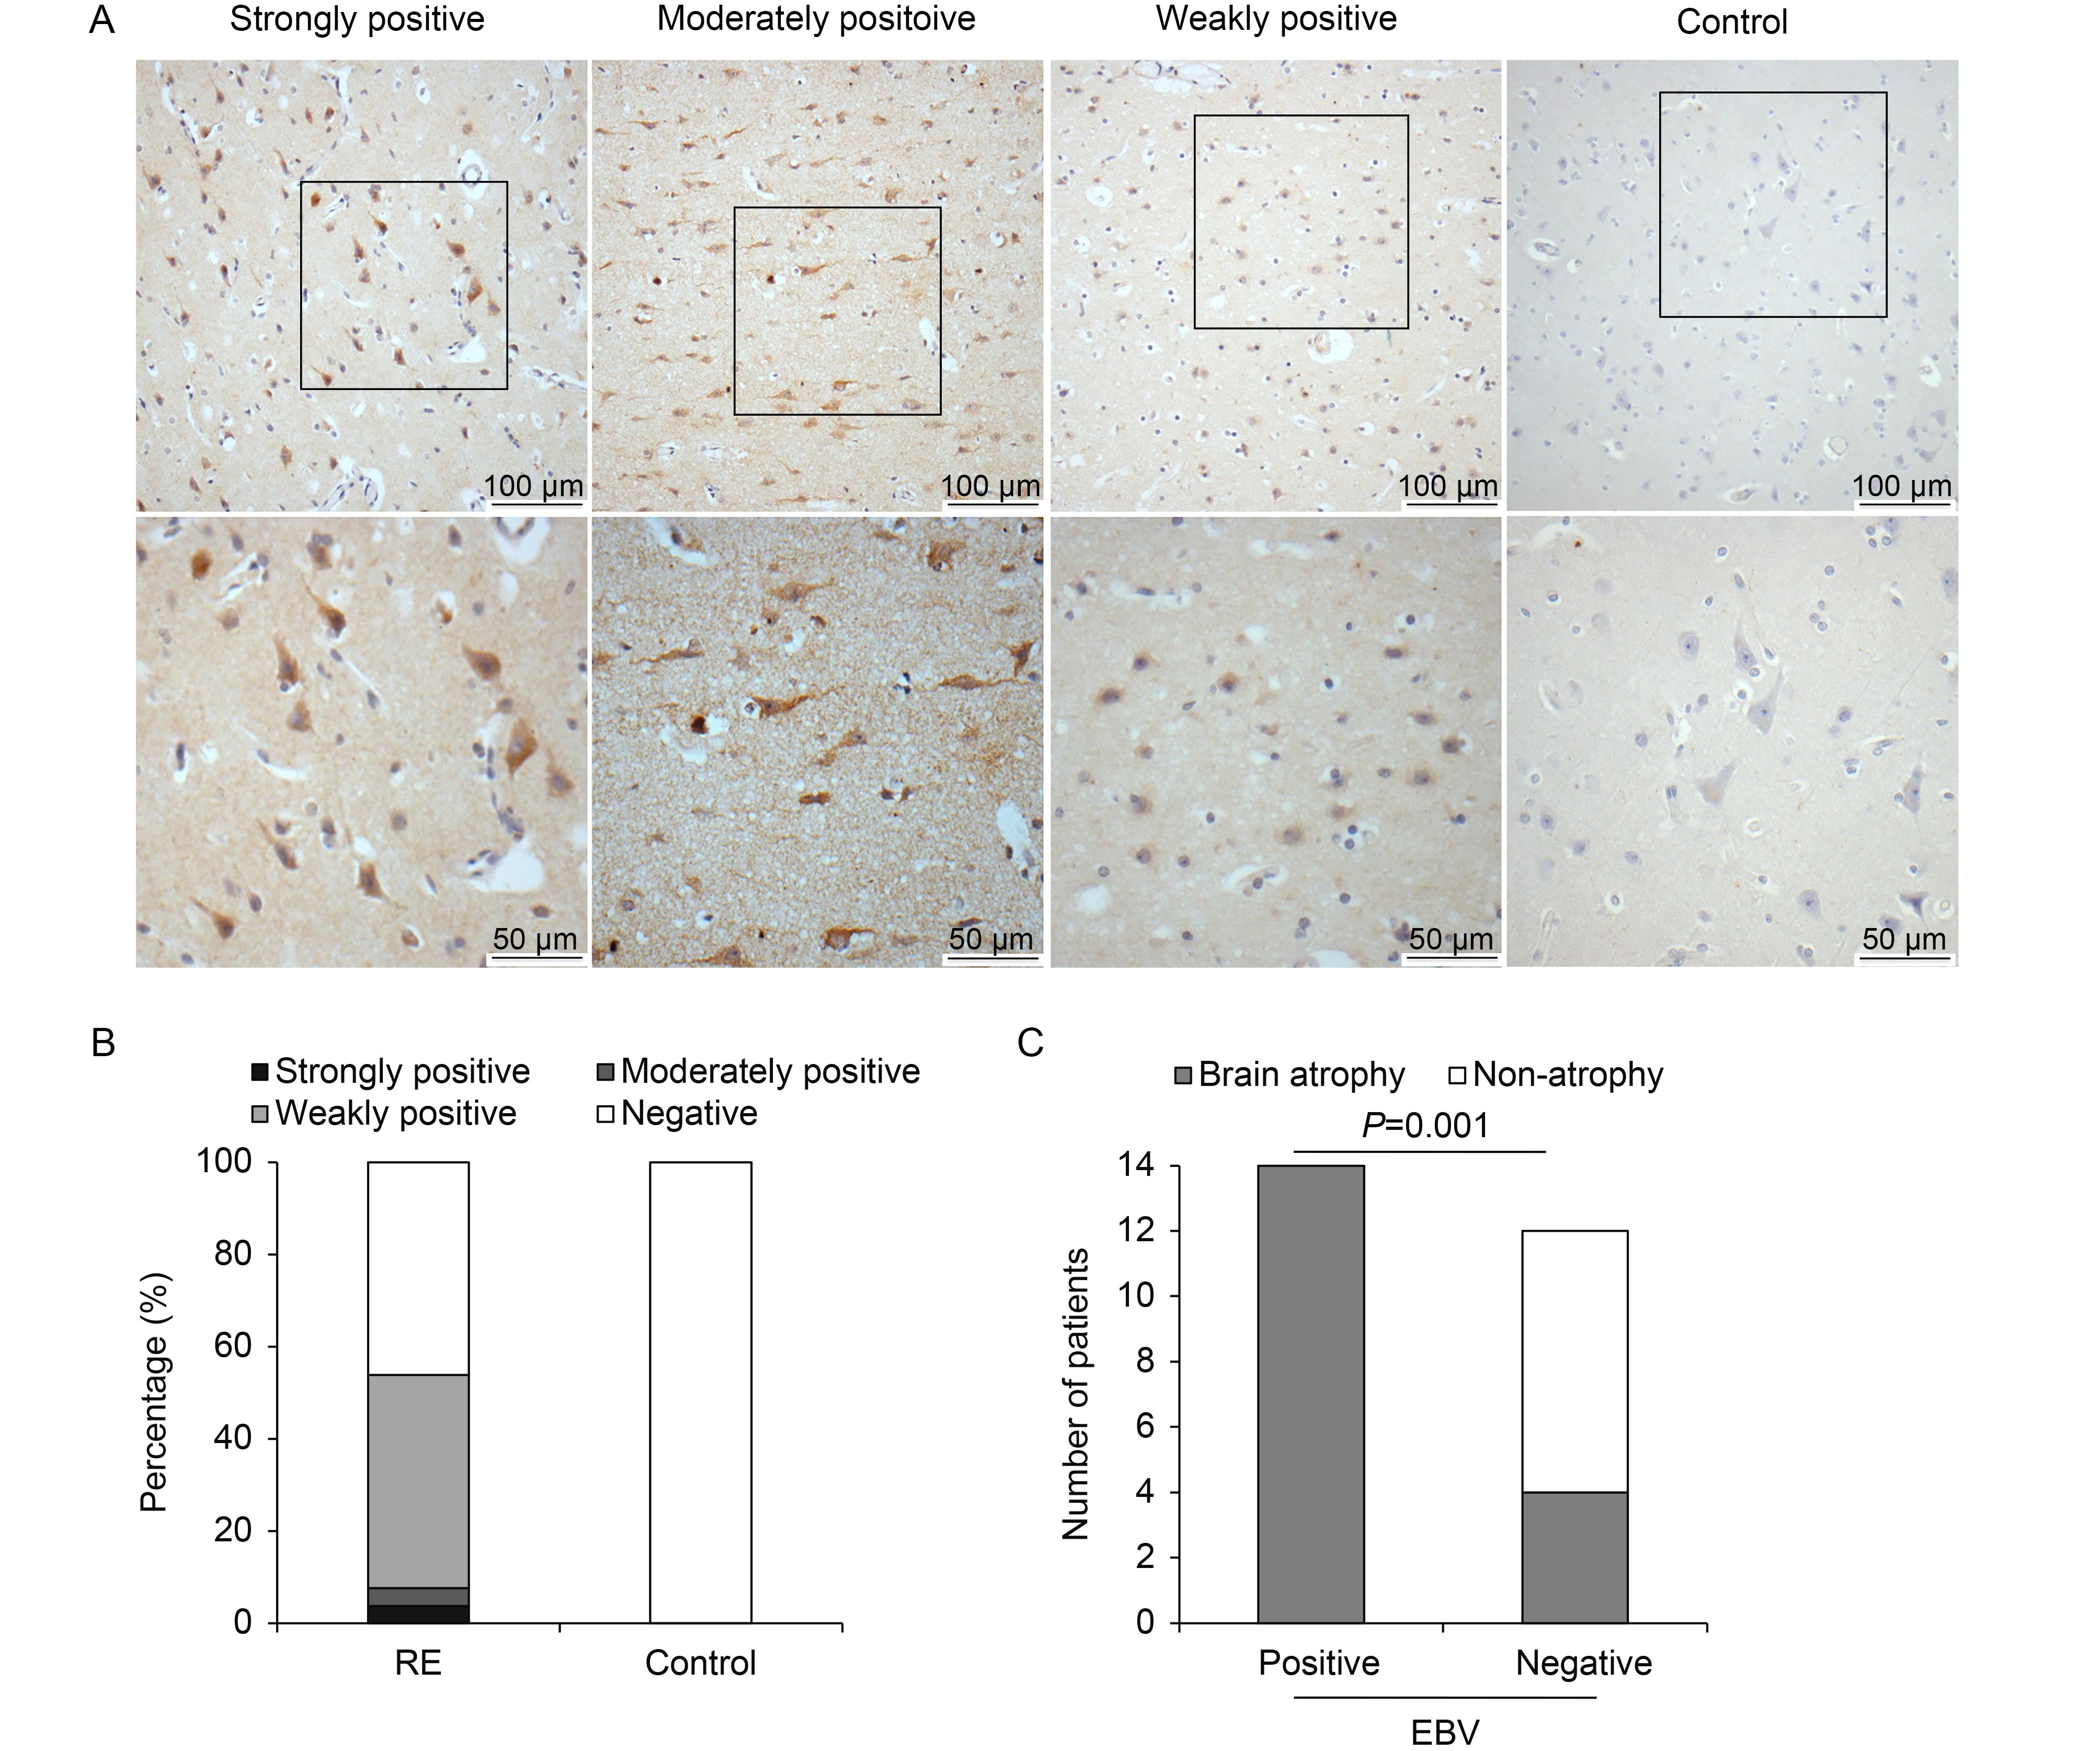
Expression of EBV in the brain tissues of RE patients or controls was analyzed by IHC using an antibody against the latent membrane protein 1 (LMP1) of EBV. The results were evaluated according to a scoring methodology described previously (Allred et al., 1998; Wang et al., 2003). In agreement with the previous report, expression of EBV was significantly higher in the RE group than in the control group, as shown in Table 1 and Figure 2B. Among the 26 RE cases, antigens of EBV were detected in 14 cases (53.8%). Two cases exhibited strong and moderate positive staining, while the other 12 cases showed weakly positive staining. In the control group, all 16 cases were negative for EBV staining. EBV antigen was located in the cytoplasms and nuclei of neuron-like cells in RE lesion areas (Figure 2A), indicating the involvement of EBV in RE.
No. cases (%) Total +++ ++ + RE (n = 26) 1 (3.85) 1 (3.85) 12 (46.15) 14 (53.85) Control (n = 16) 0 (0) 0 (0) 0 (0) 0 (0) Note: +++: Strongly positive; ++: Moderately positive; +: Weakly positive. Table 1. Expression of EBV antigen in brain tissues of RE patients

Figure 2. EBV expression in brain tissues of RE patients and controls. (A) Representative images of strong, moderate, and weak positive staining and negative staining for EBV antigen under low (scale bar = 100 μm) and high (scale bar = 50 μm) magnification. Neuron-like cells were stained. (B) Percentages of RE patients and controls with strong, moderate, weak, or no EBV expression. (C) Analysis of correlation between EBV infection and brain atrophy. Atrophy grade (AG) was scored on a scale from 0 to 3 (Zhang et al., 2017), with higher scores indicating more severe atrophy. All EBV-positive cases showed brain atrophy to varying degrees. In contrast, there were eight cases with an AG score of 0 among 12 EBV-negative cases. EBV infection and brain atrophy were thus significantly associated (P = 0.001).
Next, the correlation between EBV infection and AG was analyzed. In this study, elevated expression of EBV antigen was observed in the RE group, and RE patients with positive EBV staining exhibited more severe brain atrophy (Table 2, Figure 2C) than EBV-negative cases (P < 0.05). This result suggests that EBV infection is associated with RE disease progression.
Brain atrophy Non-atrophy Total EBV-positive cases 14 0 14 EBV-negative cases 4 8 12 Total 18 8 26 Note: Fisher’s exact test: P = 0.001. Table 2. Association between brain atrophy and EBV antigen expression in brain tissues of RE patients
-
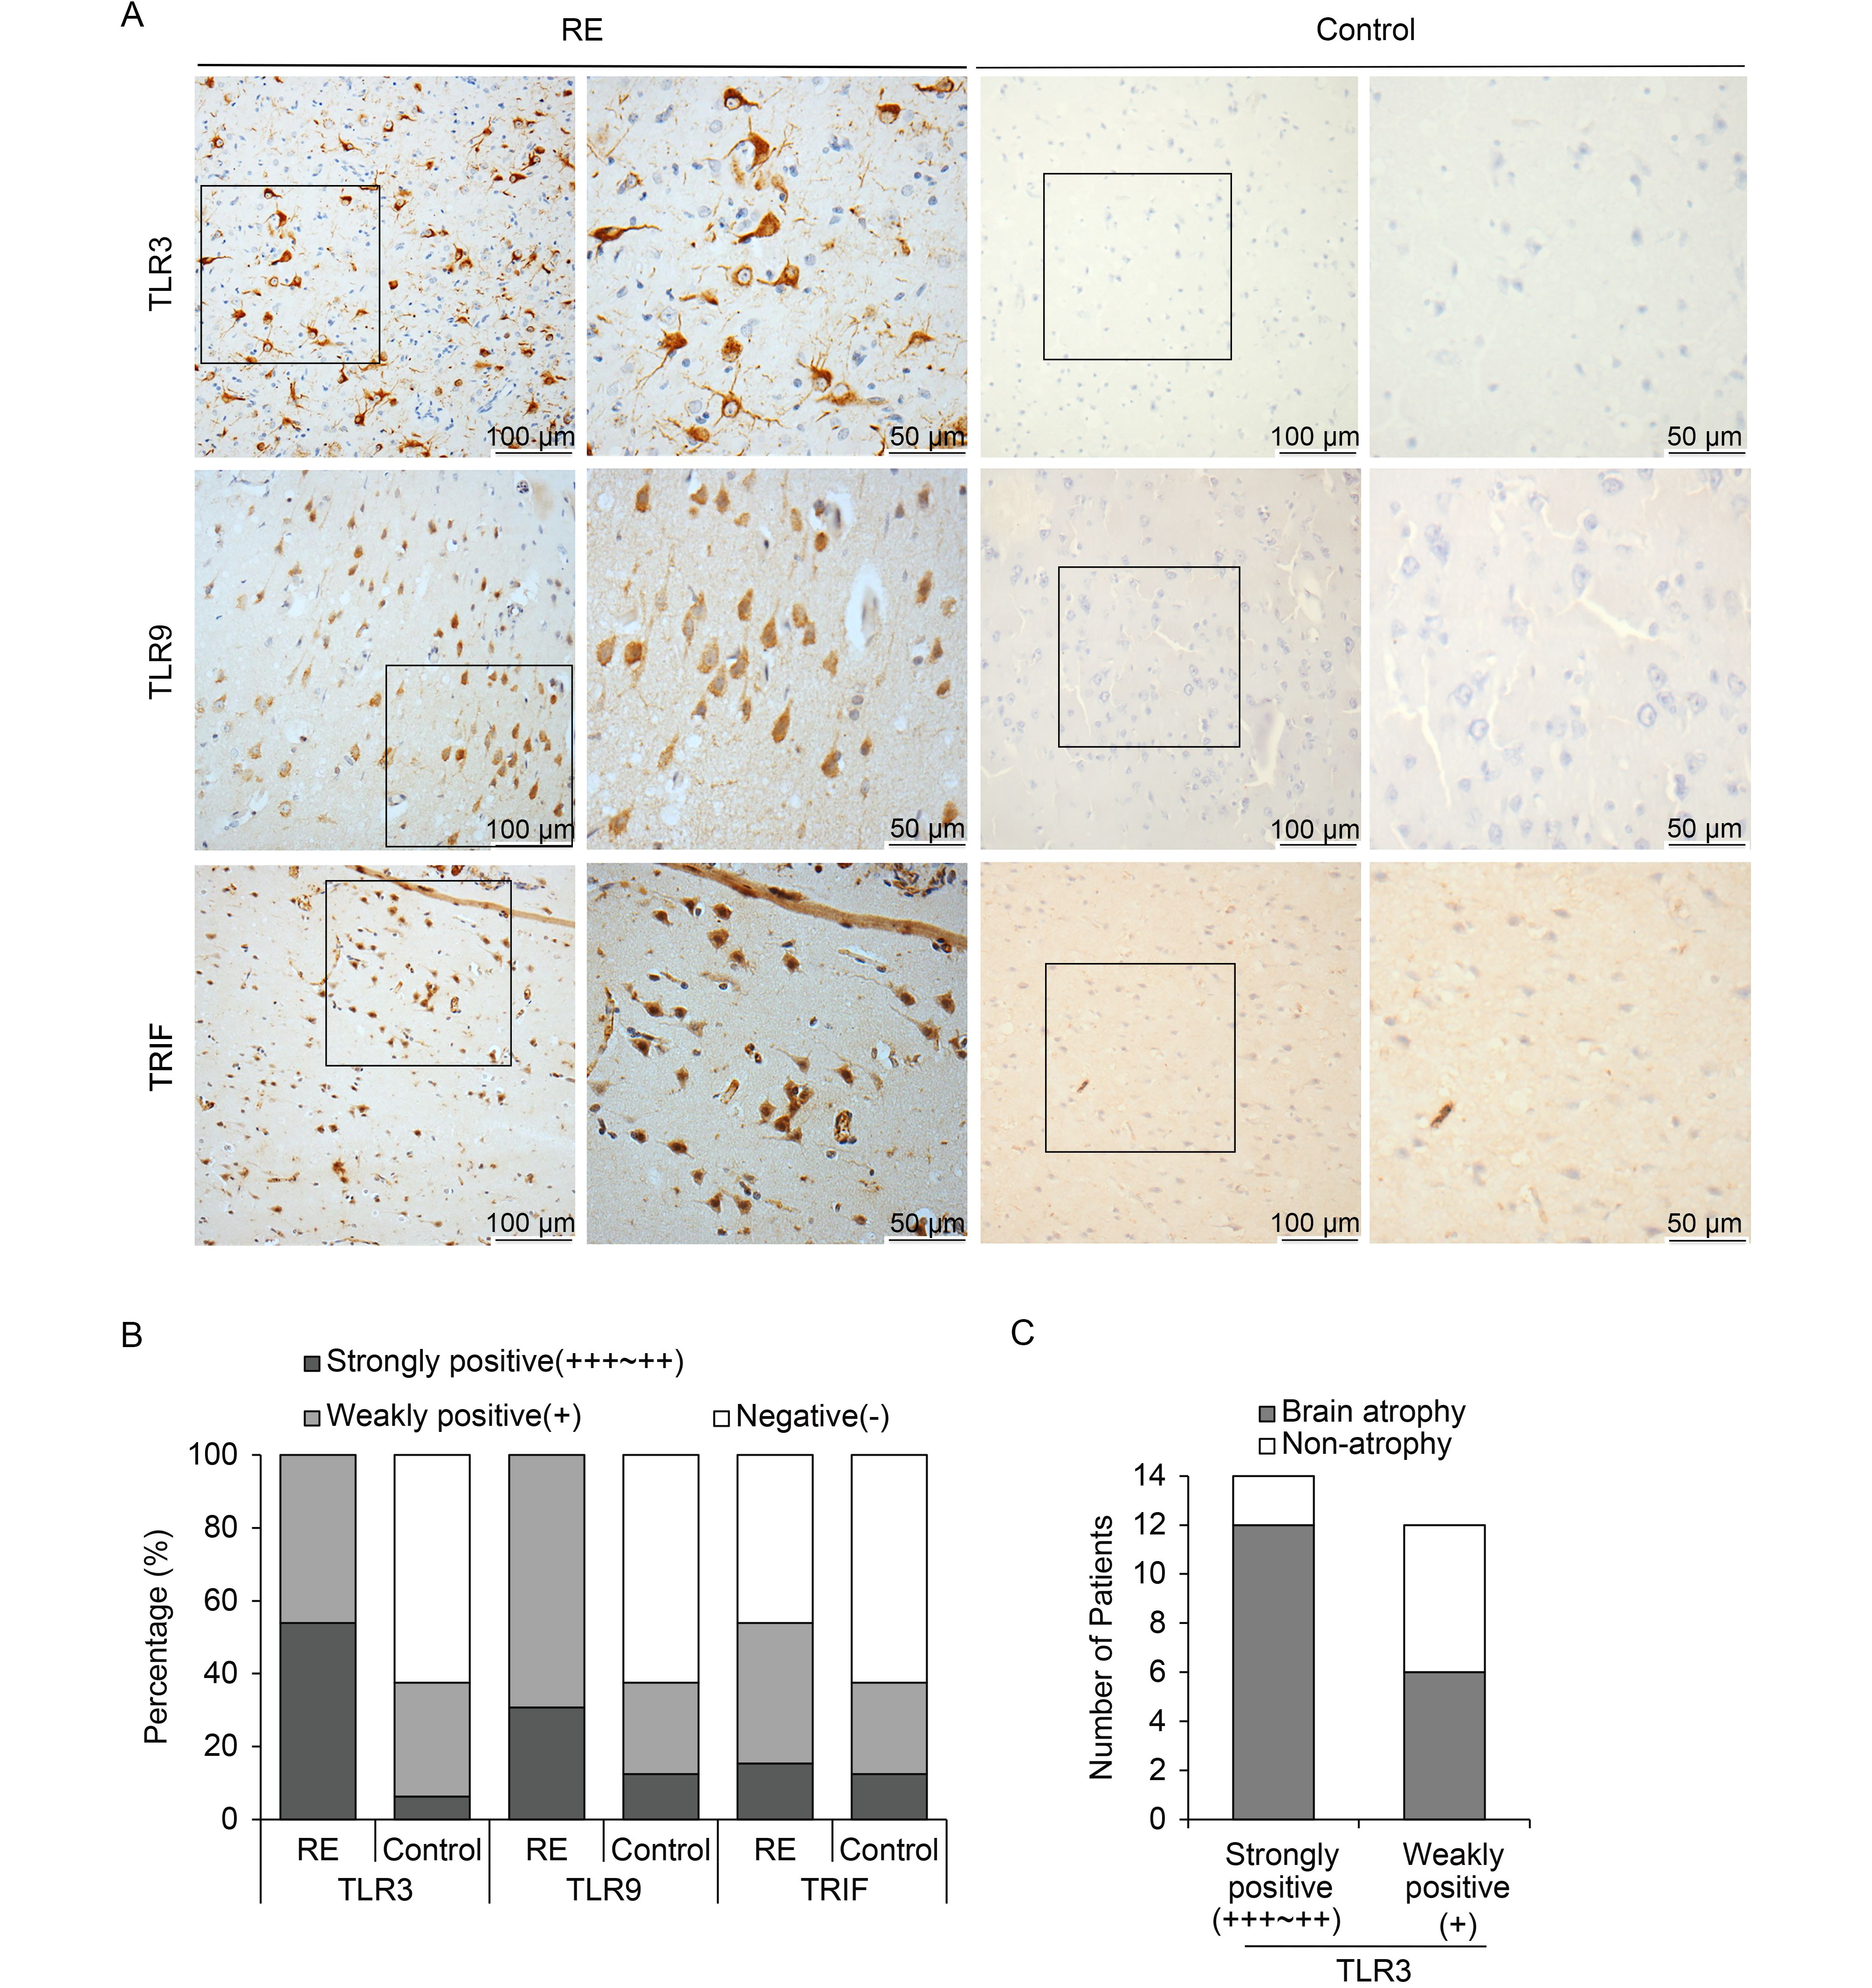
According to IHC, positive staining for both TLR3 and TLR9 was observed in all RE cases (100%), while only six individuals (37.5%) with weakly positive staining were observed in the control group (Table 3). Interestingly, there were different staining intensities for TLR3 and TLR9 among RE brain specimens. For TLR3, strong staining was observed in 14 (23.8%) cases, and the other 12 cases (46.2%) showed weak staining. For TLR9, strong staining was observed in eight cases (30.8%), while the other 18 cases (69.2%) showed weak staining. Accordingly, highly expression of TRIF, a downstream molecule of TLR3, was also detected in the brain tissues of 14 RE patients (53.8%), 15.3% with strong expression and 38.5% with weak expression. In contrast, there were only six individuals (37.5%) weakly positive for TRIF staining in the control group. TLR3 and TLR9 were highly expressed in the cytoplasms of neurons and astrocytes, while TRIF was detected in both the cytoplasms and nuclei of neurons and astrocytes (Figure 3A). The above results indicate that TLR3, TLR9, and TRIF were clearly upregulated in the RE group (Figure 3B).
No. cases (%) Total +++/++ + TLR3 RE 14 (53.85) 12 (46.15) 26 (100) Control 1 (6.25) 5 (31.25) 6 (37.5) TLR9 RE 8 (30.77) 18 (69.23) 26 (100) Control 2 (12.5) 4 (25) 6 (37.5) TRIF RE 4 (15.38) 10 (38.46) 14 (53.85) Control 2 (12.5) 4 (25) 6 (37.5) Note: RE group: n = 26; Control group: n = 16; Strongly positive: +++/++; Weakly positive: +. Table 3. Expression of TLRs in brain tissues of RE patients

Figure 3. TLR3, TLR9, and TRIF expression in brain tissues of RE patients and controls. (A) Representative images of TLR3, TLR9, and TRIF expression in neurons and astrocytes derived from brain tissues of RE patients under low (scale bar = 100 μm) and high (scale bar = 50 μm) magnification. (B) Percentages of RE patients and controls with strong, weak, or no expression of TLR3, TLR9, and TRIF. (C) Analysis of correlation between TLR3 expression and brain atrophy.
Moreover, we analyzed the correlation between TLR3 expression and the AG of the brain (Table 4, Figure 3C). Among the 26 RE patients, 14 RE cases with high expression of TLR3 exhibited clear brain atrophy, with AG scores of 2–3. In addition, among the remaining 12 RE individuals, six cases with weak staining of TLR3 showed no atrophy. The evidence therefore indicates that TLR3 expression is somewhat associated with RE progression.
Brain atrophy cases Non-atrophy cases Total +++/++ 12 2 14 + 6 6 12 Total 18 8 26 Note: Strongly positive: +++/++; Weakly positive: +; Fisher’s exact test: P = 0.090. Table 4. Association between brain atrophy and TLR3 expression levels in brain tissues of RE patients
-
Despite several investigations by researchers, the etiology of RE remains unclear. Viral infection, autoantibodies (Rogers et al., 1994; Wiendl et al., 2001; Mantegazza et al., 2002), and T lymphocyte cytotoxicity (Bauer et al., 2002; Bien et al., 2002) have been considered as main causes of RE but remain controversial. It has been reported that several viral components can be detected in RE brain tissues, suggesting that RE may not be caused by a specific viral infection. Instead, viral infection may act as a key factor triggering an immune response that contributes to RE occurrence and progression.
In this study, we recruited 26 RE cases and 16 non-RE controls and determined the expression levels of all members of the herpes virus family. Among these, only EBV was detected among 53.8% of individuals in the RE group, while no EBV antigens were detected in the control group. Following EBV infection, it has been reported that virus-related neurological disorders, including meningitis, encephalitis, and cranial or peripheral neuritis, are often observed in immunocompetent or immunocompromised patients, indicating the neurotropism of EBV. Thus, EBV was implicated in this study. In addition to the high expression of EBV, clear upregulation of TLR3/TRIF and TLR9 was also observed in the RE group, with significantly higher staining intensities and detection rates compared to those in the control group. Furthermore, TLR3 and TLR9 were highly expressed in the cytoplasms of neurons and astrocytes and TRIF was mostly expressed in the nuclei, indicating activation of the innate immune response. Moreover, in addition to the elevated expression of TLR3 and TLR9, typical pathological features, such as neuron loss and the infiltration of lymphocytes and microglia, were observed in the brain tissues of RE patients, indicating that T lymphocytes were also recruited to recognize and eliminate virus-infected cells. Because the MyD88 pathway is involved in the activation of several TLRs and MyD88 cannot reflect activation of TLR3 and TLR9, we did not analyze the expression of proteins associated with the MyD88 pathway.
The mechanism by which EBV and TLRs are involved in the pathogenesis of RE remains unclear. EBV is a member of the gamma herpes virus family, and it latently infects approximately 90% of human adults. Several studies have reported that EBV infection is closely associated with nervous system disorders (Walter and Renella, 1989; Eeg-Olofsson et al., 2004). As is well known, the TLR3 and TLR9 signaling pathways in the innate immune system are the first line of defense against DNA virus infections. In this study, positive EBV staining was associated with severe brain atrophy, and TLR3 expression levels were also correlated with the degree of brain atrophy in RE patients. Taken together, our results suggest that the TLR3 and TLR9 signaling pathways may play an important role in RE occurrence and progression by recognizing viruses such as EBV and activating both innate and adaptive immune responses. In other words, viral infection may be a trigger for RE by inducing interactions between TLRs and T lymphocytes. Additionally, possible correlations between TLR3/9 and EBV expression were also evaluated in this study. However, there was no significant association between EBV and TLR3 expression, which may reflect our limited number of RE cases. Investigating the correlation between EBV infection and innate immunity, including TLRs, using a greater number of RE cases is ongoing in our laboratory.
In conclusion, elevated expression of EBV antigens, TLR3/TRIF, and TLR9 was detected in the brain tissues of RE patients. We also identified a correlation between EBV/TLR3 expression and the severity of brain atrophy due to RE. Our results suggest the possibility that an interaction between viral infection and immune responses may lead to RE. Further study is required to clarify the causal relationship between viral infection and the immune response in terms of RE occurrence and progression to provide clues for clinical therapy.
-
This work was supported by the following funds: the National Natural Science Foundation of China (81471957, 81571275, 81671971, and 81701992), the Beijing Municipal Natural Science Foundation (7144217), and the Scientific Research Common Program of Beijing Municipal Commission of Education (KM201610025001).
-
The authors declare that they have no conflict of interest. This study was approved by the Ethics Committee of Sanbo Brain Hospital, Capital Medical University (2013061801), and written informed consent was obtained from all participants or their guardians prior to the study.
-
JA, GML and YSW conceived and designed the experiments. XW and DL performed the experiments and analyzed the data. PGW, YGG, TFL and DYF contributed reagents/materials/analysis tools. XW and DL wrote the manuscript and prepared the figures and/or tables. JA and GML revised the manuscript, organized the collaboration and directed the project. All authors read and approved the final manuscript.
Elevated expression of EBV and TLRs in the brain is associated with Rasmussen’s encephalitis
- Received Date: 26 July 2017
- Accepted Date: 30 September 2017
- Published Date: 30 October 2017
Abstract: Rasmussen’s encephalitis (RE) is a rare pediatric neurological disorder, the etiology of which remains unclear. It has been speculated that the immunopathogenesis of RE involves damage to neurons, which eventually leads to the occurrence of RE. Viral infection may be a critical factor in triggering RE immunopathogenesis. In this study, we analyzed the expression of Epstein-Barr virus (EBV) antigens as well as of Toll-like receptor 3 (TLR3), TLR9, and downstream adapter TIRdomain-containing adapter-inducing interferon-β (TRIF) in the brain tissues of 26 patients with RE and 16 control individuals using immunohistochemistry (IHC). In the RE group, EBV antigens were detected in 53% of individuals at various expression levels. In contrast, there was no detectable EBV antigen expression in control brain tissues. Moreover, we found marked increases in the expression of TLR3, TLR9, and TRIF in the brain tissues of RE patients compared with levels in the control group. Furthermore, among RE cases, EBV expression and high TLR3 expression were associated with more severe brain atrophy. Our results suggest that the elevated expression of EBV and TLRs may be involved in RE occurrence through the activation of downstream molecules.


 DownLoad: