


HTML
-
Hepatitis B virus (HBV) persistently infects 250 million people worldwide. Approximately 30% of liver cirrhosis cases and 45% of hepatocellular carcinoma (HCC) cases are attributed to HBV infection (Lozano et al. 2012). In China, about 93 million people suffer from chronic HBV infection, 20 million of whom have developed chronic hepatitis B (CHB) (Lu and Zhuang 2009). However, current antiviral therapies fail to completely cure HBV infection and are unable to control disease progression owing to its complicated pathogenesis (El-Serag 2012; Perz et al. 2006).
Chronic HBV infection was more prevalent in males than in females according to a survey of 1695 fresh students in Taiwan (Su et al. 2007). The serum HBV DNA level was found to be significantly higher in males than in females after ruling out other confounding factors and was shown to be an independent risk factor for disease progression (Chen et al. 2009; Yu et al. 2005; Tang et al. 2004). Response to HBV stimulation also differed between sex. In addition, the incidence of HBV-related HCC was 5–7 times higher in males than in females. HCC cases with higher serum viral loads tended to have a worse prognosis, including risk for death, metastasis, and recurrence (Chen et al. 2009, Lee et al. 1999). Furthermore, the sex disparity in the serum HBV DNA level was also demonstrated in HBV transgenic animal models (Farza et al. 1987; DeLoia et al. 1989; Wang et al. 2015). The sex differences in the response to HBV stimulation, including initiation and progression of HBV-related liver diseases, might be attributed to sex hormones, gender habits, and environmental influence (Wang et al. 2015). To appropriately treat CHB, the molecular mechanisms of the sex disparity in the response to CHB must be clarified.
DNA methylation is closely related to HBV susceptibility, occurrence of HBV-related cirrhosis, and hepatocarcinogenesis (Hoan et al. 2017; Feng et al. 2017; Park et al. 2007; Li et al. 2005) and is also associated with interferon antiviral activity (Chen et al. 2017; Lim et al. 2018). DNA methylation at either the promoter region or gene body plays critical roles in gene expression (Lou et al. 2014). Single nucleotide polymorphisms (SNPs) also affect transcriptional activity and may remove or induce DNA methylation (Zhang et al. 2017; Rohde et al. 2017; Moser et al. 2009), and certain methylated sites may serve as hot spots for mutations (Jones et al. 1992). Therefore, DNA methylation, SNP genotype, and gene expression are closely related.
This study was conducted to explore the mechanisms of sex differences in the response to CHB based on alterations in genomic DNA methylation, SNP genotypes, and gene expression as well as their interaction.
-
Seven hundred and seventeen males and 207 females with CHB, and 18 male and 11 female healthy controls (HCs), were recruited to assess the clinical differences between males and females with CHB. Genomic DNA was isolated from peripheral blood mononuclear cells (PBMCs) of 11 male and four female CHB patients as well as four male and two female HCs for genome-wide DNA methylation profiling. Then, 96 male and 45 female CHB patients and 18 male and 11 female HCs were enrolled for DNA methylation confirmation. In addition, 111 male and 45 female CHB patients and 18 male and 11 female HCs were recruited for SNP genotyping and gene expression detection. All CHB patients and HCs were recruited from Shuguang Hospital, which is affiliated to Shanghai University of Traditional Chinese Medicine. CHB was diagnosed according to the Guidelines for the Prevention and Treatment of Chronic Hepatitis B (Chinese Society of Hepatology and Chinese Society of Infectious Diseases CMA 2005). CHB patients who were diagnosed with other liver diseases, such as hepatitis C; fatty liver; autoimmune diseases; decompensated liver cirrhosis; severe primary diseases in the cardiovascular, pulmonary, and renal systems; and mental diseases and women who were pregnant or breastfeeding were excluded. The study was conducted in accordance with the protocol approved by Shuguang Hospital and the ethics principles of the Declaration of Helsinki. Written informed consent was obtained from all enrolled participants. Fasting peripheral venous blood was collected from each participant. Serum and PBMCs were immediately separated via centrifugation at 3000 rpm for 15 min and were promptly frozen at -80 ℃.
-
Genome-wide DNA methylation was predominantly detected by Shanghai OE Biotech. Co., Ltd (Shanghai, China) using the Illumina Infinium Human Methylation 450K Assay as previously described (Hu et al. 2016). Genomic DNA was first isolated from PBMCs using QIAamp DNA and Blood Mini Kits (QIAGEN, Hilden, Germany) and then bisulfite-converted using the Zymo EZ DNA Methylation Kit (Zymo Research, Irvine, CA, USA) according to the instruction manuals. Bisulfite-converted DNA was isothermally amplified and enzymatically fragmented, followed by purification and hybridization on the Infinium 450K array (Illumina, San Diego, CA, USA). The protocol included two bead types (Signal A for unmethylated alleles and Signal B for methylated alleles) for each CpG locus with the dual-color channel approach. The assay covered about 485, 577 CpG loci in total. Microarray data were extracted, and the DNA methylation level was calculated using GenomeStudio® Methylation Module v1.8 software (Version 2011.1, Illumina). Data were normalized by subtracting the background value, which was determined by averaging the signals of built-in negative control bead types. The DNA methylation level of each interrogated CpG locus was determined by the β value through the following formula:
The β value ranged from 0 to 1. Zero indicated complete demethylation, and 1 indicated full methylation.
-
DNA was first bisulfite-converted using the EpiTect Fast DNA Bisulfite Kit (QIAGEN) and then amplified by polymerase chain reaction (PCR) using the PyroMark PCR Kit (QIAGEN) in a total reaction volume of 25 μL, which contained 50 ng DNA. Primers for PCR were TATG GAGGGATTTTAGGTAGGTTATA (forward) and AAC CTCCCATTCAATAATACATTCTATTC (reverse). After purification, 20 μL PCR product was pyrosequenced using the PyroMark Gold Q96 Kit (QIAGEN) and PyroMark Gold Q96 pyrosequencer (QIAGEN) according to the manufacturer's instructions. Data were collected and analyzed using the PyroMark Q96 software (Version 2.5.8, QIAGEN).
-
SNPs (rs2529876) were genotyped using the SNaPshotTM Multiplex Kit (Applied Biosystems, Foster City, CA, USA) and primers (forward: ACCTCCCATTCAGTGGTACAT TCTG, reverse: CGTCTTCATATAGCCCTCCGTCTA) as previously reported (Lim et al. 2006).
-
The K562 cell line was purchased from American Type Culture Collection (ATCC® CCL-243TM, Manassas, VA, USA) and maintained in Iscove's Modified Dulbecco's Medium (IMDM) (Gibco, Carlsbad, CA, USA) supplemented with 10% heat-inactivated fetal bovine serum (FBS) (Gibco, Auckland, NZ) and 1% penicillin–streptomycin solution (Gibco). K562 cells were incubated in a humidified atmosphere containing 5% CO2 at 37 ℃, and the medium was replenished every 2 days.
-
5-Aza was purchased from Sigma-Aldrich (St. Louis, MO, USA) and prepared by dissolving in dimethyl sulfoxide (DMSO) (Sinopharm, Shanghai, China) at 20 mmol/L to generate the stock solution, which was stored at -80 ℃. K562 cells were seeded in 96-well plates (2000 cells/well) and incubated with 5-Aza at graded concentrations. As 5-Aza is easily inactivated in culture medium, fresh 5-Aza was added every 24 h without changing the medium (Ando et al. 2000). The same volume of complete medium without 5-Aza was added to the control group. Each group was prepared in quadruplicate, and three independent experiments were performed. Then, total RNA from K562 cells was isolated for RT-qPCR.
-
Total mRNA was isolated from PBMCs or K562 cells and reverse transcribed to cDNA using the RNAsimple Total RNA Kit (TIANGEN, Beijing, China) and ReverTra Ace qPCR RT Kit (TOYOBO, Osaka, Japan), respectively. Then, RT-qPCR of VCX with the primers GGAGGCAG GAAAGAGGAAGT (forward) and CGTCTCCCTCTACGAACTGC (reverse) was performed using SYBR® Green Realtime PCR Master Mix (TOYOBO) as described in the manual. PCR was carried out for 40 cycles (95 ℃ for 60 s, 95 ℃ for 15 s, and 60 ℃ for 60 s). Each sample was run in triplicate. The mRNA level was normalized to GAPDH expression and calculated based on the 2-ΔΔCt method (Livak and Schmittgen 2001).
-
Plasma total protein was first quantified using a bicinchoninic acid (BCA) protein assay kit (Biotechwell, Shanghai, China), and 25 μg total protein was separated by 10% sodium dodecyl sulfate polyacrylamide gel electrophoresis (SDS-PAGE). Then, proteins in the gel were transferred onto a polyvinylidene fluoride (PVDF) membrane (Merck Millipore, KGaA, Darmstadt, Germany). Rabbit anti-VCX polyclonal antibody (1:500, Abcam, Cambridge, UK) or rabbit anti-GAPDH monoclonal antibody (1:1000, MiaoTong, Shanghai, China) was used as the primary antibody. Horseradish peroxidase (HRP)-conjugated goat anti-rabbit IgG (H + L) (1:1000, MultiSciences, Hangzhou, China) was used as the secondary antibody. Protein bands were visualized using the Omni-ECLTM Femto Light Chemiluminescence Kit (EpiZyme Scientific, Shanghai, China), and densitometry was performed with ImageJ (www.imagej.net).
-
Statistical differences in continuous variables between two groups were compared by a t test or non-parametric test (Mann–Whitney U test) using SPSS Modeler (Version 14.1, IBM, Armonk, NY, USA). Chi square analysis or Fisher's exact test was used for categorical variables. A value of P < 0.05 was considered to indicate statistically significant differences. For genome-wide DNA methylation analysis, differentially methylated (DM) CpG loci were determined only when the methylation level was significantly different (P < 0.05) and the absolute value of the difference between two groups (|Δβ value|) was over 0.17.
Partial least squares discriminant analysis (PLS-DA) was performed using R software. Figures displaying the general chromosomal distribution of DM loci and β values between CHB patients and HCs were constructed using the Quantsmooth R package. The networks of biological processes were constructed using Cytoscape with the ClueGo package (Version 3.1.0, Seattle, WA, USA). Only terms with P < 0.05 were considered significantly enriched. SNP genotypes were analyzed using SNPStats (https://www.snpstats.net).
Participants
Genome-wide DNA Methylation Analysis
Pyrosequencing
SNP Genotyping
Cell Culture
5-Aza-2′-deoxycytidine (5-Aza) Treatment of K562
Reverse Transcription-quantitative PCR (RT-qPCR)
Western Blot
Statistical Analysis
-
Baseline age and sex data were matched between the CHB patients and HCs. HBV was more active in females than in males, as HBV DNA and HBeAg levels were higher in females (P < 0.001). However, males exhibited worse liver dysfunction, as indicated by higher serum concentrations of alanine aminotransferase (ALT), aspartate transaminase (AST), gamma-glutamyltransferase (GGT), and albumin (ALB) (P < 0.05). The AST-to-ALT ratio (AAR), S index (1000 × GGT (IU/L)/[platelet(109/L × ALB2(g/L)]), and GGT-to-platelet ratio (GPRI) have been suggested as inexpensive and readily available methods to assess the degree of liver fibrosis in CHB patients (Bonacini et al. 1997; Zhou et al. 2010; Zeng et al. 2015). The GPRI score was positively correlated with the liver stiffness measurement (LSM) value (r = 0.513, P < 0.001) and closely related to the histopathological score (r = 0.372, P < 0.001). GPRI has good diagnostic accuracy and is a robust serum prediction model for liver fibrosis in CHB patients (Zeng et al. 2015). In the present study, male CHB patients had a higher S index and GPRI scores than did female CHB patients (P < 0.001), suggesting that liver fibrosis was more extensive in male CHB patients. Interestingly, the clinical parameters mentioned above were not significantly different between male and female HCs (P > 0.05) (Table 1).
Index Male HCs Female HCs Male CHBs Female CHBs Case number 18 11 717 207 Age (year) 34.27 ± 11.14 41.15 ± 11.62 35.95 ± 10.24 35.50 ± 11.64 ALT (U/L) 20.47 ± 5.49 21.20 ± 12.31 76.72 ± 103.74 52.38 ± 69.17** AST (U/L) 20.88 ± 5.57 21.20 ± 7.98 53.91 ± 59.47 46.24 ± 43.02* GGT (U/L) 20.59 ± 4.50 23.40 ± 14.71 59.51 ± 73.49 30.58 ± 40.05** ALB (g/L) 43.63 ± 4.06 44.00 ± 6.54 45.42 ± 3.95 44.32 ± 4.49** Uric acid (μmol/L) 328.88 ± 52.21 277.80 ± 40.77* 304.62 ± 76.94 237.76 ± 52.08** Bile acid (μmol/L) 8.41 ± 2.12 6.80 ± 1.23 13.83 ± 23.16 7.29 ± 9.80 PT (s) 12.76 ± 0.96 12.44 ± 0.52 12.96 ± 2.00 12.66 ± 1.33 CD3 + (%) 72.85 ± 5.88 69.14 ± 8.71 70.11 ± 9.20 69.87 ± 9.05 CD4 + (%) 36.12 ± 6.28 32.52 ± 8.80 35.40 ± 8.69 38.24 ± 8.30 CD8 + (%) 36.32 ± 8.22 38.00 ± 11.45 27.41 ± 7.69 26.22 ± 5.98 Lymphocyte (× 109/L) 1.79 ± 0.41 1.72 ± 0.37 1.839 ± 0.663 1.79 ± 0.57 IgA(g/L) 2.16 ± 0.90 2.42 ± 0.95 3.45 ± 1.59 3.40 ± 0.95 IgM (g/L) 1.26 ± 0.47 1.96 ± 0.91* 1.68 ± 0.80* 2.12 ± 1.09 IgG (g/L) 11.99 ± 2.61 14.24 ± 2.53 17.49 ± 4.42 18.01 ± 4.21 AAR 1.06 ± 0.28 1.19 ± 0.57 0.91 ± 0.41 1.08 ± 0.41** S index 0.03 ± 0.01 0.04 ± 0.02 0.14 ± 0.22 0.06 ± 0.10** GPRI 0.11 ± 0.04 0.14 ± 0.09 0.46 ± 0.68 0.20 ± 0.32** HBsAg (IU/mL) 0.00 ± 0.01 0.01 ± 0.01 237.75 ± 100.67 232.64 ± 57.74 HBeAg (PEIU/mL) – – 275.35 ± 444.71 423.44 ± 516.1** HBeAb (1S/CO) – – 12.54 ± 18.00 19.09 ± 20.43** HBcAb (1S/CO) – – 20.99 ± 300.97 9.17 ± 2.83* HbcAb-IgM(1S/CO) – – 0.54 ± 2.27 0.31 ± 0.46* HBV-DNA (copies/mL) – – 2.13 × 10⁷ ± 1.89 × 10⁸ 2.3 × 10⁷ ± 6.35 × 10⁷** ALT alanine aminotransferase, AST aspartate aminotransferase, GGT Glutamyl transpeptidase, ALB albumin, PT prothrombin time, IgA Immunoglobulin A, IgM Immunoglobulin M, IgG Immunoglobulin G, AAR AST-to-ALT ratio, GRPI GGT-to-platelet ratio.
Data was shown as Mean ± SD.
*P < 0.05: male HCs vs female HCs or male CHBs vs female CHBs.
**P < 0.001: male HCs vs female HCs or male CHBs vs female CHBs.Table 1. Clinical parameters of CHB patients and HCs.
-
Genome-wide DNA methylation detection revealed 5529 and 4984 DM loci between male and female CHB patients and male and female HCs, respectively (|Δβ value| > 0.17 and P < 0.05). The top 25% of DM loci among these four groups were analyzed with PLS-DA, demonstrating that males and females, both CHB patients and HCs, were clearly separated (Fig. 1A). In total, 229 DM CpG loci (160 hypomethylated loci and 69 hypermethylated loci) in 127 genes were observed between male CHB patients and male HCs, and 254 DM loci (91 hypomethylated loci and 163 hypermethylated loci) in 142 genes were observed between female CHB patients and female HCs (Supplementary Table S1, S2). These results suggested that male CHB patients tended to exhibit more DNA hypomethylation, while female CHB patients were more susceptible to DNA hypermethylation (Fig. 1A). DM loci between male CHB patients and male HCs were predominantly located in the gene body (39%), followed by the intergenic region (IG, 34%) and promoter (including TSS 1500, TSS 200, 5′UTR, and 1st Exon; 23%). In contrast, DM loci between female CHB patients and female HCs were mainly distributed at the promoter (33%), IG (30%), and gene body (34%). About half of those DM loci were located in nonCpG islands (male CHB patients: 52%, female CHB patients: 47%), followed by CpG islands (male CHB patients: 18%, female CHB patients: 23%) (Fig. 1B, 1C). The genomic distribution of DM loci between sex was not statistically different (P > 0.05).
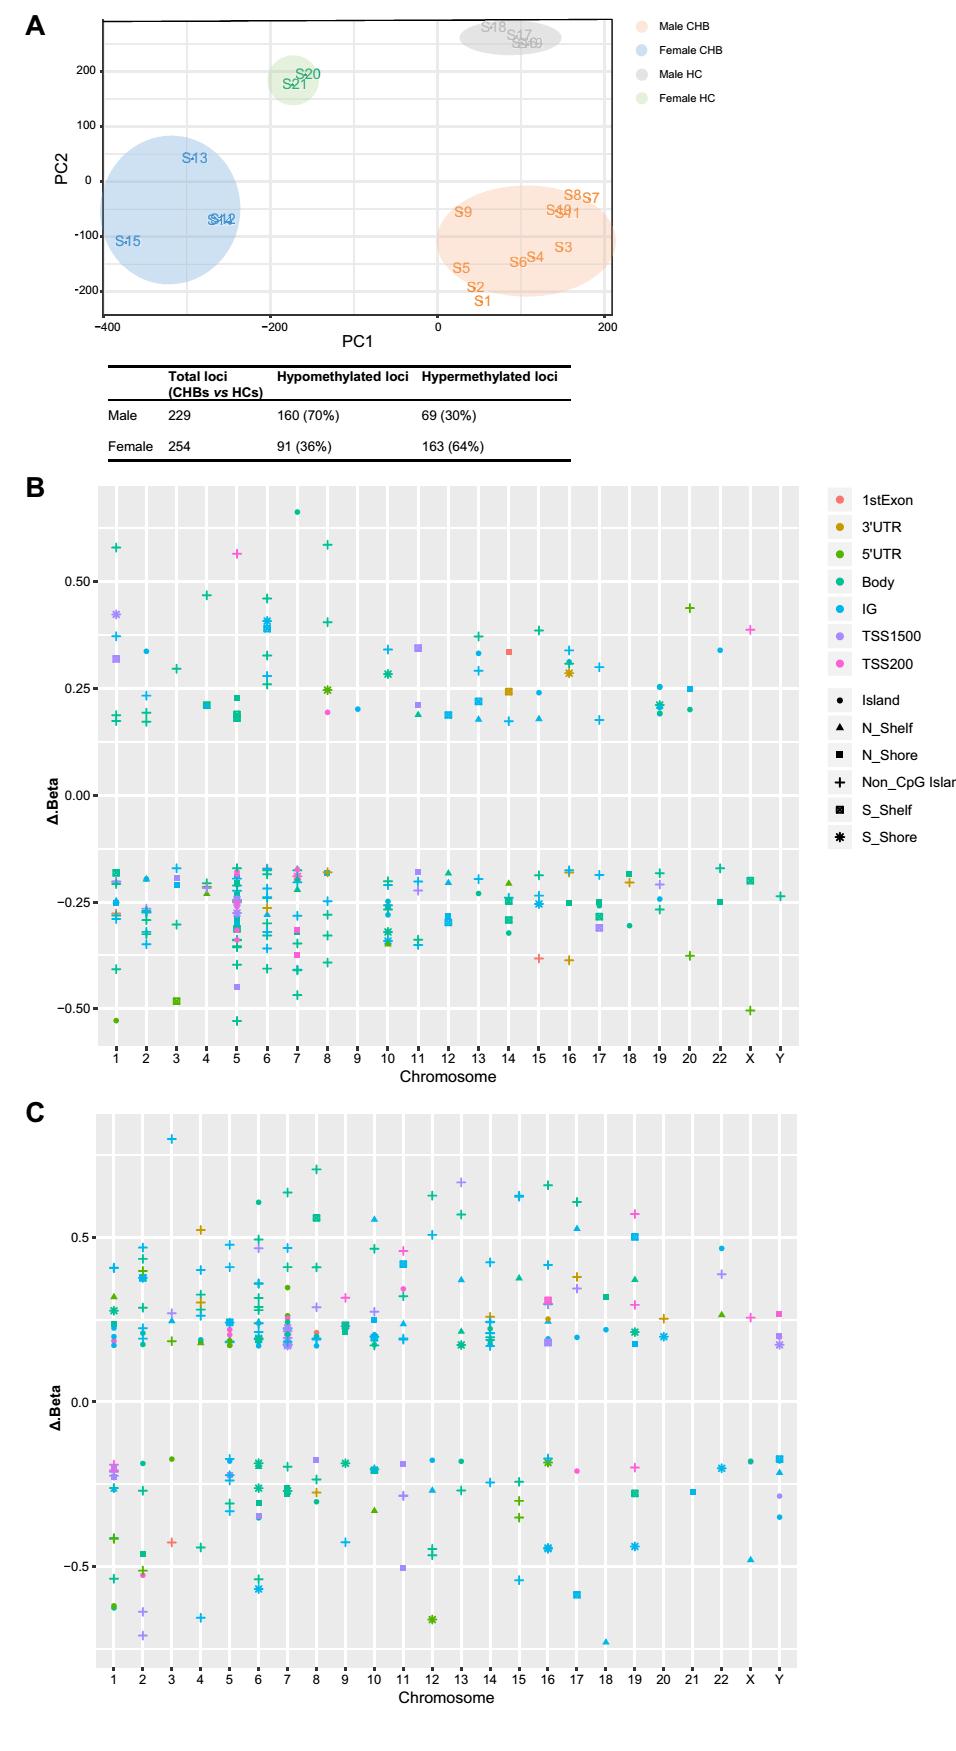
Figure 1. Genomic DNA methylation profiles of male and female CHB patients and HCs. A PLS-DA analysis of the top 25% DM loci among the 4 groups. B Distribution of DM loci between males with CHB and male HCs in relation to chromosome, CpG island, and gene region. C Distribution of DM loci between females with CHB and female HCs in relation to chromosome, CpG island, and gene region. Δβ value refers to the DNA methylation level of male/female CHB patients minus that of male/female HCs.
-
Venn diagram analysis identified 111 male CHB patientspecific and 126 female CHB patient-specific DM genes (Fig. 2A). The male CHB patient-specific DM genes were mainly enriched in the biological processes of brain development, such as cerebellar granular layer development, cell differentiation in hindbrain, and cerebellar cortex formation. On the other hand, female CHB patientspecific DM genes were primarily enriched in immunerelated processes, including intestinal immune network for IgA production, asthma, allograft rejection, and graft-versus-host disease (P < 0.05). Furthermore, the biological process terms were shown to closely interact (Fig. 2B, 2C).
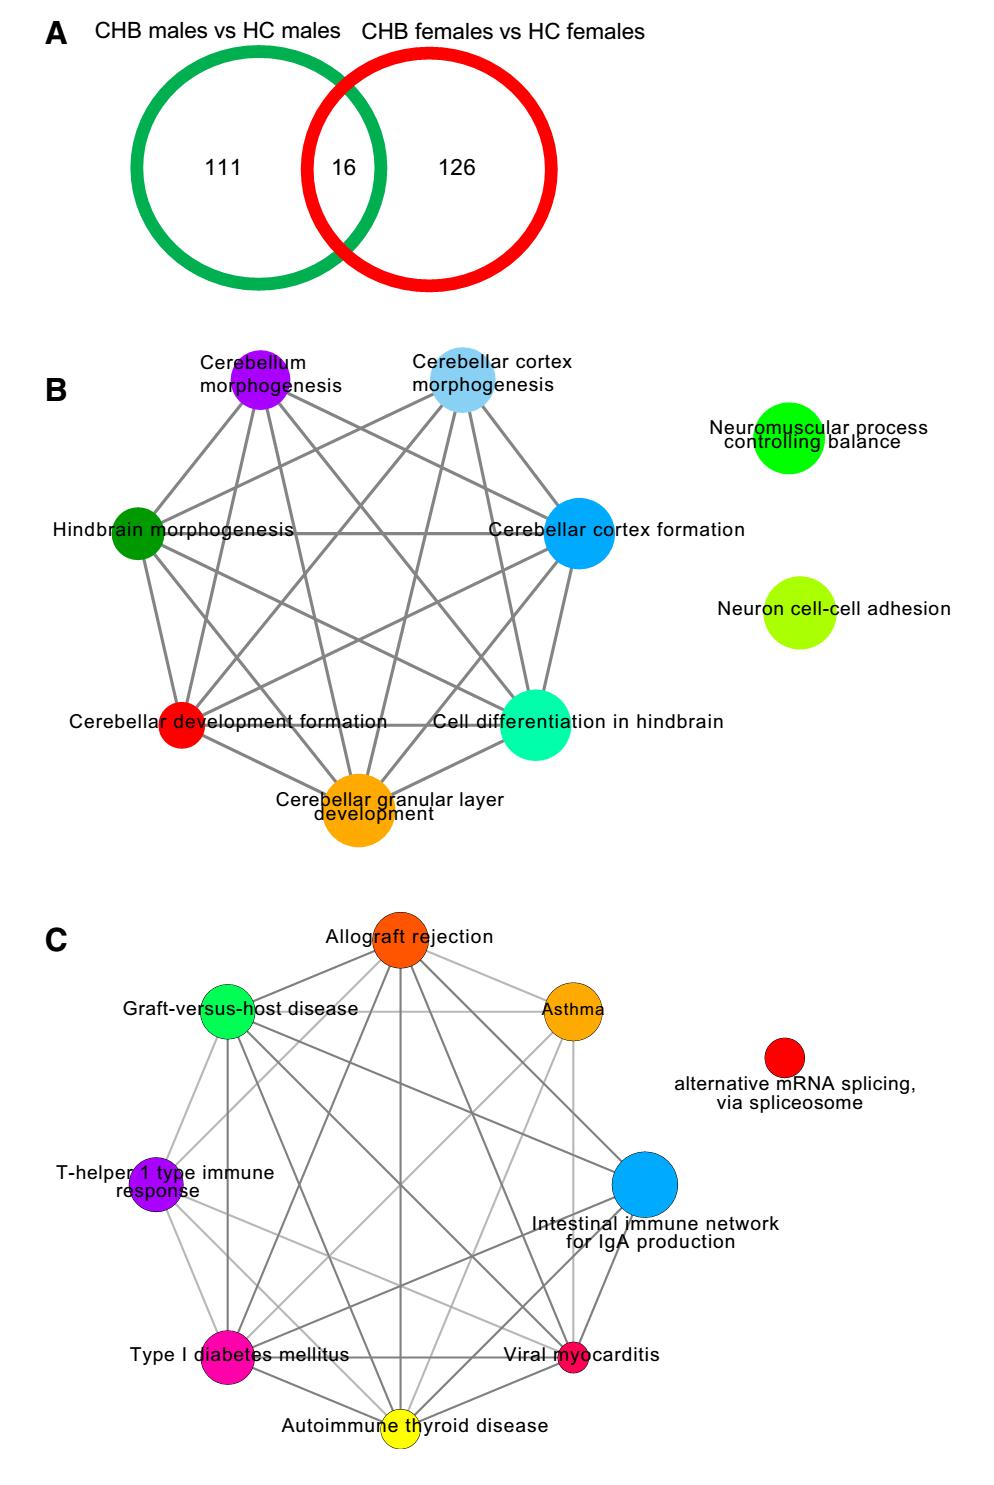
Figure 2. Venn diagram analysis and DM gene involvement in biological processes between sex in CHB patients. A Venn diagram analysis; B Interaction network of biological processes related to male CHB patientspecific DM genes; C Interaction network of biological processes related to female CHB patient-specific DM genes. Different colors of nodes represent different biological processes. Larger node size signifies smaller P value.
-
miR509-1, miR509-2, and miR509-3 were located in sex chromosomes (CHR X: 146340534, TSS 200) and were hypermethylated in both male and female CHB patients than in the corresponding HCs. Among male CHB patientspecific and female CHB patient-specific DM genes, VCX, TTTY1, and TSPY1 were also differentially methylated between male CHB patients and female CHB patients (|Δβ value| > 0.17 and P < 0.05) but not between male HCs and female HCs (P > 0.05). The CHR X: 7810800 locus in the 5′UTR of VCX was hypomethylated in male CHB patients as compared to that in female CHB patients (0.356 ± 0.346 vs 0.820 ± 0.070, P < 0.001), whereas its methylation level was not significantly different between male HCs and female HCs (0.860 ± 0.025 vs 0.897 ± 0.001, P > 0.05), according to the Human Methylation 450 K Assay results. The |Δβ value| of the CHR X: 7810800 locus was the highest (-0.504), and the 5′UTR is critical in gene expression. Therefore, its DNA methylation level was further validated, and its mRNA expression and SNP genotypes were detected in a larger sample set.
Pyrosequencing of larger sample sets showed that the CHR X: 7810800 locus was significantly hypermethylated in female CHB patients as compared to that in male CHB patients (0.298 ± 0.159 vs 0.233 ± 0.219, P < 0.05), whereas it was hypomethylated in female HCs as compared to that in male HCs (0.161 ± 0.161 vs 0.334 ± 0.196, P > 0.05) (Fig. 3A). VCX expression was upregulated in female CHB patients as compared to that in male CHB patients (11.437 ± 15.933 vs 1.778 ± 2.429, P < 0.05) but did not differ significantly between female HCs and male HCs (2.873 ± 4.150 vs 1.000 ± 1.026, P > 0.05) (Fig. 3B). In this study, the CHR X: 7810800 locus displayed three genotypes, namely CC, CT, and TT. The frequency of CC + CT was considerably higher in female CHB patients than in male CHB patients (females vs males: 76% vs 40%, P < 0.05), but was not correspondingly higher in female HCs than in male HCs (females vs males: 42% vs 65%, P > 0.05) (Fig. 3C).
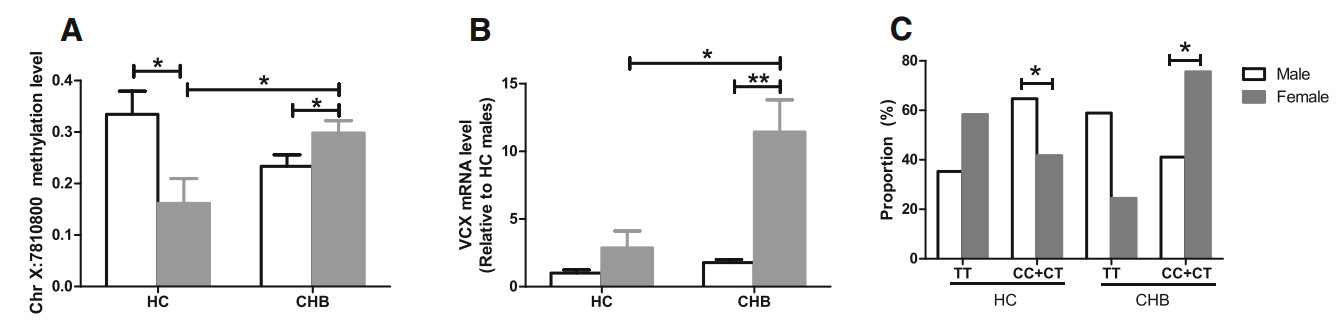
Figure 3. DNA methylation levels and SNP genotypes at the CHR X:7810800 locus and VCX mRNA levels in CHB patients and HCs. A DNA methylation level; B VCX mRNA level; C SNP genotypes. *P < 0.05, **P < 0.001.
-
Correlation analysis was performed to explore the relationship among SNP genotypes and DNA methylation at the CHR X: 7810800 locus and the VCX transcriptional level. CC + CT genotypes displayed a higher DNA methylation level than the TT genotype (0.392 ± 0.133 vs 0.110 ± 0.158, P < 0.001) (Fig. 4A), while VCX mRNA expression was not statistically different between genotypes (1.000 ± 2.148 vs 0.680 ± 1.522, P > 0.05). In CHB patients with CC + CT genotypes, the VCX mRNA level was negatively correlated with its DNA methylation level at the CHR X: 7810800 locus (r = -0.271, P < 0.01) (Fig. 4B). To further evaluate the involvement of DNA methylation in gene expression, we treated the K562 cell line with 5-Aza, a commonly used demethylating agent, at concentrations of 0.001, 0.1, and 10 μmol/L, respectively. Ten μmol/L 5-Aza led to notably higher VCX mRNA expression in K562 cells than 0, 0.001, and 0.1 μmol/L 5-Aza did, indicating that general DNA demethylation may increase VCX mRNA expression (Fig. 4C).
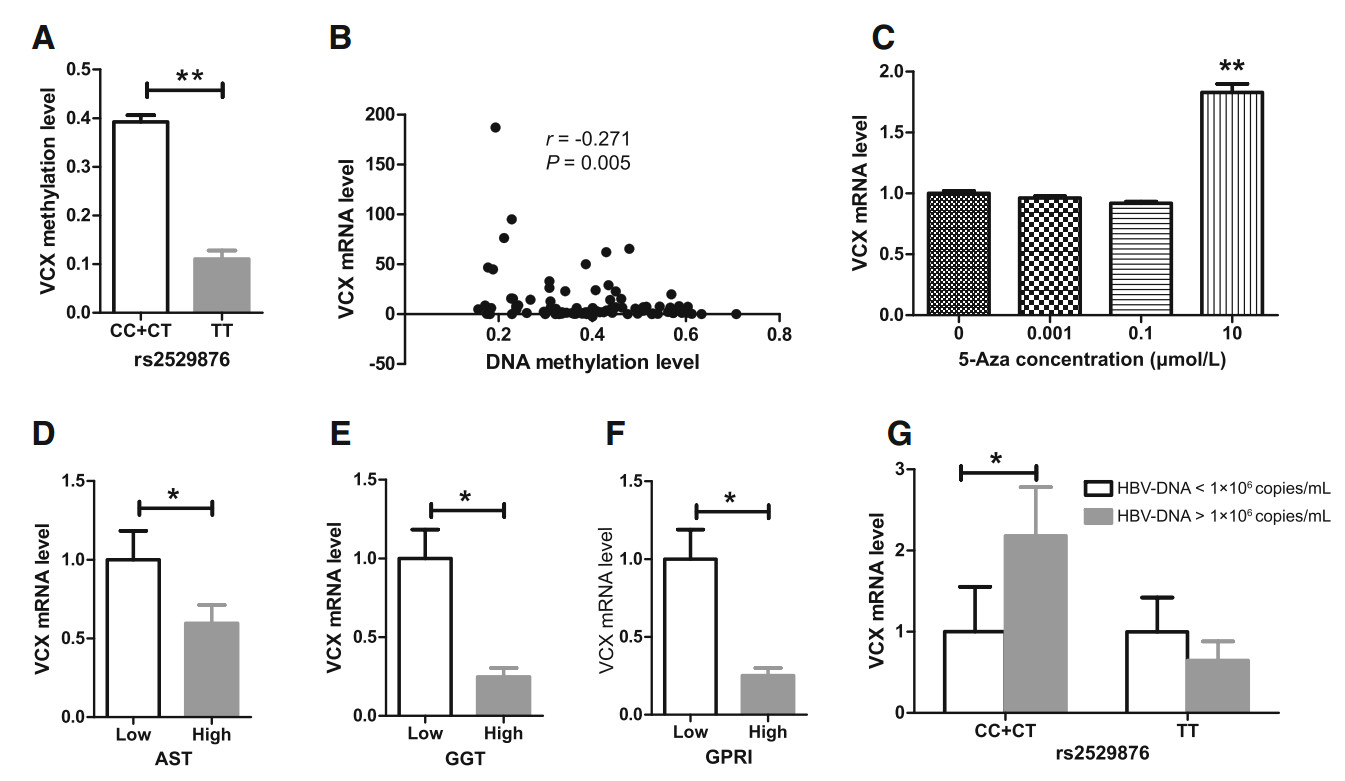
Figure 4. Relationship among SNP genotypes, DNA methylation level at the CHR X: 7810800 locus, VCX mRNA level, and liver function and fibrosis in CHB patients. A Relationship between SNP genotypes and DNA methylation level; B Correlation between VCX mRNA and its DNA methylation levels in the CC + CT genotype; C VCX mRNA expression following 5-Aza treatment; D Relationship between VCX mRNA and AST levels; E Relationship between VCX mRNA and GGT levels; F Relationship between VCX mRNA levels and GPRI values; G Relationship between VCX mRNA levels and HBV DNA load. *P < 0.05; **P < 0.001.
GPRI has been reported as a non-invasive serum marker for diagnosis of severe liver fibrosis in CHB patients, as it was positively correlated with histopathological scores (r = 0.372, P < 0.001); the optimal cutoff value of GPRI is 0.2343 with 58.24% specificity and 79.35% sensitivity (Zeng et al. 2015). Therefore, we used the cutoff values of 40 U/L, 50 U/L, and 0.2343 for AST, GGT, and GPRI, respectively, to determine the liver function and extent of fibrosis in CHB patients. As shown in Figs. 4D–F, VCX mRNA expression was lower in CHB patients with higher AST and GGT levels as well as GPRI score. Additionally, the CHR X: 7810800 methylation level was negatively correlated with GGT (r = -0.144, P < 0.05) and uric acid levels (r = -0.178, P < 0.05) but was positively correlated with the proportion of CD4 + T cells (r = 0.154, P < 0.05) and lymphocyte counts (r = 0.151, P < 0.05). VCX mRNA expression was negatively correlated with ALT (r= -0.246, P < 0.05), ALP (r = -0.332, P < 0.001), bile acid levels (r =-0.212, P < 0.05), and prothrombin time (PT) (r = -0.195, P < 0.05). On the other hand, VCX mRNA expression was positively correlated with the proportion of CD3 + T cells (r = 0.142, P < 0.05) and IgA level (r = 0.236, P < 0.05). With respect to CC + CT genotypes at the CHR X: 7810800 locus, VCX expression was increased in CHB patients with a higher HBV DNA load (over 1 × 10⁶ copies/mL) (Fig. 4G). These results indicated that CHR X: 7810800 hypomethylation and VCX mRNA downregulation in male CHB patients cause predisposition to worse liver dysfunction, less active immunity, and more significant fibrosis than in female CHB patients.
-
To explore whether VCX protein was secreted into the plasma and to evaluate sex-based differences in expression, we detected the VCX plasma concentration in 15 male CHB patients, 15 female CHB patients, 6 male HCs, and 6 female HCs using Western blot. As shown in Fig. 5, plasma VCX concentration in female CHB patients was higher than that in male CHB patients (P < 0.05), whereas it was not statistically different between male and female HCs (P > 0.05), which was consistent with the VCX mRNA expression in PBMCs (Fig. 5). Therefore, we inferred that higher plasma VCX expression contributed to better resistance to CHB in female patients.
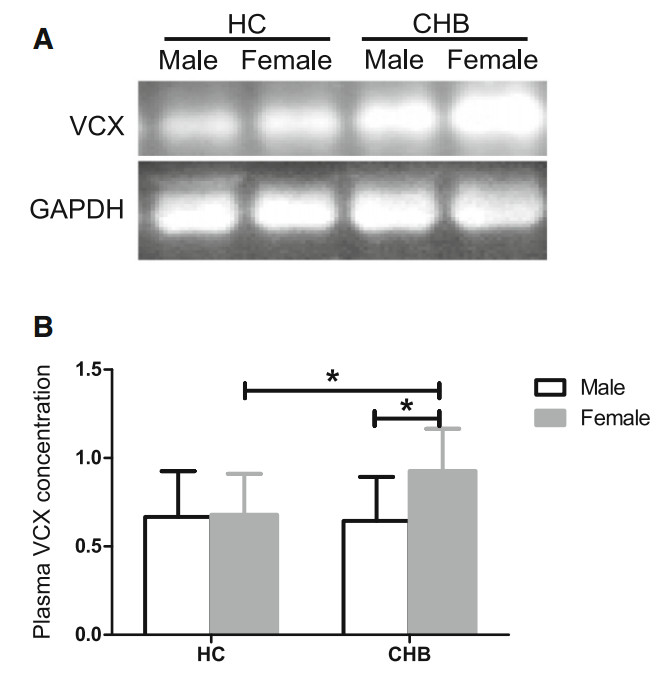
Figure 5. Plasma VCX protein concentrations in male and female CHB patients and HCs. A Western blot image. B Quantitative calculation using relative band intensity of VCX/GAPDH. *P < 0.05.
Clinical Differences between Male and Female CHB Patients
Genome-wide DNA Methylation Profiles of Male and Female CHB Patients
Enriched GO Terms and KEGG Pathways
DNA Methylation Level and SNP Genotypes in CHR X: 7810800 and VCX mRNA Expression in CHB Patients
Relationship among SNP Genotypes, DNA Methylation Level at Locus CHR X: 7810800, VCX mRNA Expression, and Clinical Parameters
Plasma VCX Concentration Comparison between Sex in CHB Patients and HCs
-
Male and female CHB patients respond differently to persistent infection with HBV (Su et al. 2007; Chen et al. 2009; Lee et al. 1999). In the present study, we found that in female CHB patients, HBV was more active, but liver dysfunction and fibrosis were less severe than those in male CHB patients.
Virani et al. (2016) reported that certain pathological factors alter the DNA methylation level in a sex-dependent manner, indicating the association of sex with DNA methylation (Virani et al. 2016; Kippler et al. 2013; Chatterjee et al. 2016; Kaz et al. 2014). Sex hormones affect HBV-related hepatocarcinogenesis by inducing epigenetic changes such as miRNA modification, DNA methylation, and histone modification in liver tissue (Montella et al. 2015). Studies on the sex disparity in the response to persistent HBV infection in terms of DNA methylation are limited. Therefore, we first detected the genome-wide DNA methylation of males and females in both CHB patients and HCs. We found that the genomic DNA methylation profiles differed among the 4 groups. Either male CHB patient or female-specific DM loci were distributed in all regions, mainly in the gene body, promoter, and IG. Male CHB patient-specific DM genes were predominately enriched in the processes of brain development, while female CHB patient-specific DM genes were mainly enriched in immune-related processes, indicating that DNA methylation alteration mediated the sex differences in the response to chronic HBV infection. The sample size was small in the analysis of genome-wide DNA methylation; therefore, the results must be verified with a larger sample set.
We also found that the CHR X: 7810800 locus in the 5′UTR of VCX was significantly hypermethylated, and VCX mRNA expression was higher in female CHB patients than in male CHB patients. However, the DNA methylation level was lower in female HCs than in male HCs, and VCX mRNA expression was not statistically different between these groups. Additionally, plasma VCX expression in female CHB patients was higher than that in male CHB patients, whereas no statistical difference was observed between female HCs and male HCs. The VCX sequence covers the CHR X: 7810303–7812184 region and contains 1882 bases in total. Mao et al. (2017) reported that the frequency of L104P mutation in the VCX gene increased from 11% in adjacent non-tumor tissues to 14.6% in HCC tissues. VCX has also been confirmed to be silenced in colorectal cancer cell lines (Fukutomi et al. 2007). Cancer/testis (CT) antigens, including those of the VCX/Y gene family, are potential immunotherapeutic targets in cancer (Taguchi et al. 2014), suggesting the involvement of VCX in cancer initiation or development. Ji et al. (2016) discovered that increased VCX expression in germ cell lines could affect spermatogenesis possibly via regulating ribosome assembly, indicating the association of VCX with sex-related disease (Ji et al. 2016; Zou et al. 2003). The VCX gene, alone or in conjunction with other VCX/Y genes, is involved in the process of mental retardation in X-linked ichthyosis, indicating that VCX influences cognitive and neural activity, in which sex differences have been shown to exist (Cuevas-Covarrubias and Gonzalez-Huerta 2008; Van Esch et al. 2005).
Correlations among SNPs, methylation, and gene transcription have been widely reported (Lou et al. 2014; Zhang et al. 2017; Rohde et al. 2017; Jones et al. 1992). Our results demonstrated that the frequency of CC + CT genotypes in CHR X: 7810800 was higher in female CHB patients than in male CHB patients, but was not correspondingly higher in female HCs than in male HCs. Moreover, CHB patients with CC + CT genotypes exhibited a higher methylation level at the locus than did CHB patients with the TT genotype. In CHB patients with CC + CT genotypes, the methylation level was negatively correlated with VCX mRNA expression. 5-Aza dose-dependently increased VCX expression in K562 cells. However, the CHR X: 7810800 locus in the 5′UTR of VCX was significantly hypermethylated, and VCX mRNA expression was higher in female CHB patients than in male CHB patients. The correlation between VCX methylation and expression was inconsistent between in vivo and in vitro studies, possibly for the following reasons: (1) 5-Aza induced genome-wide DNA hypomethylation rather than alteration of a single CpG locus. The widespread DNA hypomethylation promoted gene expression, but hypomethylation at the CHR X: 7810800 locus may suppress gene expression. In other words, the consequence of genome-wide DNA methylation alteration and changes in the methylation status of a certain locus may be different. (2) Clinical samples can be influenced by many factors, which cannot be reproduced in in vitro experiments. (3) Besides DNA methylation, SNP genotype also critically affects gene expression. These results suggested that an increased frequency of CC + CT genotypes might be involved in the hypermethylation at the CHR X: 7810800 locus observed in female CHB patients. In addition, VCX mRNA expression was partially attributed to DNA methylation at the locus. DNA methylation at other CpG loci may synergistically and cooperatively regulate VCX expression, but this mechanism requires further investigation.
With respect to CC + CT genotypes at the CHR X: 7810800 locus, CHB patients with higher viral load displayed higher VCX expression. Those with lower ALT, AST, ALP, and GGT levels and lower GPRI score also exhibited higher VCX expression. Moreover, levels of CHR X: 7810800 methylation and VCX mRNA were positively correlated with the proportion of CD4+ or CD3+ T cells and lymphocyte counts, indicating that VCX may play a beneficial role in immune reaction. This may explain why females with a higher HBV DNA level exhibited milder liver dysfunction and fibrosis.
Interesting, we have discovered 9 DM loci, which locate on Y chromosome in females. Male microchimerism with Y-chromosome-specific sequence has been described in the circulation of women with scleroderma, hepatitis, and in healthy women (Guettier et al. 2005; Evans et al. 1999; Bianchi et al. 1996). In this study, DM loci probably activate or silence of corresponding genes, which relate to gain or loss function of Y-Chromosome sequence in females with CHB. It needs further study.
Collectively, these results suggested that males and females respond differently to persistent HBV infection. Specifically, chronic HBV infection in females may increase the frequency of CC + CT genotypes, leading to hypermethylation at the CHR X: 7810800 locus. In turn, upregulated VCX expression may alleviate HBV infectioninduced liver dysfunction and fibrosis. Nonetheless, the underlying mechanisms require further study.
SNPs and hypermethylation at the CHR X: 7810800 locus cooperatively regulated VCX expression in CHB patients. Upregulated VCX expression might be a protective factor in females that mitigates liver dysfunction and fibrosis, which are more severe in males.
-
Shi-Bing Su was supported by the Key Program of National Natural Science Foundation of China (81330084), and the E-institutes of Shanghai Municipal Education Commission (No E03008). Yi-Yang Hu was supported by the National Science and Technology Major Project of China (2012ZX10005001-004). Xue-Qing Hu was supported by the Science and Technology Commission of Shanghai Municipality (19YF1449900).
-
SBS designed research; XQH performed research, analyzed data and wrote the paper; JC, QLC, YYL and YJH helped to analyze the data. YZ helped to the perform the cell experiment. YZ and YYH helped to collect clinical samples and data. SBS checked and finalized the manuscript. All authors read and approved the final manuscript.
-
The authors declare that they have no conflict of interest.
-
The study was approved by IRB of Shuguang Hospital Affiliated with Shanghai University of Traditional Chinese Medicine (2012-206-22-02). Additional informed consent was obtained from all patients for which identifying information is included in this article.

 DownLoad: