


HTML
-
Foot-and-mouth disease is a highly contagious disease caused by foot-and-mouth disease virus (FMDV), a positive-sense-strand RNA virus in the Picornaviridae family (Zanotto et al. 1996). FMDV uses multiple strategies to replicate effectively. For example, FMDV uses host cap-independent translation machinery to translate its protein that, in turn, can block cap-dependent protein translation (Belsham et al. 2000). FMDV can also induce autophagy (O'donnell et al. 2011; Berryman et al. 2012; Sun et al. 2018) and apoptosis (Peng et al. 2004; Jin et al. 2007; Wang et al. 2012) in infected cells. Like other viruses, FMDV evades and inhibits the innate immune responses (Salt 1993; Wang et al. 2011a, b; Du et al. 2014).
Fever, skin vesicular lesion, lameness, and salivation are common symptoms in cloven-hoofed animals during the acute stage of FMDV infection (Meyer and Knudsen 2001). Incomplete viral clearance during acute infection leads to persistent infection (Salt 1993). Persistently infected animals are usually asymptomatic but remain a potential epidemic threat to healthy animals, which causes strict export embargoes and tremendous financial loss to the livestock industry (Alexandersen et al. 2002). To study persistent infection, cell lines persistently infected with FMDV were established as in vitro models (dl Torre et al. 1985). Based on these models, a hypothesis that viruses and cells co-evolve during persistent infection was proposed (dl Torre et al. 1988). Variabilities in host cells were considered to be the dominant factors determining if persistent infection occurred (Hernandez et al. 1994).
The molecular mechanisms through which variations in host gene expression determine persistent infection are not completely clear. Only limited information is available on differences in host gene expression between acutely and persistently infected cells. Using microarray technology, we previously identified several differentially expressed genes (DEGs) and pathways between the mock infected and the FMDV infected BHK-21 (acute and persistent respectively) (Zhang et al. 2013). However, variations in gene expression between acutely and persistently infected cells remain unclear due to limitations in detection. Recently, RNA-Seq has been applied to measure gene expression levels. Several differentially expressed immune-related genes were detected in PK-15 cells acutely infected with FMDV (Zhang et al. 2018). In addition, DEGs, differential alternative splicing events, and differential cell signaling pathways were found in virus-negative cells isolated from BHK-21 persistently infected with FMDV compared with those from uninfected BHK-21 cells (Han et al. 2018). Information on differences in host gene expression between acutely and persistently infected cells can provide insights into the mechanisms involved.
Heat shock protein family B member 1 (Hspb1, also called Hsp27), which belongs to the family of small stressinducible proteins (sHsps), plays a significant role in protein folding, regulation of apoptosis, and development of certain neurodegenerative disorders (Mymrikov et al. 2011). Hspb1 interacts with FMDV structural protein VP2, which induces autophagy in PK-15 cells (Sun et al. 2018). The autophagy pathway is utilized during FMDV replication (O'donnell et al. 2011). However, direct evidence linking Hspb1 with FMDV infection is lacking.
In this study, we compared transcriptome profiles of BHK-21 cells persistently infected with FMDV with those of BHK-21 acutely infected with FMDV. We identified significant enrichment of 8, 378 DEGs involved in metabolism, biosynthesis, ribosome function, and endocytosis. We selected Hspb1, a critical gene for FMDV replication, for the follow-up study. Hspb1 was found to be up-regulated in acutely infected cells and down-regulated in persistently infected cells. Knockdown of Hspb1 significantly suppressed FMDV replication in BHK-21 cells. Our research provides useful information for further study of persistent FMDV infection and genes involved in FMDV replication.
-
FMDV strain serotype O (Akesu/58/2002, GenBank accession no. AF511039) was obtained from the Lanzhou Veterinary Research Institute, Chinese Academy of Agriculture Sciences. Viral titration was performed by the 50% tissue culture infective dose method (TCID50) according to Reed-Muench (Xin et al. 2018).
BHK-21 baby Syrian hamster kidney cells were provided by the China Center for Type Culture Collection (CCTCC). The persistently serotype-O FMDV-infected BHK-21 cell line (BHKOp) was established by Dr. Huang in 2000 (Huang et al. 2011) and preserved in our laboratory since that time. Wild-type BHK-21 cells were cultured in Minimum Essential Medium (MEM; Gibco, USA) supplemented with 10% fetal bovine serum (FBS; Sijiqing, China) at 37 ℃ with 5% CO2. BHKOp cells were cultured under the same conditions but without CO2. This is because ammonium chloride was used to neutralize the acidic endolysosome compartments during the establishment of BHKOp. The addition of CO2 could change the pH of medium. Thus, BHKOp cells were cultured without CO2.
Acutely infected cells were developed by incubating BHK-21 cells with wild-type FMDV at 10-3 TCID50/cell according to a previously published infection protocol (Xin et al. 2018). Mock-infected BHK-21 cells served as a negative control. Cells were collected 24 h post infection. Persistently infected BHK-21 cells were collected and wild-type BHK-21 cells were used as a negative control. Three independent replicates were conducted for each cell group.
In this study, BHK-21 cells acutely and persistently infected with serotype-O FMDV are abbreviated BHKOa and BHKOp, respectively.
-
Total RNA was extracted with RNAiso Plus (Takara, Japan) according to the manufacturer's instructions. RNA quality and quantity were determined by agarose gel electrophoresis, NanoDrop 2000 (Thermo Fisher, USA), and Qubit and Agilent 2100.
-
The cDNA library was constructed following protocols provided by Illumina (NEB Next Ultra RNA Library Prep Kit, Illumina, USA). RNA-Seq was performed by Beijing Novogene Illumina Biological Information Technology Co. Ltd. Data from the transcriptome profiles have been submitted to GEO (accession numbers GSE93045 and GSE124122). Methods of RNA-Seq data analysis were described in our previous study (Han et al. 2018). The cleaned reads used for further analysis were acquired by filtering the raw data using Cutadapt software (Martin 2011). The quality of sequencing was estimated by calculating the Phred score (Qphred), which is defined as: Qphred = - 10log10(e), where e is the sequencing error rate (Andrews 2010). The reference genome (Mesocricetus auratus) and gene annotation files were downloaded from ENSEMBL. HISAT was used to build the index of the reference genome. The cleaned reads were aligned to the reference genome using HISAT software to generate a map of splice junctions based on the gene model annotation file (Kim et al. 2015). Lack of contamination was confirmed by a uniquely mapped read value higher than 70%. The Pearson correlation coefficient was calculated by R language and used to test correlations between gene expression patterns (Chen and Zhao 2005). RNA-Seq reads were visualized with Integrative Genomics Viewer (IGV) software (Robinson et al. 2011).
-
Gene expression level was calculated by counting the numbers of reads mapping to genes or exons (Mortazavi et al. 2008). FeatureCounts was used to count the read numbers mapped to each gene (Liao et al. 2013). The expected number of Fragments Per Kilobase of transcript sequence per Millions base pairs sequenced (FPKM) was employed to evaluate gene expression levels using HTSeq (Trapnell et al. 2010). FPKM takes into account both sequencing depth and the gene length of fragments. The threshold was set to 1 to determine if a gene was expressed or not. DESeq was used to identify DEGs (Love et al. 2014). The q values used here differ from a p value, in that a q value is based on the false discovery rate. The criterion for DEGs were genes with fold change > 1, biological replicates > 2, and q < 0.05.
GO term enrichment analysis of DEGs was based on the Gene Ontology (GO) database (Young et al. 2010). GO terms with the most significant enrichment are shown in a histogram. Over-representation of DEGs in metabolic and signaling pathways were analyzed using KOBAS (2.0) based on the Kyoto Encyclopedia of Genes and Genomes (KEGG) (Xie et al. 2011). Pathways with the most significant enrichment are shown in a scatter plot.
The AmiGO gene ontology database (http://amigo.geneontology.org/amigo/landing) was used to identify genes related to the innate and adaptive immune responses (Carbon et al. 2008). We used 1423 genes from GO:0045087 and 941 genes from GO: 0002250 as genes related to the innate and adapted immune response, respectively.
-
Reverse transcription of 1 μg extracted RNA was performed using oligo d(T) (Takara) and Moloney Murine Leukemia Virus (M-MLV) reverse transcriptase (Promega, USA). RT-qPCR was performed using SYBR Green dye (Invitrogen, USA) and a CFX96 real-time PCR detection system (Bio-Rad, USA). GAPDH was used as a control to normalize the results of real-time PCR. The primers designed by NCBI Primer-Blast are shown in Supplementary Table S1.
FMDV-positive and -negative mRNA were examined with strand-specific RT-qPCR according to our previous description (Xin et al. 2018). Strand-specific reverse transcription was performed using 1 μg RNA with primers specific to 3D and M-MLV reverse transcriptase. Strandspecific RT-qPCR was performed using SYBR Green dye and a CFX96 real-time PCR detection system. GAPDH was used to normalize the amount of intracellular RNA. The Pearson correlation coefficient was used to analyze the correlation of log2-fold changes measured using RNA-Seq and RT-qRCR. Statistical significance between the two methods was determined by a two-tailed test.
-
Cells were lysed in RIPA buffer and incubated at 100 ℃ in loading buffer for 10 min. The cell lysates were then centrifuged at 10, 000 ×g for 10 min. The supernatants were separated by 10% SDS-PAGE and electro-transferred onto a polyvinylidene fluoride membrane (Bio-Rad) for Western blotting. The membranes were placed in TBST buffer (Sigma, USA) containing 5% skim milk powder for 1 h at room temperature for blocking. Then, the membranes were incubated overnight at 4 ℃ with the primary antibodies, including anti-Hspb1 (1:1000, Huabio), anti-p-hspb1 (1:1000, Huabio), anti-3D (1:8000, our lab), or anti-gapdh (1:5000, Proteintech). Horseradish peroxidase (HRP)-coupled anti-mouse or anti-rabbit secondary antibodies (1:10, 000, Proteintech) were added for 1 h at 25 ℃. The immunocomplexes were visualized using ECL reagent (Millipore, Germany).
-
Hspb1 expression was knocked down using shRNA in BHK-21 cells. Double-stranded oligonucleotides corresponding to the target sequences were cloned into the HindⅢ and BglⅡ restriction sites of the pSUPER.retro.puro plasmid (Oligoengine). BHK-21 cells (2 × 10⁵ cells per well) in 12-well plates were transfected with 0.6 μg pSUPER-shHspb1 using 1.2 μL Lipofectamine 2000 (Thermo Fisher) for 24 h. Scrambled shRNA-NC with the sequence TTCTCCGAACGTGTCACGT was used as a negative control. The cells were then infected with FMDV at 10-3 TCID50/cell. RNA and protein expression were analyzed 24 h after infection. The following sequences of shRNA were used to knock down Hspb1 expression: shHspb1#1: GCTACATCTCTCGG TGCTTTA; shHspb1#2: GCCACACAATCATCGGAG ATC; shHspb1#3: ACCATTCCGGTCACTTTCGAG.
-
Experimental data are presented as mean ± SE. Statistical significance between two groups was determined by equal variance two-tailed Student's t tests. P values less than 0.05 were considered to be statistically significant. P values less than 0.01 were considered to be extremely significant.
Cells and Viruses
RNA Extraction
Illumina Sequencing and Data Analysis
Quantification of Gene Expression and Analysis of DEGs
Reverse Transcription Quantitative PCR(RT-qPCR)
Western Blot Analysis
Short-Hairpin RNA (shRNA) Knockdown
Statistical Analysis
-
We used RNA-Seq on the Illumina platform to analyze transcriptome profiles of BHK-21 cells acutely and persistently infected with FMDV. In total, we obtained more than 342.8 million raw sequencing reads. Approximately 336.5 million clean reads (98.14%) were acquired by filtering out the adapters and trimming ambiguous reads. The transcriptome profiles of acutely or persistently infected BHK-21 cells were each compared with that of mockinfected BHK-21 cells. The numbers and distribution of DEGs varied noticeably for acutely and persistently infected BHK-21 cells compared with mock-infected BHK-21 cells. A histogram was plotted to compare numbers of DEGs (Fig. 1A). The numbers of up-regulated and down-regulated genes were similar in both cell lines. However, the amount of DEGs relative to mock-infected BHK-21 cells was greater in persistently infected than in acutely infected cells. DEGs were classified according to log2-fold changes (Fig. 1B). The distribution of log2-fold changes for DEGs in acutely infected BHK-21 cells covered a relatively narrower range (from - 1 to 1) than that of DEGs in persistently infected BHK-21 cells (from - 12 to 10).

Figure 1. Analysis of differentially expressed genes (DEGs) in serotypeO FMDV acutely (BHKOa) and persistently (BHKOp) infected BHK- 21 cells. A Histogram of DEG numbers in acutely and persistently infected BHK-21 cells. Up-regulated and down-regulated genes are compared in acutely and persistently infected BHK-21 cells. B Distribution of DEGs according to log2-fold change. The horizontal axis represents fold change of DEGs and vertical axis represents percentage of DEGs.
DEGs were compared indirectly between acutely and persistently infected cells using mock-infected BHK-21 cells as a reference. Volcano plots of magnitude (fold change) and significance (q value) demonstrate the presence of DEGs (Fig. 2A). The red and green spots in the volcano plot represent DEGs that are up-regulated and down-regulated, respectively. Compared with persistently infected BHK-21 cells, 8378 DEGs were identified in acutely infected BHK-21 cells, of which 4298 were upregulated and 4080 were down-regulated (Fig. 2A, Supplementary Table S2).

Figure 2. Analysis of GO and KEGG enrichment in acutely infected BHK-21 cells (BHKOa) compared with persistently infected BHK-21 cells (BHKOp). A Volcano plot showing distribution and quantity of DEGs in acutely infected BHK-21 cells compared with persistently infected BHK-21 cells. The horizontal and vertical axes represent log2-fold changes and significance of DEGs, respectively. The red, green, and blue spots represent genes that are up-regulated, downregulated, and not significantly different, respectively. B Analysis of GO enrichment. Thirty GO terms with the most significant enrichment are shown in the histogram. The vertical axis represents the enriched GO term; the horizontal axis represents the number of DEGs. The significantly enriched term is marked "*". C Analysis of KEGG enrichment. Twenty pathways with the most significant enrichment are shown in a scatter plot. The vertical axis represents enriched pathways; the horizontal axis represents enrichment factor, which is the ratio of DEG number to background gene number. The size of the spot is proportional to the number of DEGs. Q value is plotted in a color map.
-
GO enrichment analysis was performed to understand the function of the 8378 DEGs. The significantly enriched GO terms, classified into three categories (biological process, cellular component, and molecular function), are presented in Fig. 2B. In the biological process category, terms related to gene expression, metabolic process, and biosynthetic process (GO:0044237, GO:0008152, GO:0034641, GO:0044260, GO:0044238, GO:1901576, GO:0009058, GO:0071704, GO:0006807, GO:0044249, GO:0034645, GO:0009059, GO:0010467, GO:0044271, GO:0006139, GO:0044710, GO:1901360 and GO:0043170) were significantly enriched. In the cellular component category, terms related to nucleus, intracellular, and organelle (GO:0005622, GO:0005623, GO:0044464, GO:0043226, GO:0044424, GO:0043229, GO:0005737, GO:0005634, GO:0043231 and GO:0043227) were significantly enriched. In the molecular function category, significant enrichment was found for binding (GO:0005488) and structural constituent of ribosome (GO:0003735).
KEGG enrichment analysis was performed to identify the metabolic pathways and signaling pathways in which DEGs were involved. A scatter plot was created to display significantly enriched pathway terms. Ribosome (114 DEGs) and endocytosis (138 DEGs) were the most significantly enriched terms in acutely infected BHK-21 cells compared with persistently infected BHK-21 cells (Fig. 2C).
-
Given the significant differences identified in ribosomes and biosynthesis related genes via the above GO and KEGG enrichment, DEGs related to ribosomes and translation were further analyzed in these two cell lines. Mockinfected BHK-21 cells served as a negative control. The amount of DEGs related to ribosomes and translation was compared in Table 1. Twelve DEGs related to ribosomes and translation were found in acutely infected BHK-21 cells, including four large subunit ribosomal protein genes (RPLs), two small subunit ribosomal protein genes (RPSs), five eukaryotic translation initiation factor genes (EIFs), and one eukaryotic translation elongation factor genes (EEFs). The number of DEGs related to ribosomes and translation was greater in persistently infected BHK-21 cells (39 DEGs) and included 18 RPLs, 12 RPSs, 6 EIFs, and 3 EEFs. In addition, the number of down-regulated genes was greater than the number of up-regulated genes in both cell lines. The fold changes of the above genes were shown in Fig. 3A. The log2-fold changes in the levels of genes in persistently infected BHK-21 cells were notably lower than those in acutely infected BHK-21 cells, indicating that ribosome- and translation- related genes were expressed at lower levels. To verify the RNA-Seq results, RT-qPCR was performed to quantify mRNA expression levels of nine of the above genes. Variation tendencies in gene expression were identical for both methods (correlation coefficient = 0.94, sig. = 5.55 9 10-9) (Fig. 3B). These data reveal that the expression levels of genes related to ribosomes and translation are lower in persistently infected BHK-21 cells than in acutely infected cells.
Gene categories Number of DEGs in BHKOa Number of DEGs in BHKOp Up-regulated Down-regulated Up-regulated Down-regulated RPL 0 4 0 18 RPS 0 2 0 12 EIF 2 3 2 4 EEF 0 1 2 1 Total 2 10 4 35 RPL large subunit ribosomal protein genes; RPS small subunit ribosomal protein genes; EIF eukaryotic translation initiation factor genes; EEF eukaryotic translation elongation factor genes Table 1. Comparison of the number of DEGs related to ribosome and translation.
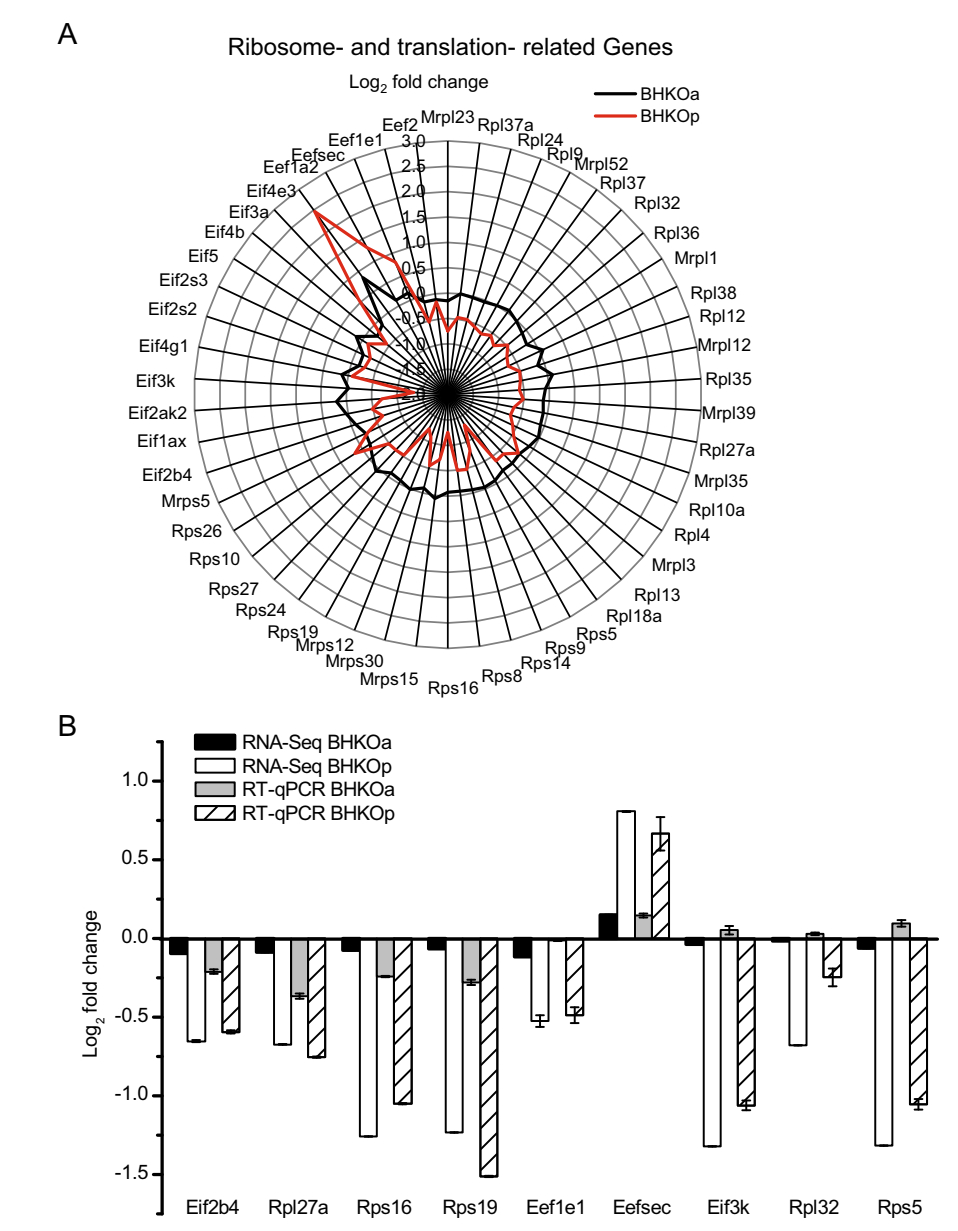
Figure 3. Analysis of ribosomeand translation- related DEGs in serotype-O FMDV acutely (BHKOa) and persistently (BHKOp) infected BHK-21 cells. A Fold changes of genes related to ribosomes and translation in acutely and persistently infected BHK-21 cells. A Rader map was plotted to compare the differential expression levels of genes related to ribosomes and translation. The horizontal and vertical axes represent the name and log2-fold changes of genes, respectively. The black and red lines represent acutely and persistently infected BHK-21 cells, respectively. B Comparison of fold changes in DEGs related to the ribosome and translation between RNASeq and RT-qPCR. The horizontal and vertical axes represent the name and log2- fold changes of DEGs, respectively.
-
The immune response is critical for protecting cells against viral infection. DEGs related to the innate and adaptive immune responses were analyzed in BHK-21 cells acutely and persistently infected with FMDV compared with mock-infected BHK-21 cells. Table and scatter diagrams were created to show the quantity and magnitude (fold change) of DEGs, respectively. Thirty-four DEGs related to the innate immune response were identified in acutely infected BHK-21 cells, with 18 up-regulated and 16 downregulated (Table 2). The corresponding distribution of log2-fold changes in these DEGs covered a relatively narrow range from - 0.5 to 1 (Fig. 4A, left panel). By contrast, 93 DEGs were identified in persistently infected BHK-21 cells, with 52 up-regulated and 41 down-regulated (Table 2). The corresponding distribution of log2-fold changes in these DEGs covered a much wider range, from - 8 to 5 (Fig. 4A, right panel). Similar observations were made for the adaptive immune response. Twenty-one DEGs were identified in acutely infected BHK-21 cells, with 19 up-regulated and 2 down-regulated (Table 2) and a corresponding distribution of log2-fold changes from - 0.5 to 1 (Fig. 4B, left panel). Persistently infected BHK-21 cells showed 67 DEGs, of which 39 were up-regulated and 28 were down-regulated (Table 2), with a corresponding distribution of log2-fold changes from - 9 to 6 (Fig. 4B, right panel). To verify the reliability of the RNA-Seq results, mRNA expression levels of nine of the above genes were quantified via RT-qPCR. The log2-fold changes of these genes in acutely and persistently infected cells are shown using these two methods (Fig. 4C). Variation tendencies in mRNA expression were identical using the two methods (correlation coefficient = 0.97, sig. = 5.23 × 10⁻¹¹), supporting the reliability of RNA-Seq. These results indicate that a higher number of immune-related genes are activated during persistent infection than during acute infection.
DEGs categories Number of DEGs in BHKOa Number of DEGs in BHKOp Up-regulated Down-regulated Up-regulated Down-regulated Innate immune response 18 16 52 41 Adaptive immune response 19 2 39 28 Table 2. Comparison of the number of DEGs related to immune response.
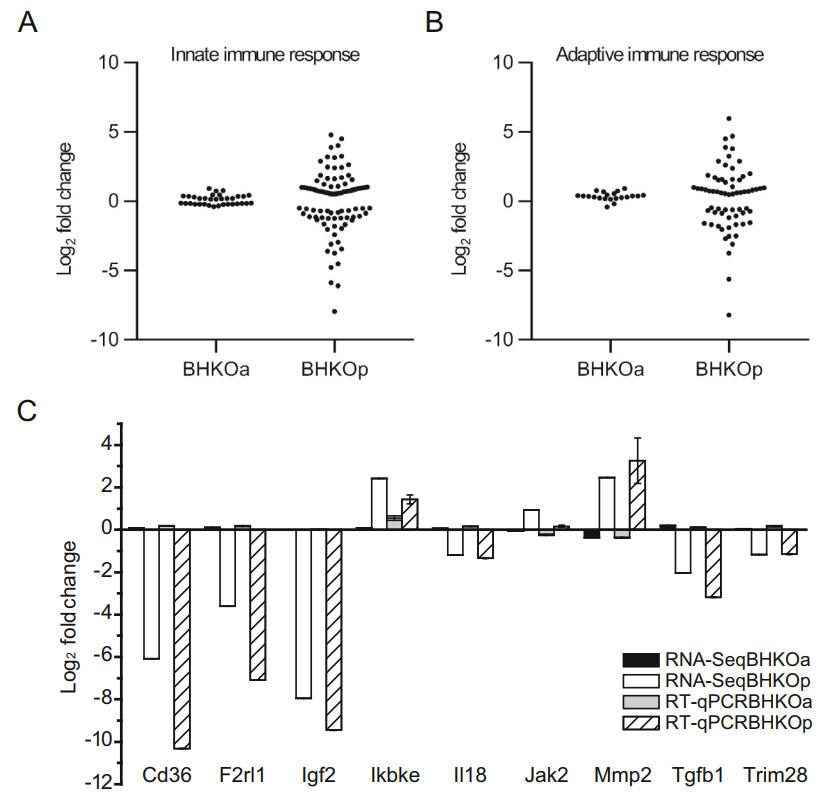
Figure 4. Analysis of immunerelated DEGs in serotype-O FMDV acutely (BHKOa) and persistently (BHKOp) infected BHK-21 cells. The scatter plot shows the fold changes of DEGs related to the innate immune response (A) and adaptive immune response (B). C Comparison of fold changes in DEGs related to the immune response between RNA-Seq and RT-qPCR. The horizontal and vertical axes represent the name and log2-fold changes of DEGs, respectively.
-
Further analysis of DEGs revealed that a small portion of genes showed differential expression in both acutely and persistently infected BHK-21 cells compared with mockinfected BHK-21 cells. These genes were sorted into four categories: 58 genes were up-regulated in both lines; 59 were down-regulated in both lines; 56 genes were upregulated in acutely infected cells but down-regulated in persistently infected cells; 101 genes were down-regulated in acutely infected cells but up-regulated in persistently infected cells (Fig. 5A). To verify the reliability of the RNA-Seq results, mRNA expression levels of 20 genes were quantified by RT-qPCR. The log2-fold changes of these genes in acutely and persistently infected cells using these two methods were compared (Fig. 5B). Variation tendencies in mRNA expression were identical using the two methods (correlation coefficient = 0.86, sig. = 1.37 × 10⁻¹²), verifying the reliability of RNA-Seq.
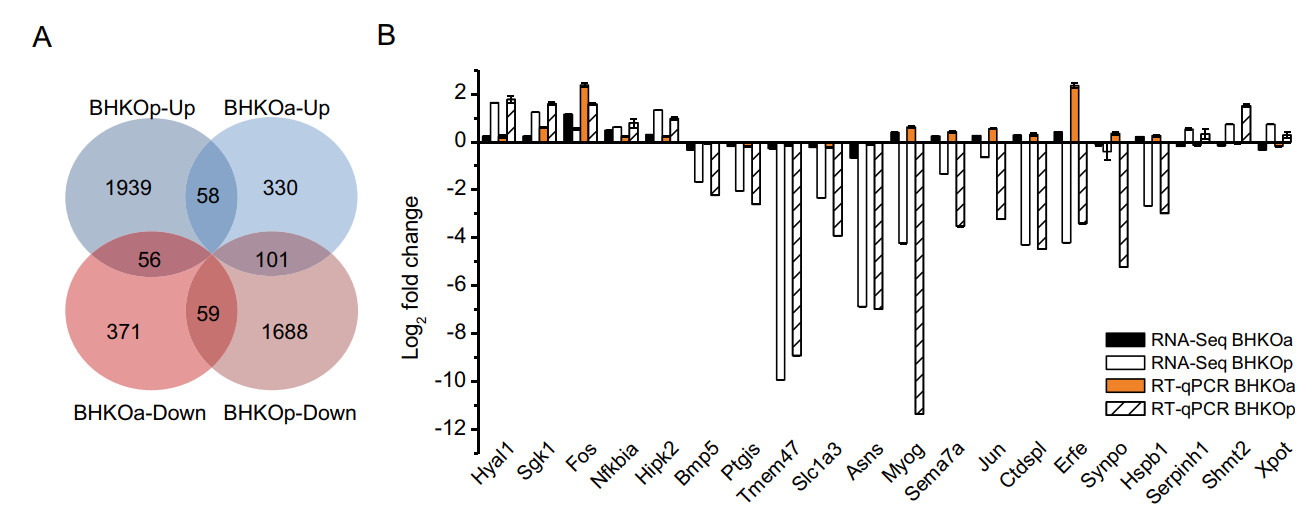
Figure 5. Analysis and verification of DEGs in both acutely and persistently infected BHK-21 cells. For simplicity, BHK-21 cells acutely and persistently infected with serotype-O FMDV are abbreviated as BHKOa and BHKOp, respectively. A Venn diagram with four sets: BHKOa-up, BHKOa-down, BHKOp-up, and BHKOp-down and their intersections, with "up" and "down" representing upregulation and down-regulation, respectively. The number of DEGs is shown in each section. B Comparison of fold changes of DEGs between RNA-Seq and RT-qPCR. The horizontal and vertical axes represent the name and log2-fold changes of DEGs, respectively.
-
We selected the host factor Hspb1, which was up-regulated in acutely infected cells and down-regulated in persistently infected cells, for additional study. The protein expression level of Hspb1 was analyzed by Western blotting in acutely and persistently infected cells. Consistent with mRNA expression analyses, the protein expression level of Hspb1 was down-regulated in persistently infected BHK-21 cells (Fig. 6A). No significant difference was observed in Hspb1 protein expression level between acutely infected and mock-infected cells. To further investigate the role Hspb1 plays during FMDV infection, three shRNA sequences were designed to knock down Hspb1 expression. The mRNA and protein expression levels were examined via RT-qPCR and Western blotting, respectively, after silencing Hspb1 expression. The mRNA and protein expression levels were knocked down by all three shRNAs (Fig. 6B, 6C), and shHspb1 #1 was used in further studies. After transfection with shHspb1#1 for 24 h, BHK-21 cells were infected with FMDV at 10-3 TCID50/cell. The mRNA and protein expression levels of viral non-structural protein 3D were examined 24 h post infection (Fig. 6D–6F). The mRNA expression levels of 3D were significantly reduced by 65% when Hspb1 was knocked down. Similarly, the protein expression levels of 3D were reduced by 30% when Hspb1 was knocked down. To further reveal the role of Hspb1 in FMDV replication, we examined the negativestrand RNA of 3D. The negative-strand RNA of 3D was significantly reduced by 65% upon knockdown of Hspb1 (Fig. 6G). These results suggest that Hspb1 plays a significant role in FMDV replication.
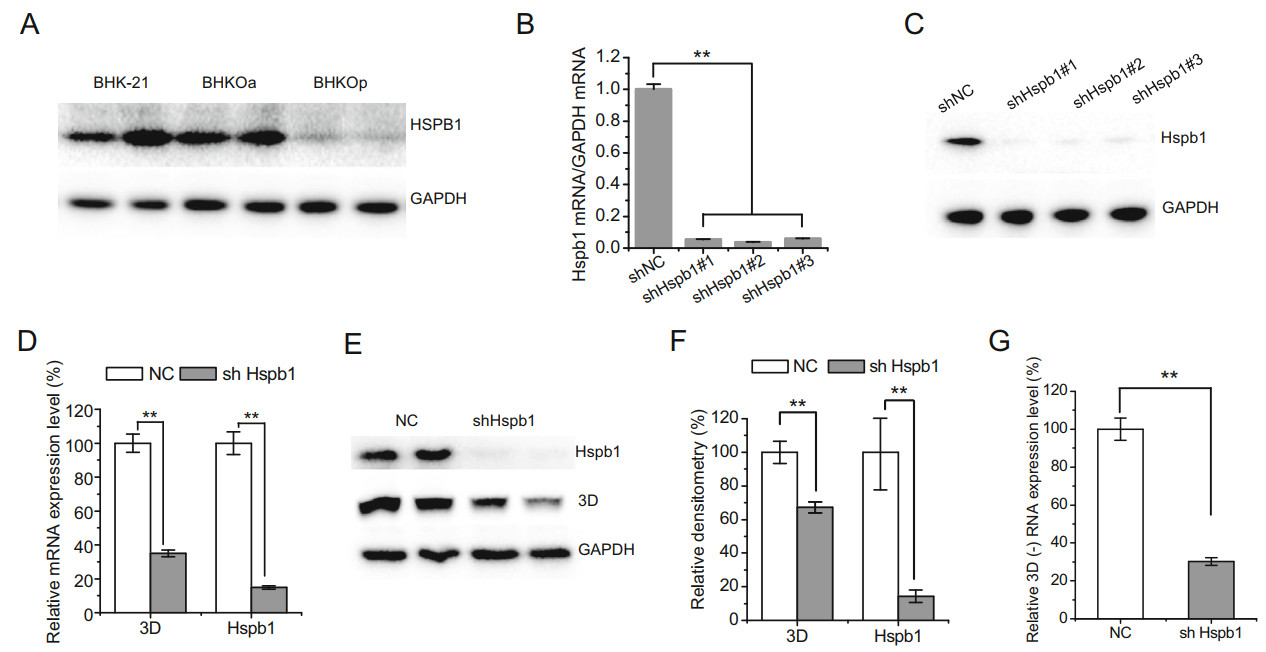
Figure 6. Hspb1 is beneficial for FMDV replication. For simplicity, BHK-21 cells acutely and persistently infected with serotype-O FMDV are abbreviated as BHKOa and BHKOp, respectively. A Protein expression levels of Hspb1 in mock, acutely, and persistently infected BHK-21 cells. B, C BHK-21 cells were transfected with pSUPER-NC or pSUPER-shHspb1 #1, #2, or #3 for 48 h. The mRNA and protein expression levels of Hspb1 were examined by RT-qPCR and Western blot analysis, respectively. D, E BHK-21 cells were transfected with pSUPER-shHspb1 #1 and pSUPER-NC for 24 h and then infected with FMDV at 10-3 TCID50/cell. The mRNA and protein expression levels of 3D and Hspb1 were examined 24 h post infection. F Relative densitometry quantification of 3D protein expression level was quantified by Image Lab software. G BHK-21 cells were transfected with pSUPER-shHspb1 and pSUPER-NC for 24 h and then infected with FMDV at 10-3 TCID50/cell. The relative expression levels of negative stand RNA of 3D were examined 24 h post infection. Relative expression levels were normalized against GAPDH. Three independent replicates were conducted for each sample. Data are expressed as the mean ± SE (n = 3). **P < 0.01.
Analysis of DEGs
GO and KEGG Enrichment Analysis
Differences of Ribosome- and Translation-Related Gene Expression between Acutely and Persistently Infected BHK-21 Cells
Differences in Expression of Immune-Related Genes in Acutely and Persistently Infected BHK-21 Cells
Analysis and Verification of DEGs in Acutely and Persistently Infected Cells
Hspb1 is Critical For FMDV Replication
-
Persistent FMDV infection is significantly different from acute infection. Variations in genomic nucleotide sequence and amino acid replacements in capsid proteins occur in persistent viruses (Toja et al. 1999; Diez et al. 1990). In addition, extensive cellular heterogeneity occurs in host cells persistently infected with FMDV (De la Torre et al. 1989). Variations in host cells are thought to be the dominant factor accounting for the establishment of persistent infection (Hernandez et al. 1994). However, there is little published information about variations in host gene expression between acutely and persistently infected cells. We previously examined such gene differences using microarray technology (Zhang et al. 2013). However, only 1676 DEGs were identified in this previous study because of limitations in our detection method and use of Homo sapiens as the reference genome. In the current study, the number of DEGs increased by four-fold due to rapid advances in RNA-Seq and appropriate selection of the reference genome. Our results indicate a dramatic difference in gene expression between acutely and persistently infected BHK-21 cells.
Our previous work revealed that persistently infected BHK-21 cells acquired more resistance to FMDV infection than wild-type BHK-21 cells. Such resistance makes cell insensitive to virus, which may be the reason for the establishment and survival of persistently infected cells. Different gene expression level in acutely and persistently infected BHK-21 cells can regulate cell sensitivity to virus. Therefore, DEGs may play a critical role in the establishment of persistent infection. To understand the biological functions of DEGs, GO enrichment analysis was performed (Fig. 2A). In the cellular component category, a large number of terms were significantly enriched including nucleus, intracellular, and organelle. This may reflect the induction of cell lysis by FMDV 24 h after acute infection. By contrast, a cytopathic effect was not found in persistently infected BHK-21 cells. In the biological process and molecular function categories, terms associated with ribosome and biosynthesis were significantly enriched. The ribosome pathway was also significantly enriched in KEGG enrichment analyses (Fig. 2B). Ribosomes play an important role in protein translation, which is an important part of biosynthesis. Therefore, ribosome- and translationrelated genes may play critical roles in the establishment of persistent infection.
To compare ribosome- and translation-related gene expression in acutely and persistently infected BHK-21 cells, we examined the expression levels of RPL, RPS, EIF, and EEF genes (Table 1) as described in a previous report (Pellagatti et al. 2008). Most of the above genes were down-regulated in persistently infected BHK-21 cells (Fig. 3A). Thus, these genes appear to be necessary for persistent infection. FMDV uses the host cellular translation machinery to translate its proteins (Grubman and Baxt 2004). Persistently infected BHK-21 cells could inhibit viral translation by suppressing their own translation, which may be a vital survival strategy. Similarly, cells affected with dengue virus can inhibit viral replication by suppressing pyrimidine biosynthesis (Wang et al. 2011c). However, much work remains to fully unveil the roles of ribosome- and translation-related genes in FMDV persistent infection.
Endocytosis was also enriched in KEGG enrichment analyses (Fig. 2B). Cell entry of FMDV occurs through clathrin-dependent endocytosis (Berryman et al. 2005). FMDV is sensitive to acidic conditions (Curry et al. 1995) and can be inhibited by increasing endosomal pH (Carrillo et al. 1984; Baxt 1987). Therefore, the persistently infected BHK-21 cell line in our lab was established with the help of ammonium chloride, which can neutralize the acidic endolysosome compartments. DEGs may regulate cell sensitivity to infection by regulating the process of endocytosis, which may contribute to the establishment of persistent infection. However, the relationships between DEGs related to endocytosis and viral replication remain poorly understood.
The immune response of host cells is essential for their resistance to and removal of virus. We examined the expression levels of immune-related DEGs in acutely and persistently infected BHK-21 cells. There were more differentially expressed immune-related genes during persistent infection than during acute infection (Table 2), indicating that more immune-related genes were activated by persistent infection. Persistently infected BHK-21 cells may strengthen their immune response and enhance viral resistance via regulating these DEGs. Among the DEGs identified in acutely and persiste
Among the DEGs identified in acutely and persistently infected BHK-21 cells, 274 genes were differentially expressed in both acutely and persistently infected cells compared with mock-infected BHK-21 cells. In particular, 56 genes were up-regulated in acutely infected cells but down-regulated in persistently infected cells (Fig. 5A). These DEGs may play important roles in FMDV replication. Knockdown of one of the 56 genes, Hspb1, in BHK- 21 cells dramatically suppressed FMDV infection (Fig. 6D–6F). In addition, the negative-strand RNA of 3D was significantly reduced when Hspb1 was knocked down (Fig. 6G).Thus, the host factor Hspb1 is critical for FMDV replication. Other DEGs identified in our study may also contribute to FMDV infection, and our future work will examine this possibility.
Our data reveal that gene expression is notably different between BHK-21 cells with acute versus persistent FMDV infection. The DEGs were significantly enriched for metabolism, biosynthesis, ribosome, and endocytosis functions. In persistently infected BHK-21 cells, DEGs related to ribosomes and translation were down-regulated. There were more differentially expressed immune-related genes during persistent infection than during acute infection. Hspb1, which is one gene that is up-regulated in acutely infected cells but down-regulated in persistently infected cells, had a critical role in FMDV replication. Therefore, alterations in host gene expression identified by comparative transcriptome analyses are crucial to understand host responses to acute and persistent FMDV infection.
-
We appreciate the discussion with Dr. Xun Liu (Huazhong University of Science and Technology). We acknowledge the financial support of the National Infrastructure of Natural Resources for Science and Technology Program (No.2011-572), the National Natural Sciences Foundation of China (No. 31370185), the National Basic Research Program of China (No. 2011CB504800) to Prof. Congyi Zheng, and the Fundamental Research Funds for the Central Universities (2042018kf0241) and the National Science and Technology Infrastructure Grants (NSTI-CR15 and NSTI-CR16) to Dr. Chao Shen.
-
JL, LH, CZ and CS contributed to experimental design; JL and YY performed the experiments; JL and MW contributed to data analysis; JL, CZ, YH and CS contributed to data interpretation; JL wrote the manuscript; XX, HW, FY, CS and CZ checked and finalized the manuscript. All authors read and approved the final manuscript.
-
The authors declare that they have no conflict of interest.
-
This article does not contain any studies with human or animal subjects performed by any of the authors.

 DownLoad: