


HTML
-
Swine influenza A virus (SIV) H1N1 caused the 1918 human influenza pandemic, resulting in approximately 50 million deaths (Lemon and Mahmoud 2005). Additionally, Hong Kong H3N2 flu killed one million people in 1968-1969 (Simonsen et al. 1998; Dangi and Jain 2012). From April 16 to April 29, 2018, 1252 (45.4%) specimens were identified by the World Health Organization Global Influenza Surveillance and Response System laboratories as influenza A (H3N2) (http://www.who.int). Moreover, in recent years, SIV has attracted much attention owing to its ability to infect humans. Pigs have surface receptors for both avian and human influenza viruses (Ito et al. 1998), and influenza viruses from humans and birds can recombine in pigs (Webster et al. 1992). Among the various subtypes of SIV, H3N2 and H1N1 strains exist in human populations and cause relatively high morbidity and mortality rates (Horimoto and Kawaoka 2005). Additionally, compared with H1N1, H3N2 infection is associated with human seasonal influenza with a higher epidemic severity index, and its frequency is increasing (Simonsen et al. 1997; Thompson et al. 2003). Although the pathogenesis of the H3N2 subtype has been extensively studied, the underlying molecular mechanisms mediating abnormal host responses are largely unknown.
Traditional studies of host transcriptional responses to pathogen infection have mostly focused on protein-coding genes. We previously reported mitochondrial proteomic analysis of human pulmonary parenchymal cells (A549 cells) infected with swine influenza virus strain H3N2 (Wu et al. 2013). We found altered expression of 24 host cell proteins (13 upregulated and 11 downregulated proteins) by two-dimensional gel electrophoresis; however, this approach was limited, and further studies are still needed to elucidate the related mechanisms.
Most mammalian genomes are transcribed into noncoding RNAs (ncRNAs), including small ncRNAs (< 200 bp) and long ncRNAs (lncRNAs; > 200 bp) (Costa 2010). With the development of high-throughput sequencing, genetic manipulation, and other biotechnologies, many functions of lncRNAs have been discovered. Studies have shown that lncRNAs play important roles in gene transcription, splicing, protein translation, protein localization, stem cell pluripotency, cell structural integrity, heat shock response, and human diseases (Szczesniak and Makalowska 2016). Moreover, lncRNAs have also been shown to have roles in innate immune responses (Carpenter et al. 2013; Ilott et al. 2014; Carpenter 2016; Jiang et al. 2018) and host–pathogen interactions (Barriocanal et al. 2014; Ouyang et al. 2014; Nishitsuji et al. 2016; Qiu et al. 2018; Tong et al. 2019). Although thousands of lncRNAs have been identified in mammalian genomes, only a few are associated with innate immunity against viral pathogenesis and influenza viruses. Importantly, lncRNAs induced by influenza virus affect several host biological processes and can also regulate infection. In addition, lncRNAs influence the feedback mode of viral infection by mediating metabolism (Wang et al. 2017). However, our understanding of the specific functions of lncRNAs in influenza A virus (IAV) infection is still limited.
Therefore, to explore the function of lncRNAs in cells upon H3N2 infection, lncRNA expression profiles were analyzed in A549 cells infected with mock or H3N2 by high-throughput sequencing technology. Our data provide important insights into the interactions between host lncRNAs and H3N2 infection.
-
Influenza strain A/swine/Zhejiang/04/H3N2 was stored in our laboratory. A549 cells were cultured in 100-mm cell bottles, grown to approximately 80%–90% confluence, and infected with H3N2 at a multiplicity of infection (MOI) of 10. After 2 h of incubation, the culture medium was removed, and infected cells were maintained in fresh medium containing 2% fetal bovine serum. The viral titer was measured by indirect immunofluorescence assay (IFA) using monoclonal antibodies against IAV M2 protein (Feng et al. 2018) at 12, 18, 24, and 36 h post-infection (hpi). The 50% tissue culture infectious dose (TCID50) was determined by the Reed-Muench method (Xue et al. 2016). Uninfected A549 cells were used as a control. H3N2- infected and mock-infected cells were harvested at 24 hpi and cryopreserved at - 80 ℃ for subsequent total RNA extraction. All samples were analyzed in duplicate. All virus experiments were carried out in a Biosafety Level 2 laboratory.
-
The total RNA was extracted using TRIzol reagent (Vazyme Biotech Company, China) according to the manufacturer's instructions. The concentration of total RNA was determined using a Nanodrop instrument (Thermo Fisher Scientific). RNA quality was assessed by determining the A260/A280 ratio, with a value of 1.8–2.0 indicating high quality. Ribo-zero-magnetic-kit (Epicentre, USA) was used to remove ribosomal RNA from the samples. RNA libraries were prepared using TruSeq RNA LT Sample Prep Kit v2 (Illumina, San Diego, CA, USA). Library sequencing was performed on an Illumina Hiseq 3000 platform (Illumina) by ShangHai Genergy Biotech (Shanghai, China). The RNA-sequencing data were deposited in the Gene Expression Omnibus database (accession number GSE135482).
-
Adaptors, low-quality reads, and poly-N were removed using Trim Galore software (http://www.bioinformatics.babraham.ac.uk/projects/). Quality control analysis was performed on clean data using FastQC software (http://www.bioinformatics.babraham.ac.uk/projects/fastqc/). The filtered reads were then mapped to the human reference genome (version: Homo_sapiens.GRCh38) using STAR software suite (Dobin et al. 2013). The transcripts were assembled with the mapped reads using StringTie (Pertea et al. 2015). The assembled transcripts from unknown intergenic transcripts (U), a transfrag falling entirely within a reference intron (I), exonic overlap with reference on the opposite strand (X), and an intron of the transfrag overlaps a reference intron on the opposite strand were identified as novel lncRNAs. The coding ability of lncRNAs was predicted using four tools, including a predictor of lncRNAs and mRNAs based on k-mer scheme (PLEK) (Li et al. 2014), Coding-Non-Coding-Index (CNCI) (Sun et al. 2013), Coding Potential Calculator (CPC) (Kong et al. 2007), and Coding Potential Assessment Tool (CPAT) (Wang et al. 2013). The differentially expressed lncRNAs in H3N2-infected and non-infected groups were analyzed using DESeq2 (Love et al. 2014).
-
Cis- and trans- analyses were implemented to predict the target genes of differentially expressed lncRNAs. The known protein-encoding genes located within a 100-kb window upstream or downstream of lncRNAs were identified as cis target genes. Co-expressed coding genes were classified as trans-regulated target genes of differentially expressed lncRNAs. GO enrichment analysis of lncRNA target genes was performed using the TopGO package (https://www.bioconductor.org/packages/release/bioc/html/topGO.html). The associated pathways of cis- or trans-regulatory target genes of the dysregulated lncRNAs were predicted by Kyoto Encyclopedia of Genes and Genomes (KEGG) database. The statistical criteria in the analysis were as follows: P < 0.05 and false discovery rate (FDR) < 0.05. GO enrichment analysis of dysregulated mRNAs was performed using the TopGO package. The associated pathways of the dysregulated mRNAs were predicted by KEGG database. The statistical criteria in the analysis were as follows: P < 0.05 and FDR < 0.05.
-
In order to validate the results of high-throughput sequencing, RT-qPCR analysis was used to identify differentially expressed lncRNAs. The glyceraldehyde 3-phosphate dehydrogenase (GAPDH) gene was used as an internal standard. The primer sequences are presented in Supplementary Table S1. RT-qPCR was carried out using AceQ qPCR SYBR Green Master Mix (Vazyme, China) according to the manufacturer's instructions. The relative expression level of each lncRNA was calculated by the 2-ΔΔct method. All samples were analyzed in triplicate. Statistical analyses were performed using Student's t tests.
Cell Culture, Virus Infection and Preparation of Sequencing Samples
RNA Isolation
Bioinformatic Analyses
Target Prediction of lncRNAs and Functional Analyses
Real-Time Quantitative (qPCR) Analysis of lncRNAs
-
To determine the propagation kinetics of H3N2 in A549 cells, we measured the viral titers at various time points after infection. Cells were infected with H3N2 at an MOI of 10 and then monitored by IFA at 12, 18, 24, and 36 hpi. The viral titer gradually increased at 12, 18, and 24 hpi and reached a maximum (105.7 TCID50/mL) at 24 hpi (Supplementary Fig. S1A and S1B). Based on these results, we selected cells infected with an MOI of 10 after 24 hpi for transcriptome analysis.
-
High-throughput RNA-seq was performed to determine the expression levels of lncRNAs in A549 cells infected with H3N2 or uninfected (mock). More than 258 billion raw base reads were generated for each sample using an Illumina Hiseq platform. After removing adaptor and lowquality sequences, average size of each clean read was 135 nt, and the clean data Q30 was above 93.45% (Supplementary Table S2).
Based on various criteria, including the specific location in genome, multiple exons, length greater than 200 nt, and noncoding characteristics, transcripts were filtered by three steps to identify the annotated and novel lncRNAs. In total, 3031transcriptswere identifiedasnovel lncRNAs(Fig. 1A).
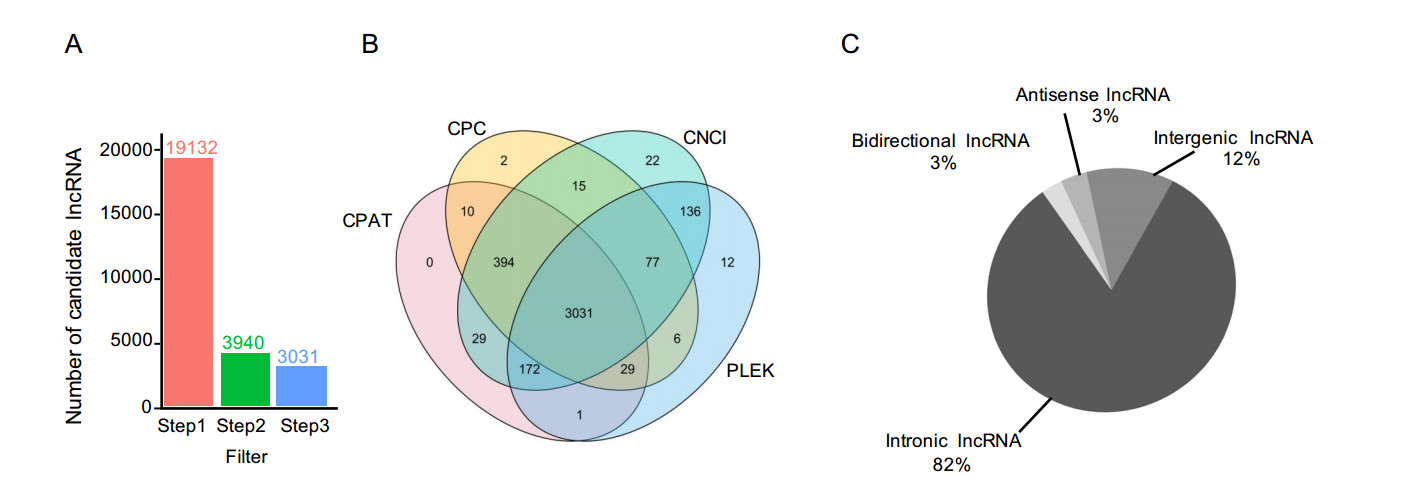
Figure 1. Identification of novel lncRNAs in H3N2-infected or non-infected cells. A LncRNA screening statistics in H3N2-infected or non-infected groups. B Evaluating the coding potential using four tools. C Classification of lncRNAs based on genomic location.
Next, protein-coding or noncoding transcripts were classified using four tools, i.e., CPAT, PLEK, CNCI, and CPC (Fig. 1B). Additionally, according to the corresponding genomic locations of transcripts of known protein-coding genes, newly identified lncRNAs were categorized into four groups, i.e., intronic lncRNAs (82%), intergenic lncRNAs (12%), antisense lncRNAs (3%), and bidirectional lncRNAs (3%; Fig. 1C).
Hierarchical clustering was performed to analyze the lncRNA expression profiles in H3N2-infected or noninfected cells. Obviously, expression levels of lncRNAs were significantly altered after H3N2 infection (Fig. 2A). In total, 6129 lncRNAs were differentially expressed, including 4963 upregulated lncRNAs and 1166 downregulated lncRNAs (fold change [FC] ≥ 2, P ≤ 0.05; Fig. 2B) (Supplementary Table S3). Of the differentially regulated lncRNAs, 22 newly identified lncRNAs were altered, with log2(FC) values of more than 12, compared with the noninfected group. The lncRNA showing the greatest upregulation was MSTRG.18254.3, with a log2(FC) of more than 16; in contrast, the lncRNA showing the greatest downregulation was MSTRG.11930.8, with a log2(FC) of more than 14 (Table 1).
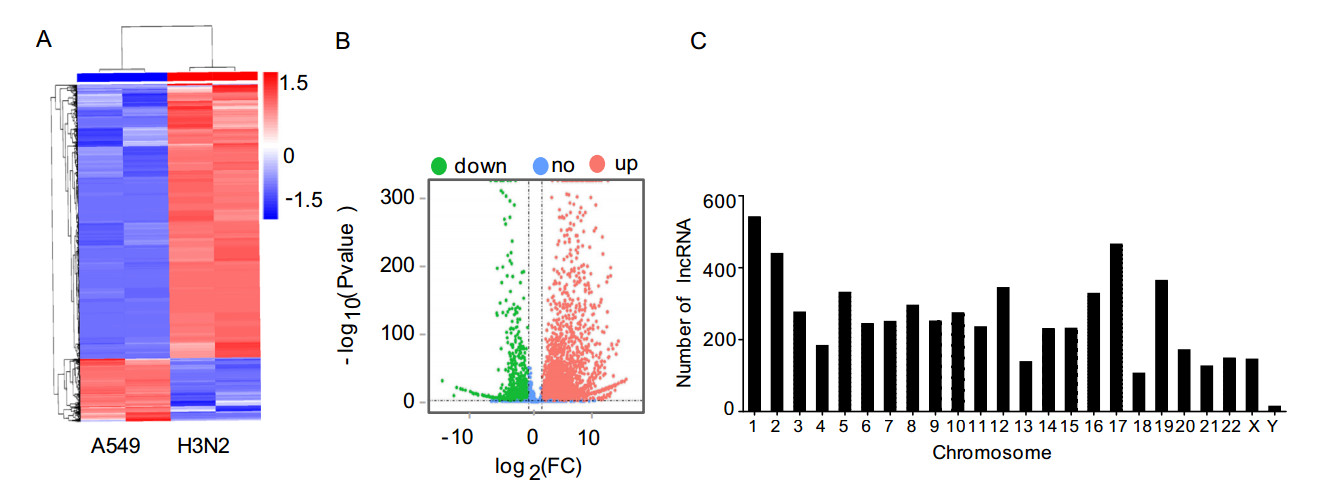
Figure 2. Characteristics of lncRNA expression levels between H3N2- infected and non-infected groups. A Differentially expressed lncRNAs were analyzed by hierarchical clustering. B Volcano plot displaying differentially expressed lncRNAs in the two groups. C Distribution of differentially expressed lncRNAs in each chromosome.
LncRNA ID Locus Regulation P value Log2(FC) MSTRG.11930.8 15:71487937-71532738 Down 2.86E-30 -14.10977625 MSTRG.11930.3 15:71442625-71547216 Down 5.31E-09 -12.33057588 MSTRG.9036.1 12:130884797-130905045 Up 2.12E-24 12.07586697 MSTRG.18254.4 19:50095703-50115987 Up 2.64E-16 12.0778888 MSTRG.35702.1 9:111973032-111993029 Up 6.28E-24 12.11163237 MSTRG.18254.8 19:50101833-50115910 Up 5.45E-23 12.12016728 MSTRG.18254.11 19:50110235-50151173 Up 2.33E-68 12.21266154 MSTRG.18148.9 19:47920256-47947180 Up 7.01E-25 12.23237036 MSTRG.18148.7 19:47914962-47952571 Up 4.05E-82 12.3091667 MSTRG.18149.14 19:47927354-47944128 Up 1.4E-26 12.60624992 MSTRG.14746.1 17:31785546-31828849 Up 9.1E-87 12.62649567 MSTRG.18149.3 19:47911586-47949487 Up 2.18E-28 13.01068919 MSTRG.18149.4 19:47911586-47954970 Up 1.31E-28 13.07130734 MSTRG.18254.9 19:50104896-50151173 Up 2.39E-29 13.17550951 MSTRG.18254.7 19:50101833-50142753 Up 2.42E-29 13.51465658 MSTRG.15643.1 17:67298574-67317698 Up 2.16E-32 13.77495727 MSTRG.18254.13 19:50120946-50151173 Up 1.48E-40 15.22589906 MSTRG.18254.14 19:50126300-50151173 Up 1.49E-40 15.22595034 MSTRG.18254.15 19:50131635-50151173 Up 1.45E-40 15.22769837 MSTRG.18254.3 19:50095703-50137465 Up 5.14E-46 16.09175095 Table 1. The top 20 differentially expressed lncRNAs in H3N2-infected cells.
The differentially expressed lncRNAs were widely distributed in all chromosomes, although the numbers varied in different chromosomes. Most altered lncRNAs were located on chromosome 1, whereas few altered lncRNAs were located on chromosome Y (Fig. 2C).
-
We also detected mRNA expression levels of A549 cells after H3N2 infection. Hierarchical clustering showed that the mRNA expression profiles were significantly altered in the H3N2-infected group compared with that in the noninfected group (Fig. 3A). In total, 50, 031 mRNA transcripts were found to be differentially expressed in A549 cells infected with H3N2 (FC ≥ 2, P ≤ 0.05) (Supplementary Table S4). Of the differentially expressed mRNA transcripts, 20, 907 were upregulated, and 29, 124 were downregulated (Fig. 3B). Moreover, 833 genes were upregulated with a FC of more than 100 after infection. In our study, the gene showing the greatest upregulation was RPL4, with a log2(FC) of 12.3, whereas the gene showing the greatest downregulation was EGFR, with a log2(FC) of -14.2 (Table 2).
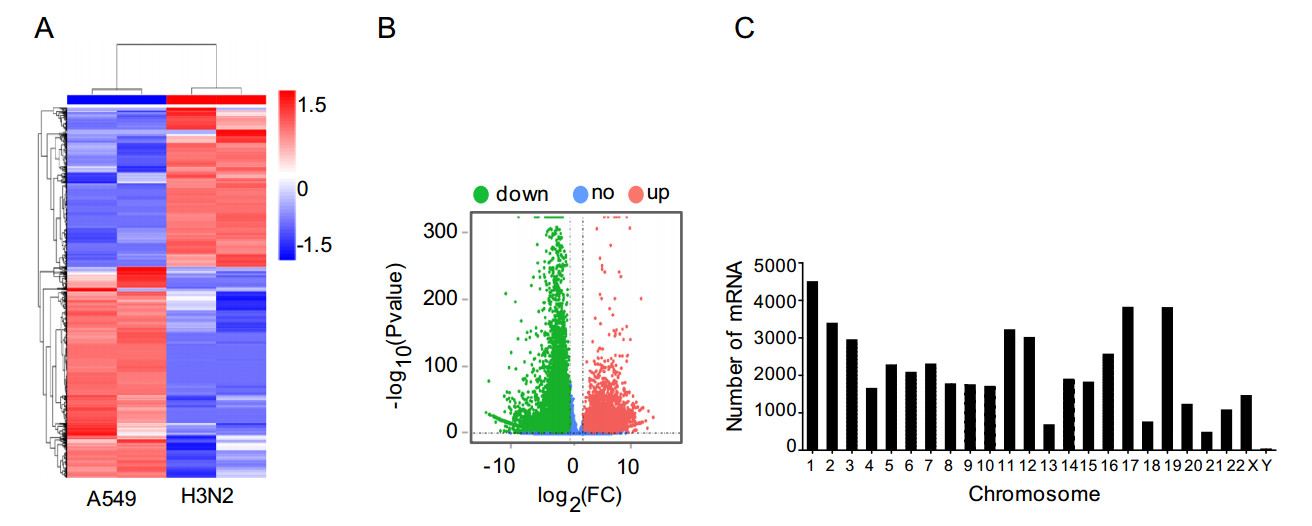
Figure 3. Characteristics of mRNA expression levels between the H3N2-infected and non-infected groups. A Differentially expressed mRNAs were analyzed by hierarchical clustering. B Volcano plot displaying differentially expressed mRNAs in the two groups. C Distribution of differentially expressed mRNAs in each chromosome.
Gene symbol Ensembl ID Locus Regulation P value Log2(FC) EGFR ENST00000275493 7:55019101-55211628 Down 2.26E-31 - 14.2050352 AKR1C3 ENST00000605149 10:5077638-5107680 Down 5.19E-77 - 13.7632822 ACTN4 ENST00000440400 19:38724157-38731583 Down 9.31E-29 - 13.67219 PDXK ENST00000468090 21:43719097-43762307 Down 3.61E-28 - 13.6668779 DDX3X ENST00000457138 X:41333398-41350269 Down 3.37E-27 - 13.5112125 NCOR2 ENST00000429285 12:124324598-124535603 Down 5.66E-26 - 13.067891 VPS13C ENST00000395898 15:61867744-62060448 Down 8.61E-26 - 13.039242 SYNE2 ENST00000344113 14:63852983-64226433 Down 7.50E-26 - 13.038538 NFIC ENST00000589123 19:3359563-3469217 Down 1.46E-25 - 12.9738161 CD109 ENST00000287097 6:73696104-73828313 Down 1.50E-25 - 12.9729377 SCRN1 ENST00000426154 7:29920104-29990118 Down 4.07E-25 - 12.8686194 ITGAV ENST00000374907 2:186590080-186680897 Down 4.42E-25 - 12.8600254 ALDOA ENST00000338110 16:30053090-30070414 Down 1.97E-24 - 12.8504503 CANX ENST00000452673 5:179698906-179730925 Down 6.74E-25 - 12.8175625 PCDH9 ENST00000377861 13:67201015-67230445 Down 1.70E-24 - 12.7330165 ADD2 ENST00000264436 2:70656784-70768177 Down 1.63E-24 - 12.7275731 APP ENST00000354192 21:25880550-26170747 Down 7.25E-18 - 12.6405452 CIT ENST00000261833 12:119685791-119877288 Down 4.86E-24 - 12.6196307 PMEPA1 ENST00000265626 20:57648394-57711536 Down 7.01E-24 - 12.5766746 RPL4 ENST00000561775 15:66499346-66504827 Up 6.13E-24 12.03161073 Table 2. The top 20 differentially expressed mRNA in H3N2-infected cells.
Similar to the distribution pattern of lncRNAs, the differentially expressed genes in H3N2-infected A549 cells were unevenly distributed among chromosomes. Most altered mRNAs were found on chromosome 1, whereas few altered mRNAs were found on chromosome Y (Fig. 3C).
-
Next, we systematically analyzed the basic features of the lncRNAs and compared them with protein-coding genes. The lengths of lncRNA transcripts were longer than those of mRNAs (Fig. 4A). Additionally, the number of exons of lncRNAs was lower than that of mRNAs (Fig. 4B).
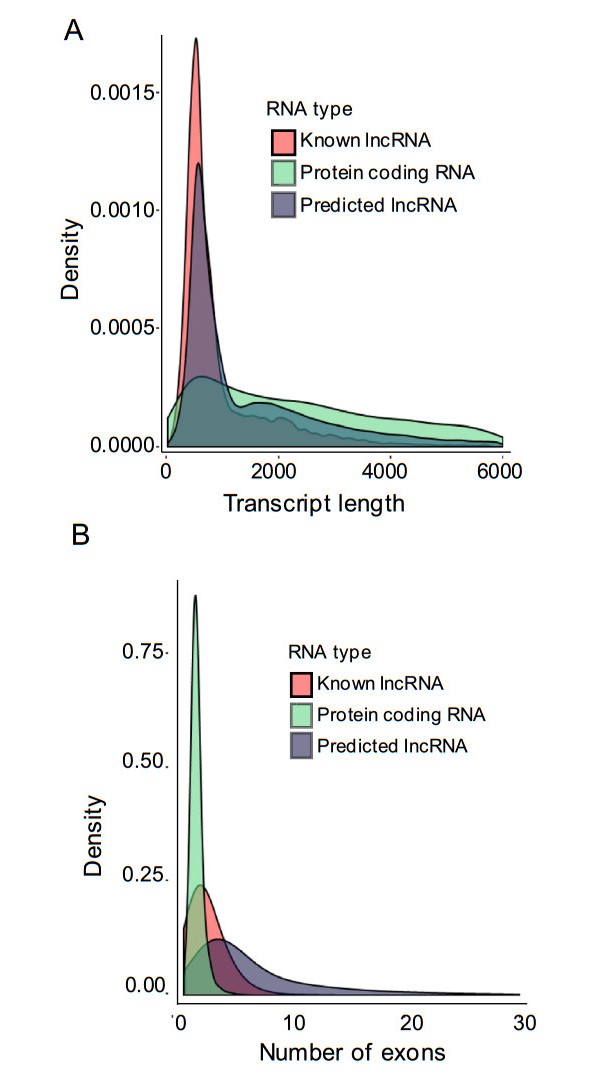
Figure 4. Genomic features of lncRNAs and mRNAs in H3N2-infected cells. A Length distribution of lncRNAs and mRNAs. B Comparison of exon numbers between lncRNA and mRNAs.
-
To better understand the roles of differentially expressed lncRNAs in H3N2-infected cells, GO and KEGG pathway analyses were used to explore the functions of cis- and trans- target genes of H3N2-induced lncRNAs. The results showed that the target genes of these lncRNAs were significantly enriched in biological processes, such as cellular metabolism. The top 20 significant GO terms are listed in Fig. 5A, 5B. The target genes of these differentially expressed lncRNAs participated in various signaling pathways, such as the B cell receptor signaling pathway and autophagy. The top 20 statistically significant enriched KEGG pathways are shown in Fig. 5C, 5D. These findings suggested that the induced lncRNAs regulated cellular metabolic processes, immunity, and autophagy during H3N2 infection. Because many genes were enriched in the cellular metabolic pathway, we further selected 10 of the most dysregulated lncRNAs to generate the cis- or transregulatory networks (shown in Fig. 5E, 5F).
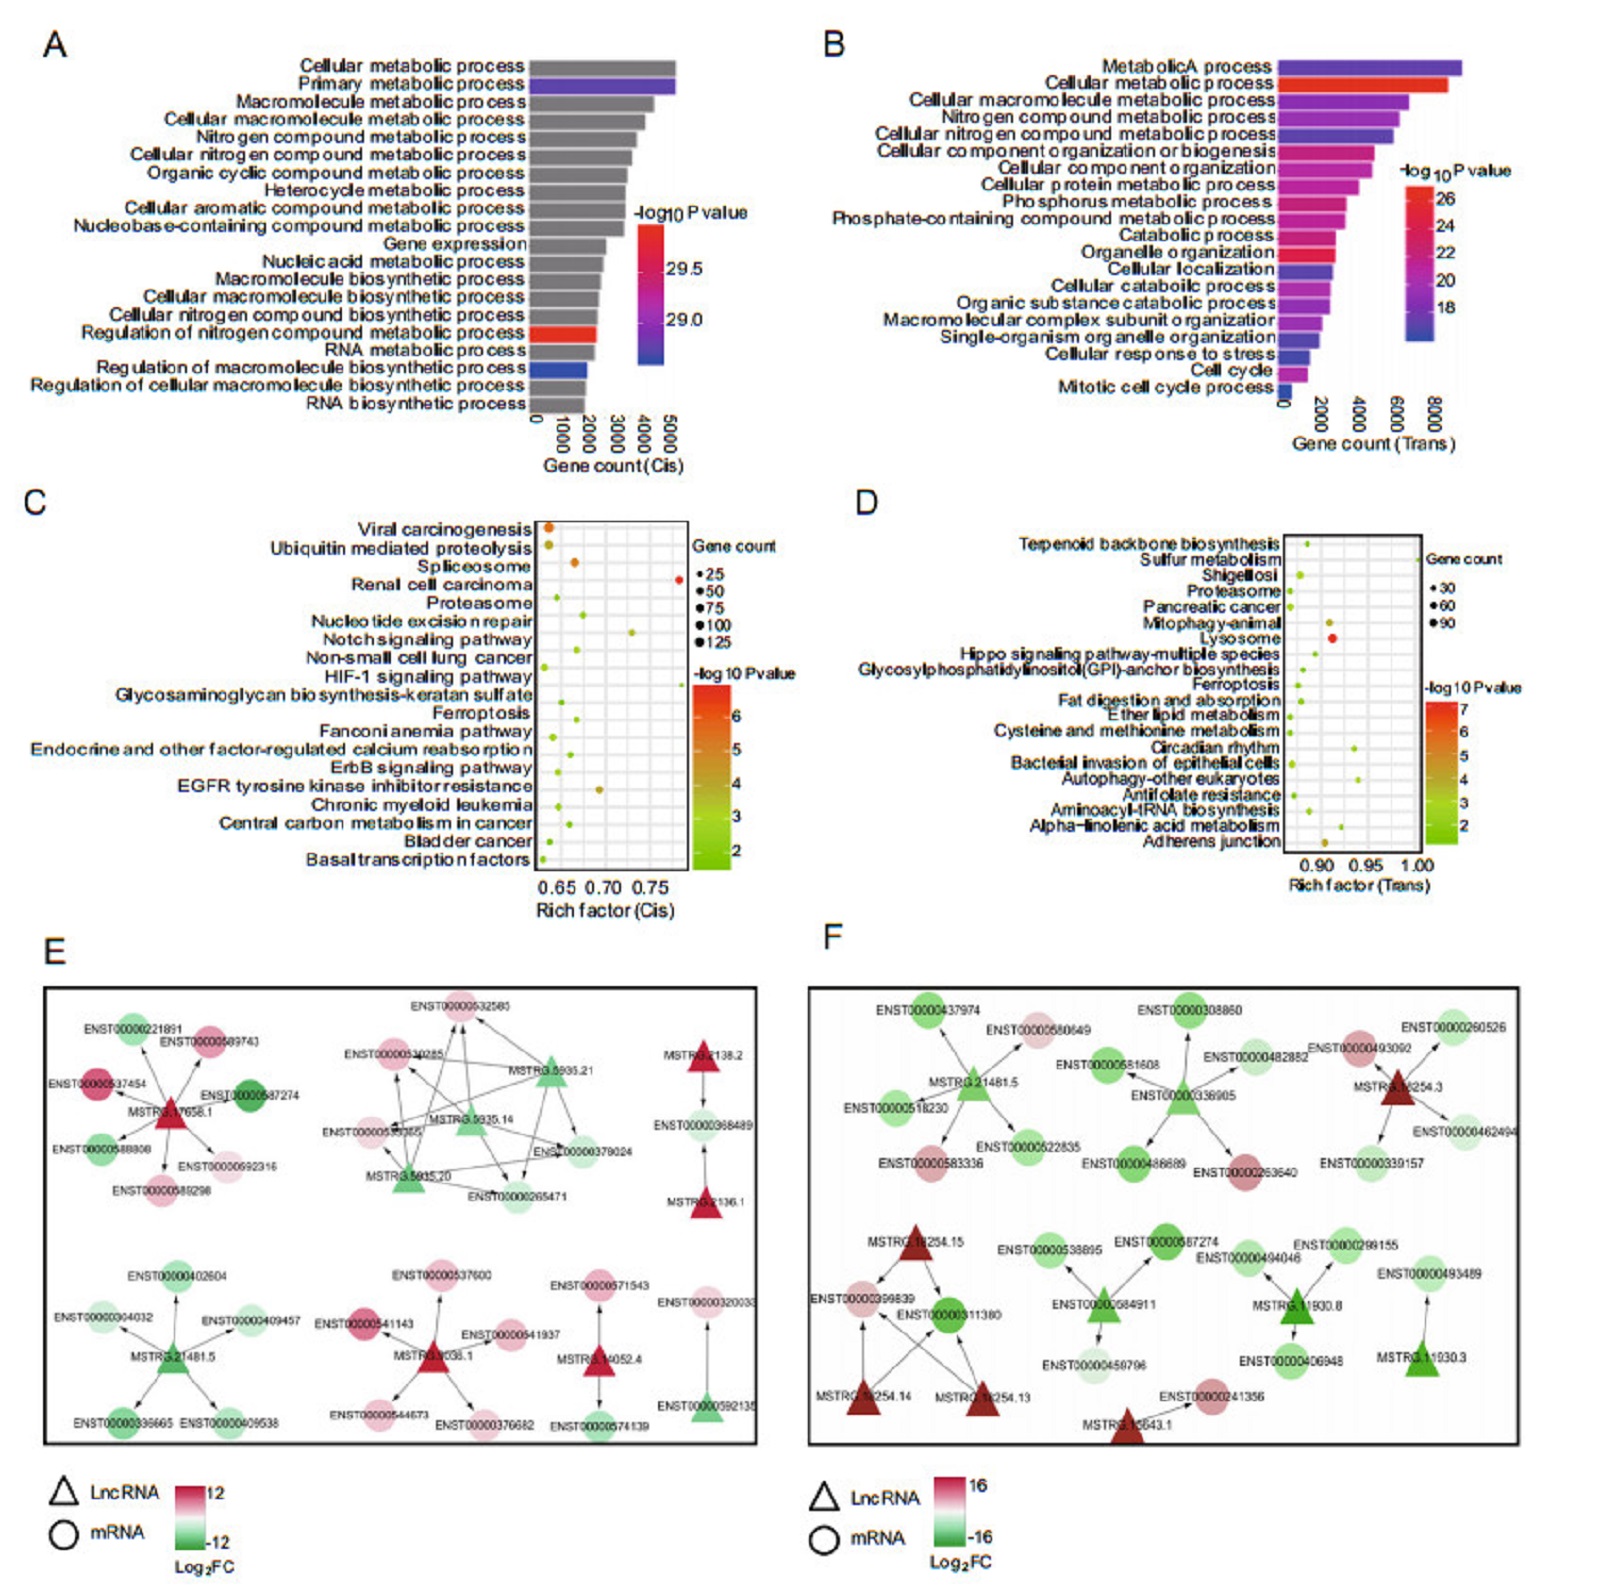
Figure 5. GO enrichment and KEGG pathway analyses of target genes of H3N2-induced lncRNAs. A Top 20 significant GO biological process terms by cis-regulation. B Top 20 significant GO biological process terms by trans-regulation. C Top 20 significantly enriched pathways terms by cis-regulation. D Top 20 significantly enriched pathways terms by trans-regulation. E Cis-regulatory network of lncRNAs-mRNAs, F trans-regulatory network of lncRNAs/mRNAs. LncRNAs are represented as triangles, and mRNAs are represented as circles. Red nodes indicate upregulation, blue nodes indicate downregulation, and color shade indicates different degrees of dysregulation.
-
Dysregulated mRNAs in H3N2-infected cells were used for GO enrichment and KEGG pathway analyses. As shown in Fig. 6A, the majority of the dysregulated mRNAs were significantly enriched in some biological processes, such as cellular metabolic process, organic cyclic compound metabolic process, and cellular macromolecule metabolic process, suggesting that H3N2 infection had a profound effect on cellular metabolism in A549 cells. Furthermore, KEGG functional analyses showed that dysregulated mRNAs were significantly enriched in some pathways (Fig. 6B), including citrate cycle (tricarboxylic acid [TCA] cycle), DNA replication, biosynthesis of unsaturated fatty acids, and autophagy. Taken together, these results suggested that the differentially expressed mRNAs belonged to multiple pathways.
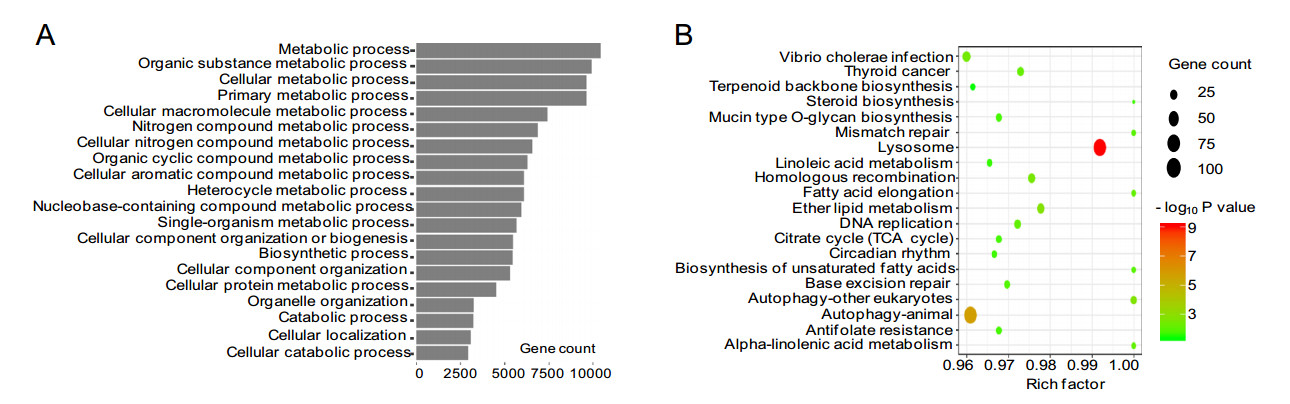
Figure 6. A Top 20 significant GO biological processes of differentially expressed mRNAs. B Top 20 significantly enriched pathways terms of differentially expressed mRNAs.
-
RT-qPCR was performed to further detect differentially expressed lncRNAs in sequencing data. Among the 6129 differentially expressed lncRNAs, we validated seven upregulated and two downregulated lncRNAs by RT-qPCR (Fig. 7A) and RT-PCR (Fig. 7B). The results showed that changes in lncRNAs expression levels were consistent with RNA-seq data. Moreover, we also tested the reported lncRNAs, and the results were consistent with the literature (Fig. 7B, 7C).
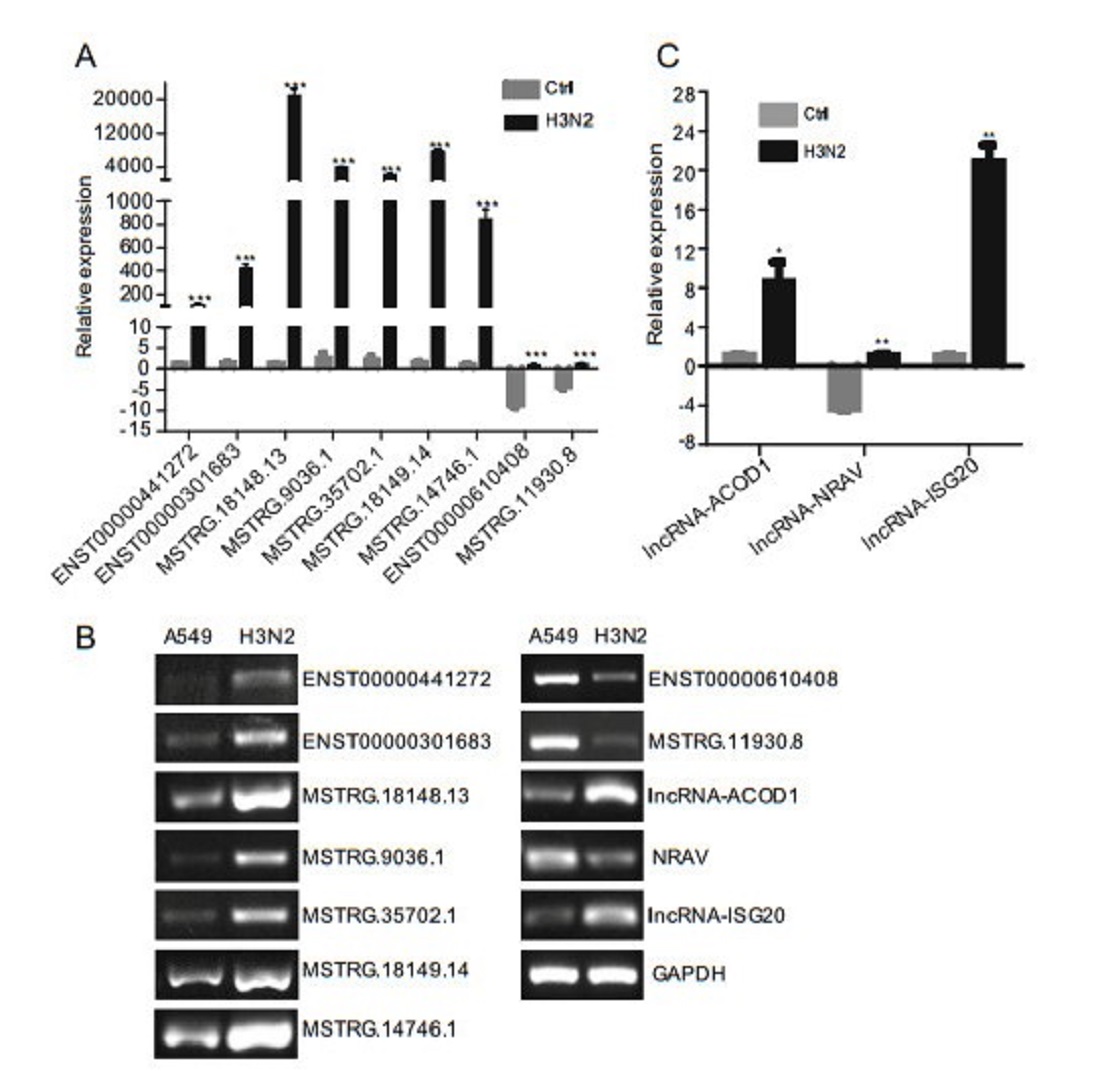
Figure 7. Validation of differentially expressed lncRNAs and reported lncRNAs by RT-qPCR and RT-PCR. p < 0.05 (*), < 0.01 (**), and < 0.001 (***) were considered statistically significant. A Validation of differentially expressed lncRNAs by RT-qPCR, B validation of differentially expressed lncRNAs and reported lncRNAs by RT-PCR and C validation of reported lncRNAs by RT-qPCR.
Replication Kinetics of H3N2 Virus in A549 Cells
RNA-seq and Identification of Differentially Expressed lncRNAs
Differential Expression of mRNAs in A549 Cells between Mock- and H3N2-infected Groups
Genomic Features of lncRNAs and mRNAs in A549 Cells
Functional Prediction of H3N2-induced lncRNAs
GO and KEGG Pathway Analyses of the Dysregulated mRNAs Induced by H3N2
Validation of Differentially Expressed lncRNAs by RT-qPCR
-
Traditional studies of host cell responses to influenza infection have mainly focused on protein-coding genes. Recently, several studies have shown that lncRNAs regulate virus replication by mediating host gene expression. For example, the lncRNA NRAV negatively regulates the initial transcription of multiple critical interferonstimulated genes by affecting histone modification and significantly promotes IAV replication (Ouyang et al. 2014). Additionally, the lncRNA NEAT1, which is induced by influenza virus, is essential for the formation of nuclear body paraspeckles and thereby facilitates the expression of antiviral genes, including cytokines such as interleukin-8 (IL-8), probably through relocating transcriptional regulator splicing factor proline/glutamine-rich (a NEAT1-binding paraspeckle protein) from the IL-8 promoter to the paraspeckles (Imamura et al. 2014). Previous studies have also shown that the lncRNA Bst2/BISPR, which is induced by an influenza virus lacking NS1, is unable to block the interferon response. This lncRNA is located in genome close to BST and positively regulates the expression of BST2, but does not affect the expression of other genes adjacent to BST2 (Barriocanal et al. 2014). VIN, a large intergenic lncRNA induced by several IAV strains, including H1N1, H3N2, and H7N7, promotes influenza virus replication (Winterling et al. 2014). In this study, we found that 6129 lncRNAs and 50, 031 mRNA transcripts were differentially expressed. Because several lncRNAs have been identified as modulators in virus-induced host responses, we predicted that these lncRNAs may play crucial roles in regulating the host response to IAV, although the mechanisms require further exploration.
Notably, in this study, the functions of lncRNAs were predicted according to their cis- or trans-target genes. GO terms were significantly enriched in biological processes, such as RNA processing, cell cycle, and cellular metabolic process, suggesting that lncRNAs induced by H3N2 infection may regulate metabolism and affect H3N2 replication. To date, several studies have suggested that viruses regulate host metabolism to affect virus replication. Influenza virus manipulates sphingolipid metabolism and increases the level of sphingosine kinase 1 to promote virus replication (Vijayan and Hahm 2014). Human cytomegalovirus (HCMV) requires glycolysis for replication of the viral genome (McArdle et al. 2011), and rhinovirus infection results in extensive alterations in cellular metabolism essential for viral replication, including enhancing utilization and uptake of glucose as well as enhancing nucleotide synthesis and lipogenesis (Gualdoni et al. 2018). HCMV and herpes simplex virus-1 (HSV-1) both induce major metabolic alterations in their host cells, and HCMV profoundly enhances TCA compound levels and alters pathways that generate substrates for lipid metabolism essential for its replication. Moreover, HSV-1 upregulates pyrimidine nucleotide biosynthesis for its replication (Vastag et al. 2011). LncRNAs regulate metabolic enzymes to affect virus replication. The lncRNA ACOD1 is induced in cells infected with various viruses and can bind the metabolic enzyme glutamic-oxaloacetic transaminase, increased its catalytic activity, and facilitate the production of metabolites that promote viral propagation (Wang et al. 2017).
In addition to metabolism, KEGG pathway analysis showed that target genes of differentially expressed lncRNAs were enriched in autophagy. IAV infection plays complex roles in regulating autophagy. Indeed, IAV induces the formation of autophagosomes in rapamycintreated Madin-Darby canine kidney cells (Tanida et al. 2008; Zhou et al. 2009). Additionally, several viral proteins are involved in the induction of autophagy. For example, M2 protein alone is able to induce the initial steps of autophagosome formation (Gannage et al. 2009; Zhou et al. 2009; Zhirnov and Klenk 2013), viral HA protein can slightly activate autophagy, and NS1 induces autophagy indirectly by promoting the synthesis of HA and M2 proteins (Zhirnov and Klenk 2013). Moreover, IAV infection inhibits the degradation of autophagosomes by blocking their fusion with lysosomes (Gannage et al. 2009). Therefore, IAV likely regulates autophagy through lncRNAs.
In summary, in this study, we analyzed the expression profiles of lncRNAs in A549 cells infected by H3N2 for the first time. In total, 6129 lncRNAs were differential expressed in H3N2-infected A549 cells compared with that in normal cells. These results indicated that lncRNAs played regulatory roles in metabolism, autophagy, and other related pathways following H3N2 infection. Further studies will be needed to determine the roles of these lncRNAs play in H3N2 infection, and that may lead to novel vaccines developments for preventing IAV.
-
This study is supported by grants from the National Key technology R&D Program of China (Grant No. 2015BAD12B01), the China Agriculture Research System (Grant No. CARS-40-K13) and the National Science Foundation of China (Grant No. 31502084).
-
JZ and YZ designed the experiments and wrote the paper. YZ performed the majority of the experiments. TY and YD analyzed the data. YL prepared the sequencing samples. JL verified sequencing results and BH edited pictures.
-
All authors declare that they have no conflict of interest.
-
This article does not contain any studies with human or animal subjects.

 DownLoad: