


HTML
-
Prion diseases (PrDs) are a group of rapidly progressive neurodegenerative disorders caused by misfolded aggregated infectious prion proteins called prion (Prusiner 1998). Similar diseases have been reported in various animals: scrapie in sheep and goat, mad cow disease in cattle, chronic wasting disease in deer, elk and moose. Sporadic Creutzfeldt–Jakob disease (sCJD) is the most common type of human prion diseases. Similar neuropathological features are observed in the prion diseases of human and animals. The deposits of prions in brain are associated with cortical spongiform degeneration, neuronal loss and active gliosis of microglia and astrocytes which are the principal immune cells in the central nervous system (CNS) (Aguzzi et al. 2013; Armstrong et al. 2001). Moreover, there is no detectable specific adaptive immune response during prion infection, because the scrapie-like prion protein (PrPSc) that is the pathogen of prion diseases, and the normal or cellular prion protein (PrPC) share the same amino acid sequence with PrPSc (Bockman et al. 1987).
The innate immune system is a rapid and coordinated cellular defense response that aims to eliminate the threat posed by both sterile and infectious insults. As an important component of the innate immune system, activated glia cells and their produced various cytokines may contribute to the progress of the disease. In fact, many studies have reported that the innate immune system can be activated in the CNS of patients suffering of neurodegenerative diseases caused by aberrant deposits of aggregated proteins, including amyloid-β, α-synuclein, and prions (Gasque et al. 2000). Abnormal upregulations of many cytokines are described in the brains of various scrapie-infected experimental mouse models, as well as in the cerebral spinal fluid (CSF) and brains of CJD patients with, namely, interleukin 1α (IL1α), IL1β, tumor necrosis factor (TNF), IL6, transforming growth factor β (TNFβ), chemokine (C-X-C motif) ligand 10 (CXCL10, interferon gamma-induced protein 10, IP10), chemokine (C-C motif) ligand 2 (CCL2), CCL3, CCL4, CCL5, CCL6, CCL9, CCL12, CXCL9, CXCL13 (Boshtam et al. 2017; Felton et al. 2005; Gossner et al. 2006; Lu et al. 2004; Saas et al. 1999; Schultz et al. 2004; Tribouillard-Tanvier et al. 2009; Völkel et al. 2001; Xie et al. 2013; Yang and Jin 2018). However, many other studies were not consistent regarding the transcriptional level and the translational level of these cytokines (Brown et al. 2003; Campbell et al. 1994; Felton et al. 2005; Kim et al. 1999; Schultz et al. 2004).
A dozen of cytokines, which are rarely mentioned or controversially discussed, were analyzed from the brains of mice infected by various strains of scrapie in the present study. Significant upregulations of IP10, KC and M-CSF were detected in the brain lysates of mice infected by many strains of scrapie by Luminex assay using commercial kits. The cytokine upregulations were further validated by ELISA and immunohistochemical assay (IHC). Increased specific mRNAs of IP10, KC and M-CSF in the brains of scrapie infected mice were also detected by individual specific qRT-PCRs and IP10-specific digital PCR. Analyses of the brain samples collected at different time points during the incubation period of scrapie infection revealed a-dependent increase of those three cytokines, particularly IP10. In addition, we also found that the levels of IP10 in CSF of sCJD patients were slightly but significantly higher than in cases not diagnosed with prion disease.
-
Cell line SMB-S15 as well as the control cell line SMB-PS were acquired from Roslin Institute, UK (Clarke and Haig 1971). The cell line SMB-S15 is a mesodermal derived cell line originally established from brain tissues of a mouse clinically affected with scrapie strain Chandler, in which PrPSc replication was maintained by cell passage. Cell line SMB-PS was verified to be free of prion replication in vitro and infectivity in vivo (Birkett et al. 2001). Cell line SMB-RES was established from the SMB-S15 cells treated with 10 μmol/L resveratrol for 7 days and was verified to be free of prion replication in vitro and infectivity in vivo (Wang et al. 2016).
-
The brain samples from three strains of mice inoculated intracerebrally with two type of scrapie agents and three type of cell lysates were used in this study. Briefly, C57BL/ 6 (C57) mice were inoculated intracerebrally with mouseadapted scrapie strains 139A and ME7 whereas CD1 mice were inoculated intracerebrally with the lysates of SMB-PS, -S15 and -RES cells. C57 and Balb/c mice inoculated intracerebrally with the lysates of SMB-PS and -S15 cells, respectively. The intracerebral inoculation procedure and clinical, neuropathological and pathogenic features of infected animals were described elsewhere (Klöhn et al. 2003). The average incubation time of 139A- and ME7-infected mice, S15-CD1-mice, S15-C57-mice, S15-Balb/cmice was 183.9 ± 23.1 and 184.2 ± 11.8, 168.6 ± 7.9, 174.6 ± 3.1, 173.0 ± 0.0 days, respectively, while PS-mice and RES-mice did not show any abnormality until roughly 300 days post inoculation (dpi) (Xiao et al. 2016). PK-treated Western blot results revealed PrPSc and neuropathological assays showed typical changes of prion disease in the brains of 139A- and ME7-infected C57 mice, and also in the brains of three strains of S15-inoculated mice, but not in those of PS- and RES-inoculated mice (Wang et al. 2016).
-
A total of 45 CSF samples from the patients diagnosed as probable sCJD and 48 from non-PrD cases were used in the present study. The main features of these cases were summarized in Supplementary Table S1. The group of nonPrD consisted of different diseases diagnosed clinically, such as viral encephalitis, epilepsy, senile dementia, Parkinson's disease (Supplementary Table S2). All cases in non-PrD group did not fulfill the diagnostic criteria for CJD assessed by the expert board of China CJD Surveillance Center, even after more than 1 year follow-up. No brain autopsy was conducted.
All enrolled CSF samples were obtained by standard clinical procedures and were free of blood contamination. Routine CSF biochemistry assays of those specimens, including cell count, glucose and total protein, were in normal ranges.
-
Brain homogenates were prepared based on the protocol described previously (Gasque et al. 2000). Brain tissues from the infected and controls were washed in TBS (10 mmol/L Tris-HCl, 133 mmol/L NaCl, pH 7.4) for three times, and then 10% (w/v) brain homogenates were prepared in cold lysis buffer (100 mmol/L NaCl, 10 mmol/L EDTA, 0.5% Nonidet P-40, 0.5% sodium deoxycholate, 10 mmol/L Tris, pH 7.5) with protease inhibitor Cocktail set Ⅲ (Merck, 535140, Germany). The tissue debris were removed with low speed centrifugation at 2000 ×g for 10 min and supernatants were collected for further study.
-
A 17-plex kit (Millipore, MCYTOMAG-70K, Germany) was used to measure the concentrations of 17 cytokines in 10% brain homogenates, including IL7, IL9, IL13, IL15, CCL2 (monocyte chemotactic peptide 1, MCP1), CCL3 (macrophage inflammatory protein 1α, MIP1α), CCL4 (MIP1β), CCL5 (regulated upon activation, normal T cell expressed and secreted, RANTES), CCL8 (MIP2), CCL11 (eotaxin), CXCL1 (keratinocyte-derived chemokine, KC), CXCL9 (monokine induced by gamma interferon, MIG), CXCL10 (interferon gamma-induced protein 10, IP10), macrophage colony stimulating factor (M-CSF), granulocyte colony stimulating factor (G-MCSF), granulocyte-macrophage colony stimulating factor (GM-CSF), and gamma interferon (IFN-γ). The assay was performed according to the manufacturer's protocol. Briefly, 50 μL of each sample was tested in duplicate in a Luminex 200 system automatically. Data analyses were performed using the FLEXMAP 3D system. Cytokine concentrations were determined by a set of standard curves.
-
Various scrapie-infected mouse brain homogenates were subjected to commercial murine IP10, KC and M-CSF precoated ELISA kit (NeoBioscience, EMC121.96, EMC104.96, EMC021.96, China) whereas CSF samples were subjected to commercial human IP10 precoated ELISA kit (NeoBioscience, EHC157.96, China) according to the manufacturer's protocols. Briefly, 50 μL of 10% brain homogenate or 25 μL of CSF sample was mixed with dilution buffer supplied by the manufacturer and added to wells of an antibody-precoated plate in duplicate. Subsequently, the plate was incubated at 37 ℃ for 90 min. After being washed for 5 times, 100 μL of biotin-labeled antibodies were added into each well and incubated at 37 ℃ for 60 min. After being washed, the solution containing HRP-conjugated streptavidin was added and incubated at 37 ℃ for 30 min. The reactions were developed with addition of 100 μL substrate working solution for 15 min in dark and terminated with the stop solution. The OD450 values of reaction were measured by a microplate reader (Thermo Scientific, USA). The concentrations of IP10, KC and M-CSF were calculated by referring to the corresponding standard curve.
-
The transcriptional levels of IP10, KC and M-CSF in brain tissues were assessed in a CFX96 (Bio-Rad, USA) detector. Total RNA from the brains of healthy or scrapie-infected mice was extracted with Trizol reagent and subjected to first-strand cDNA synthesis using SuperScriptTM Ⅲ First-Strand Synthesis System (Catalog No. 2028724, Invitrogen, USA) according to the manufacturer's instruction. A total of 2 μg of total RNA was mixed with 10 μL RT Reaction Mix (2 ×), 2 μL RT Enzyme Mix and DEPC-treated water to a volume of 20 μL. The reaction was maintained at 25 ℃ for 10 min, then incubated at 50 ℃ for 30 min and inactivated by heating at 85 ℃ for 5 min. To remove RNA from the cDNA, 1 μL of E. coli RNase H was added to the mixture and incubated at 37 ℃ for 20 min. Aliquots (2 μL) of RT reaction products were amplified by real-time PCR. The primers used were designed and synthesized according to the published equences of murine IP10, KC and M-CSF (Supplementary Table S3). Real time-PCR was performed using a supermix containing the fluorescent dye SYBR green I (TSINGKE, TSE202, China) as described previously (Yuan et al. 2019). 1 μL of reverse transcription product, 10 μL of T5 Fast qPCR Mix (2×), 1 μL of each primer (10 μmol/L) and 7 μL of Nuclease-free H2O were mixed in a total volume of 20 μL. PCR was performed on CFX96 Real-Time PCR System (Bio-Rad, USA) under following conditions: 95 ℃ for 15 s and 60 ℃ for 60 s, totally 40 cycles. The expression level of each specific mRNA was determined relative to that of the individual β-actin using the comparative Ct method (2-ΔΔCt). All real time-PCR reactions were performed in triplicates.
-
To evaluate the absolute quantities of the IP10 transcripts in the brain tissues of 139A- and ME7-infected mice, digital PCR reactions were performed based on the Naica System for Crystal DigitalTM PCR (Stilla Technologies, France), using a qPCR mix supplied by manufacturer. 10 μL of qPCR mix, 1 μL of Alexa647 reference Fluorescent dye, 1 μL of each primer (10 μmol/L), 0.5 μL of reverse transcription product, 1.9 μL of Evagree Fluorescent dye and 9.6 μL of Nuclease-free H2O were mixed in a total volume of 25 μL. PCR was performed under following conditions: 95 ℃ for 30 s, 60 ℃ for 15 s and 72 ℃ for 30 s, totally 45 cycles. The data were captured by the software of Crystal Reader in digital PCR data captured equipment Naica Prism3 (Stilla Technologies, France). All PCR reactions were performed in triplicates.
-
Brain tissues of 139A-infected mice and age-matched healthy control were fixed in 10% buffered formalin solution and paraffin sections (5 lm in thickness) were prepared. After being washed with PBS three times, tissue slices were quenched with 3% H2O2 for 10 min and repaired under high temperature with 1% sodium citrate solution in microwave for 20 min. After blocking in 5% bovine serum albumin (BSA) at room temperature for 15 min, the sections were separately incubated with 1:100-diluted mAb for IP10 (Catalog No. ab9938, Abcam, UK), KC (Catalog No. ab86436, Abcam, UK) and M-CSF (Catalog No. ab233387, Abcam, UK) at 4 ℃ overnight. Subsequently, the sections were incubated with 1:200-diluted HRP-conjugated goat anti-mouse secondary antibody at 37 ℃ for 40 min, and visualized by incubation with 3, 3'-diaminobenzidine tetrahydrochloride (DAB, Catalog No. ZLI-9018, ZSGB-BIO, China). The slices were counterstained with hematoxylin, dehydrated and mounted in permount. The results of the control of only secondary antibodies were shown in Supplementary Fig. S1.
-
Descriptive data were expressed as median (range) for continuous variables and as percent (%) for categorical variables. All statistical data in our experiments were corrected by normal distribution and ANOVA before analysis using Kolmogorov–Smirnov and One-Way ANOVA test in the software of SPSS 17.0. The Mann– Whitney U test was used for nonparametric statistical analysis and Student's t test was carried out for parametric statistical analysis. The categorical variables were compared using the Chi square test. P < 0.05 means statistically significant.
Cell Culture
Brain Samples of Scrapie-Infected Experimental Mice
Human CSF Samples
Preparation of Mice Brain Homogenates
Luminex Assay
ELISA
Real-Time PCR
Digital PCR
IHC Assay
Statistical Analysis
-
To detect possible changes of cytokines expression level in the brain tissue during prion infection, 10% brain homogenates from four C57 mice infected with scrapie strains 139A or ME7 at terminal stage of infection (around 180 dpi) were subjected to Luminex assay using a commercial kit that could measure 17 different cytokines. Four agematched healthy mice were used as control. Nine out of 17 cytokines did not reach the detection level of Luminex assay. Among the eight measurable cytokines, the levels of IFN-γ, IL9, KC, MIG and RANTES did not change significantly between the groups of scrapie infected mice and non-infected controls. In contrast, the levels of IP10 and M-CSF in the brains of both 139A- and ME7-infected mice were significantly increased (Table 1). The brain level of IL13 in 139A-infected mice was lower, while no change was detected in ME7-infected mice compared to controls.
Cytokines Ctrl (pg/mL) 139A (pg/mL) P value (139A vs Ctrl) ME7 (pg/mL) P value (ME7 vs Ctrl) IFN-γ 83.47 ± 35.62 80.78 ± 23.20 0.467 77.09 ± 11.24 0.411 IL-13 302.39 ± 10.44 225.02 ± 36.57 0.023 333.15 ± 52.63± 0.232 IL-9 13, 812.09 ± 1413.15 13, 703.33 ± 468.71 0.461 15, 595.23 ± 2226.84 0.196 IP-10 135.50 ± 8.12 4093.07 ± 497.60 0.00017 7178.91 ± 3986.38 0.0334 KC 40.36 ± 25.43 37.02 ± 26.68 0.452 177.57 ± 191.70 0.186 M-CSF 35.66 ± 4.16 95.18 ± 32.13 0.030 112.38 ± 47.99 0.044 MIG 350.36 ± 28.14 333.37 ± 129.58 0.432 538.53 ± 168.61 0.097 RANTES 19.41 ± 3.84 51.29 ± 37.81 0.151 33.74 ± 9.17 0.056 Italic indicates P value less than 0.05 Table 1. Comparative analysis of the levels of 8 brain cytokines between 139A- or ME7-infected and age-matched healthy mice.
Further, 10% brain homogenates from three different strains of mice infected with scrapie agent S15, including S15-infected C57, Balb/c and CD1 mice, as well as that of the PS- and RES-inoculated mice were subjected to the above Luminex assay together with the corresponding agematched healthy mice as the controls. Each testing group contained three mice. The tested results were summarized in Table 2. In line with the data of 139A- and ME7-infected; mice, the brain levels of IP10 and M-CSF in all three strains of mice infected with agent S15 were significantly upregulated, whereas those of IFN-γ and IL13 remained unchanged compared to PS-inoculated mice. The level of KC was also increased in all three strains of mice infected with scrapie agent S15. The brain levels of IL9 and MIG also increased in the brains of S15-infected C57 and Balb/c mice compared to PS-inoculated brain mice, but was not significantly different compared to healthy controls. The brain levels of RANTES increased in S15-infected Balb/c mice compared to PS-inoculated ones. Those data indicate that the brain levels of some cytokines, particularly IP10 and M-CSF, are significantly upregulated at the final stage of various scrapie strains infected mice, independently of the mouse genetic background.
Cytokines Ctrl (pg/mL) PS (pg/mL) S15 (pg/mL) RES (pg/mL) P value (S15 vs PS) C57 strain of mice IFN-γ 83.47 ± 35.62 120.73 ± 52.66 59.52 ± 19.28 / 0.100 IL-13 302.39 ± 10.44 282.07 ± 53.79 379.20 ± 133.85 / 0.197 IL-9 13, 812.09 ± 1413.15 6977.68 ± 3332.25 18, 175.15 ± 1812.72 / 0.007 IP-10 135.50 ± 8.12 150.73 ± 26.06 3456.68 ± 1303.87 / 0.012 KC 40.36 ± 25.43 41.74 ± 7.79 138.72 ± 22.57 / 0.002 M-CSF 35.66 ± 4.16 40.54 ± 10.86 110.69 ± 19.39 / 0.006 MIG 350.36 ± 28.14 181.43 ± 146.76 804.60 ± 253.96 / 0.020 RANTES 19.41 ± 3.84 47.51 ± 21.49 88.27 ± 57.41 / 0.200 Balb/c strain of mice IFN-γ 141.71 ± 50.20 - 103.29 ± 26.13 / - IL-13 325.08 ± 0 188.78 ± 0 395.82 ± 65.77 / - IL-9 12, 792.58 ± 1399.03 5533.93 ± 1390.15 10, 428.63 ± 1872.54 / 0.021 IP-10 177.52 ± 126.69 102.15 ± 26.89 1202.63 ± 579.35 / 0.028 KC 57.36 ± 0 11.62 ± 0 106.22 ± 13.15 / 0.0002 M-CSF 20.28 ± 16.91 20.10 ± 11.86 54.45 ± 9.06 / 0.016 MIG 424.44 ± 71.28 57.69 ± 17.58 309.76 ± 61.16 / 0.002 RANTES 28.24 ± 24.93 7.66 ± 2.94 25.34 ± 4.14 / 0.008 CD1 strain of mice IFN-γ 54.27 ± 16.96 55.95 ± 14.78 22.92 ± 0 28.11 ± 16.35 - IL-13 270.83 ± 52.55 402.92 ± 51.32 197.12 ± 122.75 0±0 0.070 IL-9 9229.83 ± 1259.10 6389.72 ± 665.87 10, 234.79 ± 3470.92 10, 060.40 ± 5691.00 0.099 IP-10 92.21 ± 9.09 221.24 ± 7.56 979.01 ± 236.50 234.13 ± 181.22 0.005 KC 00 ± 0 28.86 ± 13.87 135.51 ± 62.24 44.30 ± 15.00 0.039 M-CSF 16.50 ± 4.93 40.94 ± 2.67 79.53 ± 25.08 26.27± 22.15 0.048 MIG 86.53 ± 21.34 117.17 ± 64.77 163.81 ± 115.01 230.88 ± 34.21 0.322 RANTES 21.84 ± 2.78 15.41 ± 0.646 13.79 ± 1.44 14.28 ± 3.90 0.111 P values in italic mean statistically significant Table 2. Comparative analysis of the levels of 8 brain cytokines from three different strains of mice infected with scrapie agent S15.
-
To confirm the changes of cytokines evaluated by Luminex assay, the protein levels of IP10, M-CSF and KC in the experimental mice brains were measured by commercial ELISA kits. Almost all infected mice showed significantly higher levels of brain IP10, including 139A-, ME7-infected mice, as well as S15-infected C57, CD1 and Balb/c mice, whereas S15-infected Balb/c mice were not statistically different (Fig. 1A, 1D). The ELISA levels of KC were increased in brains of 139A- and ME7-infected mice, three strains of S15-infected mice and RES-inoculated CD1 mice. No statistical difference was found in 139A-infected mice compared to the non-infected controls, as well as in S15-infected C57 and Balb/c mice compared to PS-inoculated mice (Fig. 1B, 1E). The brain M-CSF levels were statistically increased in S15-infected C57 and CD1 mice. The brain M-CSF levels in 139A-, ME7-infected mice and S15-infected Balb/c mice were slightly increased compared to the non-infected controls and the PS-inoculated mice but without statistical difference (Fig. 1C, 1F). Overall, Luminex assay and ELISA were in agreement.
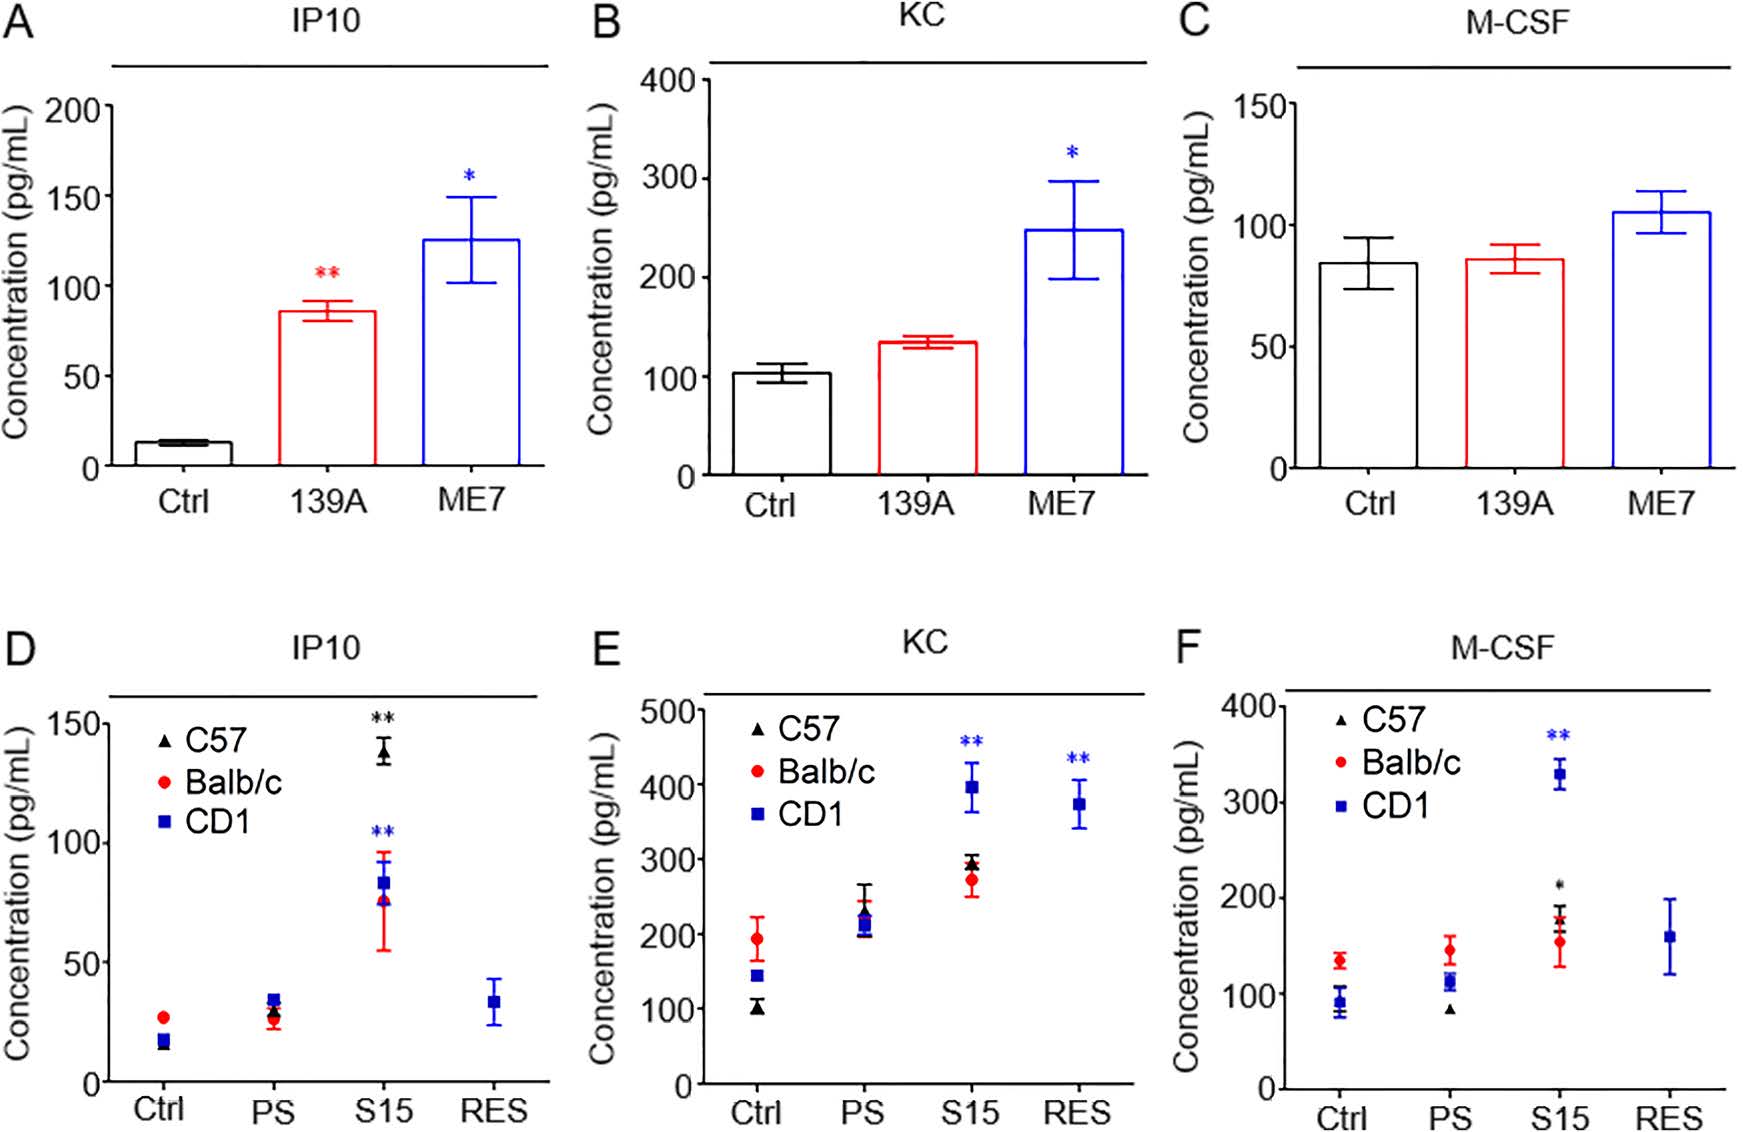
Figure 1. ELISA assays for detecting the levels of IP10, KC and M-CSF in the brains of various scrapie infected mouse models. A–C. ELISA for brain IP10 (A), KC (B) and M-CSF (C) levels in 139A- (red circle) and ME7-infected (blue square) mouse models versus agematched healthy controls (black triangle). D–E. ELISA for brain IP10 (D), KC (E) and M-CSF (F) levels in C57 (black triangle), Balb/c (red circle) and CD1 mice (blue square) infected with scrapie agent S15. Data are present as Mean ± SEM. Different cytokines are indicated on the top. IP10: interferon gamma-induced protein 10, KC: keratinocyte chemoattractant, M-CSF: macrophage colony stimulating factor. *P < 0.05 and **P < 0.01. Each experiment replicates three times.
-
To assess any possible changes of brain transcriptional levels of IP10, KC, and M-CSF, total RNA of the brain tissues from the scrapie infected mice and age-matched healthy controls were prepared. After cDNAs were synthesized, the specific transcript of each cytokine was evaluated by the corresponding qRT-PCR. As shown in Fig. 2A, the brain levels of specific mRNAs of IP10, KC and M-CSF in all scrapie infected mice were significantly higher than those of the healthy controls. Further, the transcriptional levels of IP10 in the brain tissues of 139A- and ME7-infected C57 mice were analyzed with a digital PCR technique. The mRNAs of those two kinds of scrapie infected mice were markedly higher than those of the normal controls (Fig. 2B). It indicates that the transcriptional levels of IP10, KC and M-CSF in the brains of scrapie infected experimental mice were significantly upregulated at the final stage of disease.
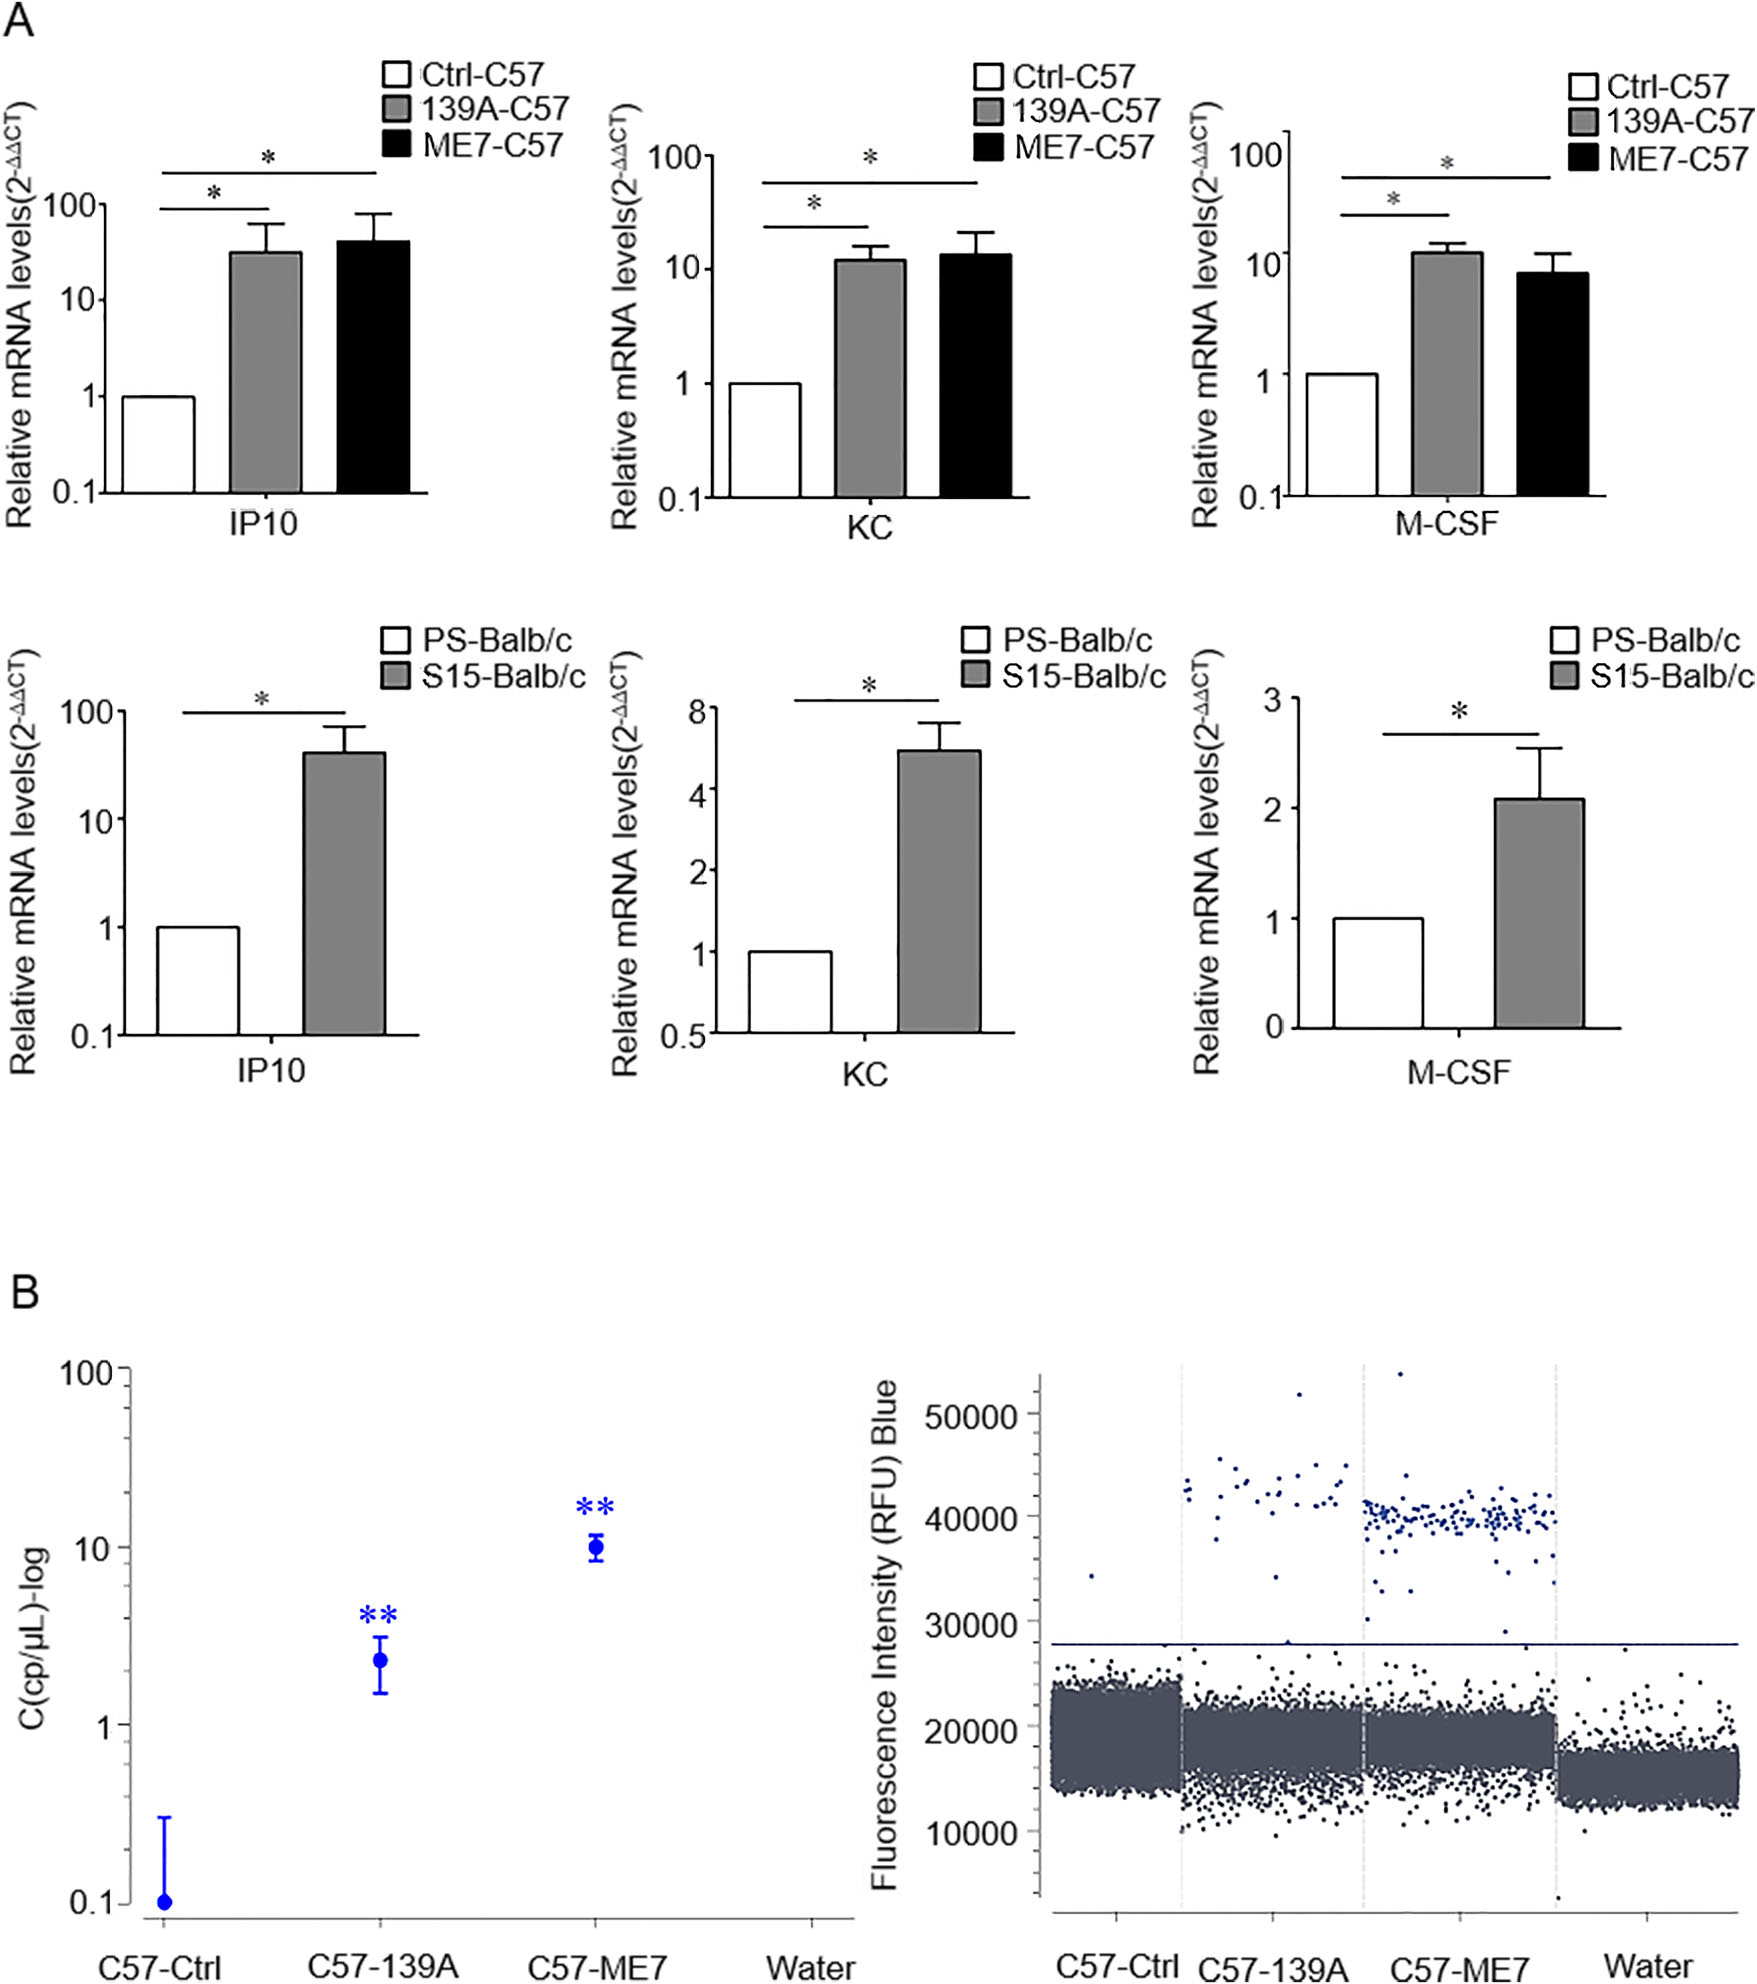
Figure 2. Comparative analysis of the brain transcriptional levels of IP10, KC and M-CSF in various scrapie infected mouse models with Real-time PCR (A) and Digital PCR (B). A The transcriptional levels of IP10, KC and M-CSF specific mRNA were determined relative to that of the individual β-actin. The relative intensity of the transcripts of IP10, KC and M-CSF gene in 139A-, and ME7-infected mice, as well as S15-infected Balb/c mice were relative to that of controls (C57 or balb/c healthy mice) that was set to 1. B The brain IP10 DNA copy number of 139A-, ME7-infected mice and non-infected controls. Nucleic acid free water used as the negative control. Various groups are indicated in X-axis. Y-axis shows the brain IP10 copy number which is expressed as log concentration (cp/μL-log) (left) or droplet fluorescence intensity in the blue acquisition channel (right). Blue droplets represent the IP10 positive copies and solid line represents the cut-off value. Data are representative of three independent experiments. *P < 0.05 and **P < 0.01.
-
The brain slices of cortical regions of 139A-infected mice were further subjected to IHC assay with IP10, KC and M-CSF specific antibodies, respectively. Microscope examinations revealed large amount of fine IP10 positive signals in the brain slices of infected mice, which seemed to be distributed in the cytoplasm, especially in the region of thalamus (Fig. 3A). KC positive signals surrounded the cells in all selected brain regions. Although the amount of the positive cells between infected and normal mice seemed to be indistinguishable, the size of the KC-positive signals in the infected brains was larger than in the controls and distributed in the region of cortex, hippocampus, and thalamus (Fig. 3B). The signals of M-CSF in the slices of control brains were very fine-grained and distributed outside of the cells, whereas the brain slices of infected mice were stained as large astrocytic particles accompanying with numerous fine grains, thalamus being the most affected brain region (Fig. 3C). Quantitative analysis showed that positive staining levels of IP10, KC and M-CSF increased compared to non-infected controls. These data suggested distinct depositing patterns of those three cytokines in the brain tissues between scrapie infected mice and age-matched healthy controls.
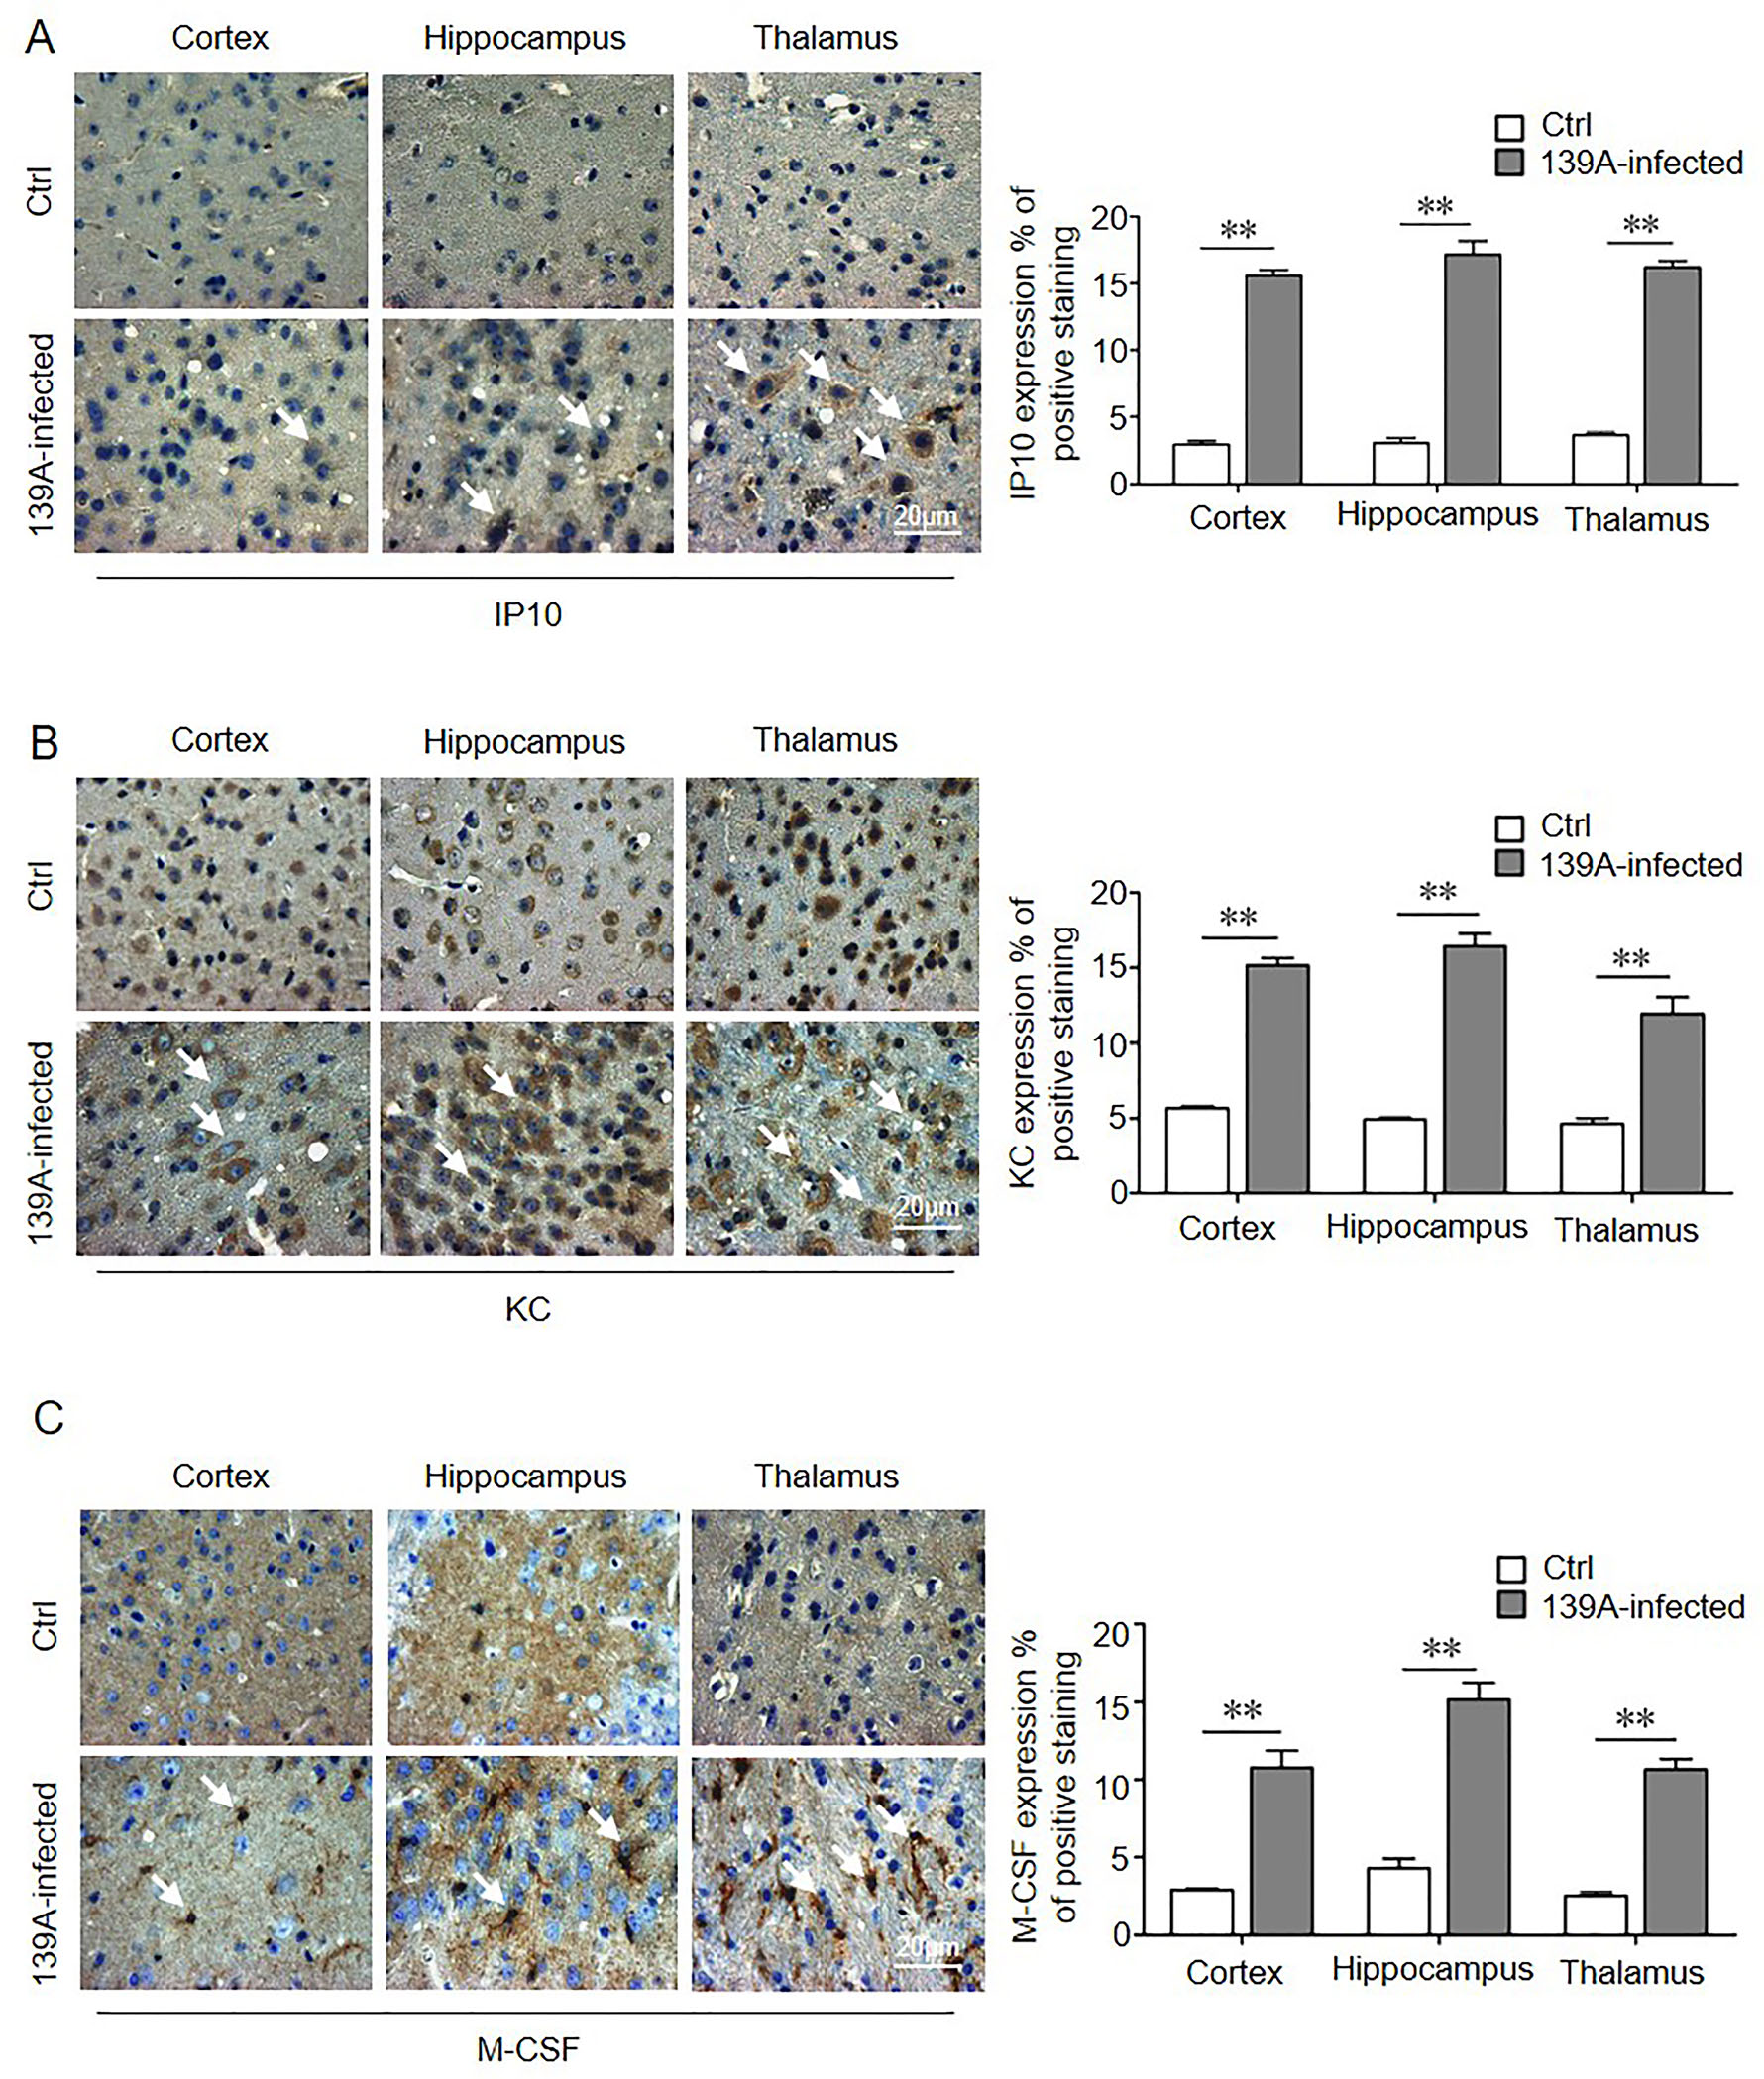
Figure 3. IHC assays of the distributions of IP10 (A), KC (B) and M-CSF (C) in cortical regions of 139A-infected mouse models (100×). The white arrows indicate the positive stainings. The quantitative analysis of the staining of IP10, KC and M-CSF per area is presented on the right. IHC staining results of mice cortical regions are indicated on the left. Various uninfected brain regions are indicated on the top as negative controls. **P < 0.01 versus noninfected control. Each experiment replicates three times.
-
To understand the dynamic changes of IP10, KC and M-CSF in the brains of the mice during scrapie infection, the brain specimens of 139A- and ME7-infected mice collected at 86, 117, 147 and 183 dpi were selected for Luminex assays and ELISA (Fig. 4). Dynamic data found that IP10, KC and M-CSF in the group of age-matched healthy control remained at low level, while IP10 increased sustainably in both 139A- and ME7-infected mice along with the incubation period in both Luminex and ELISA tests. Significant differences in the brain samples were found at 117 dpi compared to controls, although brain IP10 in 139A-infected mice declined in 183 dpi but still maintained at high levels (Fig. 4A, 4D). The KC levels were significantly increased in the brain samples of ME7-infected mice at terminal stage of infection (183 dpi) in Luminex assays, as well as in the brain samples of ME7-infected mice of 147 and 183 dpi in ELISA (Fig. 4B, 4E). Meanwhile, both Luminex and ELISA tests for KC illustrated that the KC levels in the brains of 139A-infected mice were remained unchanged. The brain levels of M-CSF were increased significantly in the brain samples of 139A-infected mice at 147 dpi as well as in ME7-infected mice at 117 dpi in the Luminex assays. This increase was however not significant in ELISA (Fig. 4C, 4F). It indicates a gradual increase of a number of cytokines, particularly IP10, in the brain tissues of scrapie infected mice during the incubation period.

Figure 4. Dynamic analysis of IP10, KC and M-CSF in brains of various scrapie infected mouse models with Luminex assay (A–C) and ELISA (D–F). Red circle represents 139A-infected mouse models, blue square represents ME7-infected mouse models, and black triangle represents age-matched healthy controls. *P < 0.05 and **P < 0.01 versus non-infected control. Each experiment replicates three times.
-
To assess the possible alteration of IP10 in CSF, CSF samples from 45 probable sCJD patients and 48 non-PrD patients were subjected to a commercial ELISA kit for human IP10. The CSF IP10 level of each patient was measured. It revealed a broad distribution of IP10 content in the tested samples (Fig. 5), ranging from 0.74 pg/mL to 330.31 pg/mL. The median level of CSF IP10 in the group of sCJD cases (71.56 pg/mL) was slightly higher than those in the group of non-PrD patients (39.26 pg/mL). Statistical assay identified significant difference in the CSF IP10 levels between the two groups (P = 0.0162). More cases with higher CSF IP10 amount (> 71.56 pg/mL) were in the group of sCJD (22/45, 48.89%) than in that of nonPrD (9/48, 18.75%). Further analysis of the diagnostic results from nine patients in the non-PrD group with IP10 greater than 71.56 pg/mL found that their clinical diagnosis was very different, including two viral encephalitis, two epilepsy, two autoimmune encephalitis, one cognitive dysfunction, one bilateral thalamic lesions, and one disturbance of consciousness, indicating CSF IP10 increase is sCJD specific.
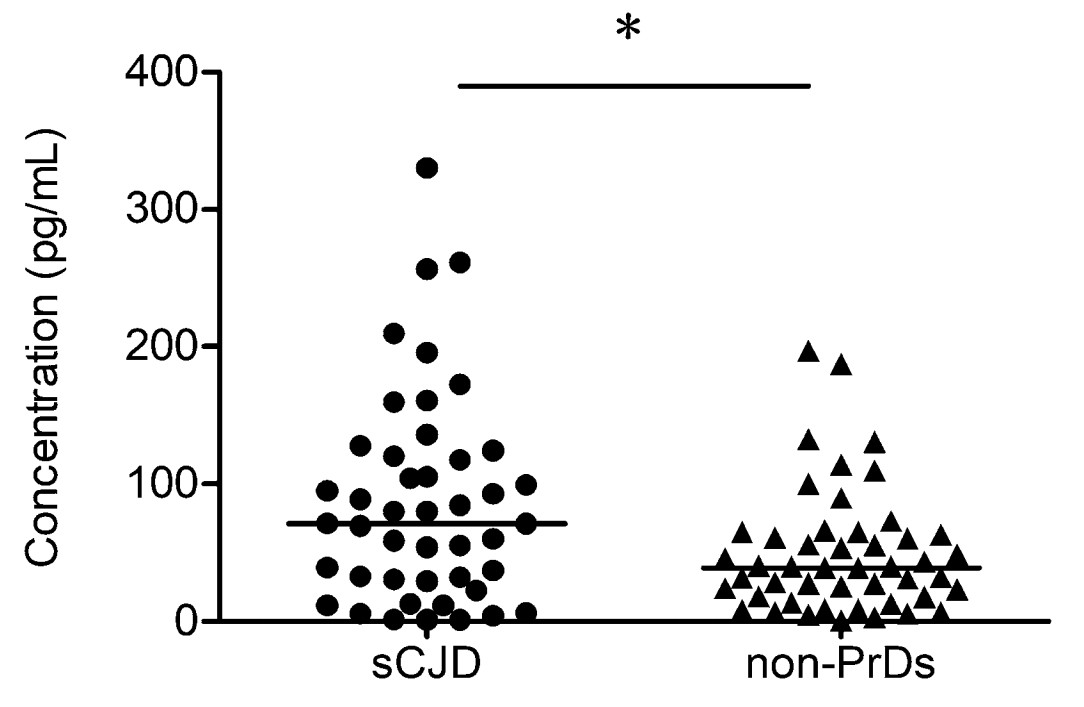
Figure 5. Comparative analysis of the CSF IP10 levels in the groups of probable sCJD and non-PrD cases. Black circle represents sCJD patients and black triangle represents non-PrD cases. *P < 0.05 versus non-CJD group.
Alteration of Expression Level of 8 Cytokines Detected by Luminex in the Brain Tissues of Scrapie-Infected Mice at Terminal Stage
Upregulation of the Expression Level of IP10, KC and M-CSF Characterized by ELISA in the Brain of Scrapie-Infected Mice at Terminal Stage
Upregulation of the Transcriptional Levels of IP10, KC and M-CSF Determined by qRT-PCR and Digital PCR in the Brains of Scrapie-Infected Mice at Terminal Stage
More Positive Staining of IP10, KC and M-CSF Detected by IHC Assay in the Brain Slices of Scrapie-Infected Mice at Terminal Stage
Dynamic Changes of IP10, KC and M-CSF in the Brains of Mice During Scrapie Infections
Slight but Significantly Increase of IP10 Level in the CSF Samples of sCJD Patients
-
In the present study, the levels of IP10, KC and M-CSF are found to be significantly increased in the brains of mice infected by different scrapie agents and independently of the murine genetic background. Different techniques were used including Luminex, ELISA, IHC and PCR assays. To our knowledge, this is the first time that the upregulation of the transcriptional and expressional level of M-CSF in the brains of scrapie infected mice is mentioned, while changes of brain IP10 and KC levels have been reported in other studies (Antonelli et al. 2014). Abnormal increase of inflammatory cytokines and chemokines are repeatedly described in the brains of prion diseases, which includes not only pro-inflammatory cytokines [IL1α (Tribouillard-Tanvier et al. 2009; Xie et al. 2013), IL1β (Tribouillard-Tanvier et al. 2009; Xie et al. 2013), TNF (Campbell et al. 1994; Kim et al. 1999; Xie et al. 2013) and IL6 (Antonelli et al. 2014; Saas et al. 1999; Thackray et al. 2004; Völkel et al. 2001; Yang and Jin 2018)], but also anti-inflammatory cytokines [TGFβ (Boshtam et al. 2017), IL4 (Thackray et al. 2004) and IL10 (Thackray et al. 2004)]. The current study adds useful data on the inflammatory reaction during prion infection and the progression of prion disease.
In addition to the current study, upregulations of IP10 and KC have been also described in scrapie strain 22L infected mice (Tribouillard-Tanvier et al. 2009). IP10 is a chemokine that binds to the receptor CXCR3 and activates a variety of signaling pathways, resulting in an influx of inflammatory factors into infected or inflamed tissues (Antonelli et al. 2014; Lindell et al. 2008; Santos et al. 2017). The IP10-mediated signaling pathways are also activated during prion infection, including Erk1/2 and JNK pathways (Nordstrom et al. 2009; Monnet et al. 2004). Like IP10, KC also belongs to the CXC family of chemokines, which is extensively related to inflammation, angiogenesis, tumorigenesis, and also contributes to the progression of neurodegenerative disorders (Aubry et al. 2000). IP10 and KC are induced by a large number of innate and adaptive immune stimuli, including TNF-α which is clearly increased in prion diseases (Weissmann 1994). Additionally, the current IHC data as well as other studies have demonstrated that the neuron-like cells may be the source cells of IP10 and KC in CNS during prion infection (Marella and Chabry 2004).
We have first observed the upregulation of brain M-CSF, especially in transcriptional level, in several scrapie agents inoculated mouse models. Up to now, few reports documented the changes, regardless of content or function, of brain M-CSF in prion pathogenesis. One in vitro study proposed that synthetic PrP106-126 peptide had ability to promote macrophage survival in the presence of sub-optimal concentration of M-CSF, which might increase brain microglia/macrophage numbers thereby enhancing subsequent inflammatory/immune responses (Hamilton et al. 2002). M-CSF was originally identified by its ability to regulate macrophage formation (Mehta 2005). In CNS, M-CSF is synthesized by astrocytes. Our current IHC assays have also proposed an astrocyte-like positive signals of M-CSF in the brain slices of the mice infected with scrapie agent at the end stage of disease, supplying the further morphological evidence for the cell type expressing M-CSF in CNS. Although brain G-CSF and GM-CSF, two other members of the same family of M-CSF, are not detectable by the Luminex assay in this study, the elevations of those two factors in the brains of scrapie infected mice have been described (Tribouillard-Tanvier et al. 2009).
In general, neuroinflammation can occur rapidly during infection of the CNS. The current study illustrates that the upregulation of IP10 occurs in the earlier stage and persists till the end of disease, while KC and M-CSF are expressed in the middle or late stage during prion infection. Those data, together with numerous evidences of sustainably increased inflammatory cells, as well as the activation of complement systems in CNS (Wesa and Galy 2002; Cardile et al. 2009), propose a clear picture of chronic but active inflammation in the brain during the infection of prion. Such kind of chronic inflammatory response from the host may initially target the removal of prion deposits from the CNS tissues, but later the inflammatory response causes damage to the neurons and results in irreversible changes in the brain. In fact, neuroinflammation is also often observed in other neurodegenerative diseases, such as Alzheimer's disease (AD) (Reinisch et al. 2014) and Parkinson's disease (PD) (Hirsch and Hunot 2009; Hirsch et al. 2012). Interestingly, high level of brain IP10 is also detected in AD and PD. Reduced IP10 expression can lead to significant disease perturbation, which cannot be improved by the expression of other analogues (Galimberti et al. 2010; Little et al. 2006; Mohd Hasni et al. 2017; Rocha et al. 2014; Venturelli et al. 2006). It will be interesting to evaluate the role of IP10 knockout in the neuropathological changes and disease progression of prion infection.
Finally, preliminary data show a slight increase of IP10 in the CSF samples of sCJD patients compared to non-PrD cases of similar age. It may, at least partially, reflect an increase of IP10 in the brain tissues of prion infection. Unlike other assays using healthy or normal individual brains as control, CSF samples in this study come from the neurological patients diagnosed as non-sCJD because it is difficult to obtain CSF samples from healthy individuals, especially age-matched healthy controls. Many of non-PrD control patients are diagnosed as AD, PD, viral encephalitis or other neurodegeneration diseases and some of them have high level of CSF IP10, which may explain why the high expression level of IP10 in CSF of sCJD patients is not as obvious as that in the brains of scrapie-infected mice. On the other hand, since IP10 is a non-specific inflammatory factor that may change in many neurological diseases, probably CSF IP10 is not a suitable biomarker for diagnosis or distinguishing diagnosis of sCJD and other types of human prion diseases as well as other neurological diseases.
-
This work was supported by the National Natural Science Foundation of China (81772197, 81401670 and 81630062), the Non-profit Central Research Institute Fund of Chinese Academy of Medical Sciences (2018RC330004), National Key R & D Program of China (2018YFC1200305Y), National Science and Technology Major Project of China (2018ZX10102001), SKLID Development Grant (2019SKLID401 and 2016SKLID603) and the Natural Science Foundation of Heilongjiang Province (C2018044).
-
JC and CC performed most of the experiments and drafted the manuscript. JC and WZ carried out the Western blot and Luminex assay. JC and CH performed ELISA. JC, YZW and LL carried out the IHC, JC and YX carried out the realtime PCR and digital PCR. CC, QS, KX and ZBC performed the statistical analysis. CC, ZBC and XPD conceived of the study and finalized the manuscript. All authors read and approved the final manuscript.
-
All the authors declare that they have no conflict of interest.
-
All procedures were approved and supervised by the Ethical Committee of the National Institute for Viral Disease Control and Prevention, China CDC. Usage of stored human CSF samples in the Center of Chinese CJD Surveillance System has been approved by the Ethics Committee of the National Institute for Viral Disease Control and Prevention, China CDC.

 DownLoad: