


HTML
-
The outbreak of novel coronavirus disease 2019 (COVID-19) has become a global pandemic and caused over 2 million infections by April 15th, 2020 (WHO 2020). According to the Chinese Centers for Disease Prevention and Control (CDC) report, among 72, 314 COVID-19 cases in China's mainland most of cases (81%) presented only mild illness or moderate pneumonia, yet 14% developed severe symptoms such as dyspnea, high respiratory frequency and low blood oxygen saturation, and another 5% were in critical conditions like respiratory failure, septic shock, and multiple organ dysfunction/failure (Epidemiology Working Group for NCIP Epidemic Response and Chinese CDC, 2020; Wu and McGoogan 2020). The global case-fatality rate (CFR) of COVID-19 was 6.4% as of April 15, 2020 (WHO 2020), yet the CFR could be even elevated among severe/critical cases, elder population, and patients with preexisting comorbidity (Cereda et al. 2020; Chen et al. 2020; Wu and McGoogan 2020). The reported CFR in ICU cases ranged from 22.72% to 38.5% (Grasselli et al. 2020; Huang et al. 2020; Richardson et al. 2020).
It is believed that early adaptive immune response plays an important role in eliminating the severe acute respiratory syndrome coronavirus 2 (SARS-CoV-2), while the inflammation driven by elevated innate immune response is a major cause of life-threatening respiratory disorders in severe COVID-19 cases (Shi et al. 2020; Thevarajan et al. 2020). However, present information about the immunological characteristics of COVID-19 patients is fragmented. There were a few studies reported the serum antibody response of COVID-19 (Lauer et al. 2020; Long et al. 2020; Thevarajan et al. 2020; To et al. 2020; Wu et al. 2020; Xiang et al. 2020; Zhang et al. 2020; Zhao et al. 2020a, b), which confirmed the emergence of IgM, IgG and neutralizing antibodies against SARS-CoV-2 and suggested the application of serologic test in COVID-19 diagnosis (Long et al. 2020; Zhang et al. 2020). However, some reports about the temporal profile of SARS-CoV-2 antibodies were mutually contradictory (Thevarajan et al. 2020; To et al. 2020; Xiang et al. 2020; Zhao et al. 2020a) and the immune responses of patients with different demographic and clinical features remain unclear. In this study, we, compared the results of serologic tests and nucleic acid test (NAT) from a group of COVID-19 patients in Wuhan, and analyzed the serologic IgM and IgG antibody level of patients with different disease severity.
-
In this study, we included confirmed patients with both throat swab and blood sample delivered to the Wuhan CDC laboratory before March 1st, 2020. Clinical samples of 88 COVID-19 patients were collected at eleven designated hospitals (People's Hospital of Dongxihu District, Wuhan Pulmonary Hospital, Wuhan Hankou Hospital, Wuhan Red Cross Hospital, Wuhan Jingyintan Hospital, Wuhan Third Hospital, Wuhan Sixth Hospital, Renmin Hospital of Wuhan University, Tongji Hospital, Wuhan Union Hospital, and General Hospital of the Yangtze River Shipping) and were delivered for laboratory diagnosis of SARS-CoV-2. With the verbal consent of patients, throat swabs were collected in 3.5 mL viral transport medium for NAT. Blood samples were collected in 5 mL non-additive tubes and serum remnants were separated and refrigerated at − 20 ℃ before antibody testing. The COVID-19 severity level of the participant was retrieved from the National Infectious Disease Information System (NIDIS). Every patient was characterized as one of the four severity levels (mild, moderate, severe and critical) by his/her physician (National Health Commission of the People's Republic of China 2020a, b; Epidemiology Working Group for NCIP Epidemic Response and Chinese Center for Disease Control and Prevention 2020; Pan et al. 2020) and the data were recorded in the NIDIS.
-
The nucleic acid was extracted from 200 μL of throat swab medium using a GeneRotex automated nucleic acid extraction system (Tianlong, Xi'an, China). Due to medical resource limitations, two commercial quantitative PCR (qPCR) kits were employed in the detection of SARS-CoV-2 RNA. One of the assays (Daan Gene, Guangzhou, China) was used from January to early February, targeting at SARS-CoV-2 ORF1ab and N gene, with a limit of detection (LoD) of 500 copies/mL. The other assay (BGI, Shenzhen, China) which was used after February 5th targeted at ORF1ab fragment only and its LoD was 100 copies/mL. The cutoff cycle-threshold (Ct) was 40 for both kits. Both assays were approved by the National Medical Products Administration (NMPA) of China and had been established in our laboratory.
-
The levels of SARS-CoV-2-binding IgM and IgG antibodies were assessed using semi-quantitative magnetic particle chemiluminescence immunoassays (M-CLIAs) on an Axceed 260 automated magnetic analyzer (Bioscience, Chongqing, China) (Loeffelholz and Tang 2020), as described by Long et al.(2020). Both IgM and IgG assays had received NMPA approvals with registration numbers of 20203400182 and 20203400183, respectively. The sensitivity and specificity of the IgM assay in pre-marketing clinical evaluation were 88.30% and 99.50%, while those of the IgG assay were 87.25% and 99.25%. Fifteen microliter of serum was diluted for 50 times before being used in each test. Procedures and cut-off value set-up were performed following the manufacturers' instructions. Antibody levels were presented as the measured chemiluminescence values divided by the cutoff (S/Co) (Long et al. 2020).
-
Statistical analyses were performed with Prism 8.0 (GraphPad, San Diego, USA). Categorical variables were compared using Chi square test. For continuous variables, t test or Mann–Whitney U test were employed after their normality determined by Kolmogorov–Smirnov test. A P-value of less than 0.05 was considered statistically significant.
Samples and Information Collection
NAT of SARS-CoV-2
Serologic Testing of SARS-CoV-2
Statistical Analysis
-
A total of 88 COVID-19 patients from eleven designated hospitals were included in this study, of whom 43 were male and 45 were female. Their mean age was 56.43 years old (range 17–83) and the median interval between initial symptom onset and sample collection was 11 days (range 1–37). Thirty-two patients (36.4%) had severe/critical illnesses and required oxygen supplementation or higher life support, while the other 56 patients had mild or moderate symptoms (Table 1).
Mild/moderate cases Severe/critical cases P Total 56 (63.64%) 32 (36.36%) Gender 0.136 Male 24 (42.86%) 19 (59.38%) Female 32 (57.14%) 13 (40.62%) Age (mean ± SD, years) 57.05 ± 13.94 55.34 ± 12.89 0.571 Sample collecting time (days)a 0.003 Median 12 9 Interquartile range 9–18 5–12 Nucleic acid test 0.748 Positive 42 (75.00%) 23 (71.88%) Negative 14 (25.00%) 9 (28.13%) Antibody tests IgM positive 24 (42.86%) 5 (15.63%) 0.009 IgM negative 32 (57.14%) 27 (84.37%) IgG positive 44 (78.57%) 14 (43.75%) 0.001 IgG negative 12 (21.43%) 18 (56.25%) aSampling time: the time interval between symptom onset and sample collection Table 1. Demographic information and test results of the studied subjects.
qPCR test confirmed 65 SARS-CoV-2 infected cases among 88 participants (73.86%). No significant difference was observed between the positive rates of two qPCR kits (37/53 versus 28/35, χ2 = 1.133, P = 0.287). On the other hand, the positive rates of serum IgM and IgG antibody against SARS-CoV-2 were 32.95% (29/88) and 65.91% (58/88), respectively (Table 2). Altogether, 84 COVID-19 cases (95.45%) were identified among all patients by the combination of NAT and antibody test, which was significantly more than single NAT (χ2 = 15.793, P < 0.001) or serologic test (χ2 = 24.643, P < 0.001). The consistency rate between results of antibody test and NAT was 48.86% [(39 + 4)/88].
NAT resultsa Antibody test resultsa Total IgM IgG/IgM + IgG Positive Negative Positive Negative Positive 20 (22.73%) 45 (51.14%) 39 (44.32%) 26 (29.55%) 65 (73.86%) Negative 9 (16.98%) 14 (15.91%) 19 (21.59%) 4 (4.54%) 23 (26.14%) Total 29 (32.95%) 59 (67.05%) 58 (65.91%) 30 (34.09%) 88 (100%) aCombination of NAT and antibody test had significantly higher detection rate than single NAT (χ2 = 15.793, P < 0.001) or serologic test (χ2 = 24.643, P < 0.001). Table 2. Comparison of results of serum SARS-CoV-2 antibody tests and nucleic acid test (NAT).
-
Notably, all the patients that were positive for SARS-CoV-2 IgM were also positive for SARS-CoV-2 IgG. The earliest seroconversion of IgG antibody was observed 5 days after the disease onset, and that time interval of IgM antibody was 8 days (Fig. 1). For 51 patients with sample collected at 10 days or later after symptom onset, the seroconversion rate was 47.06% for IgM (24/51) and 82.35% for IgG (42/51). Both antibodies were detectable in samples collected over 30 days after onset.
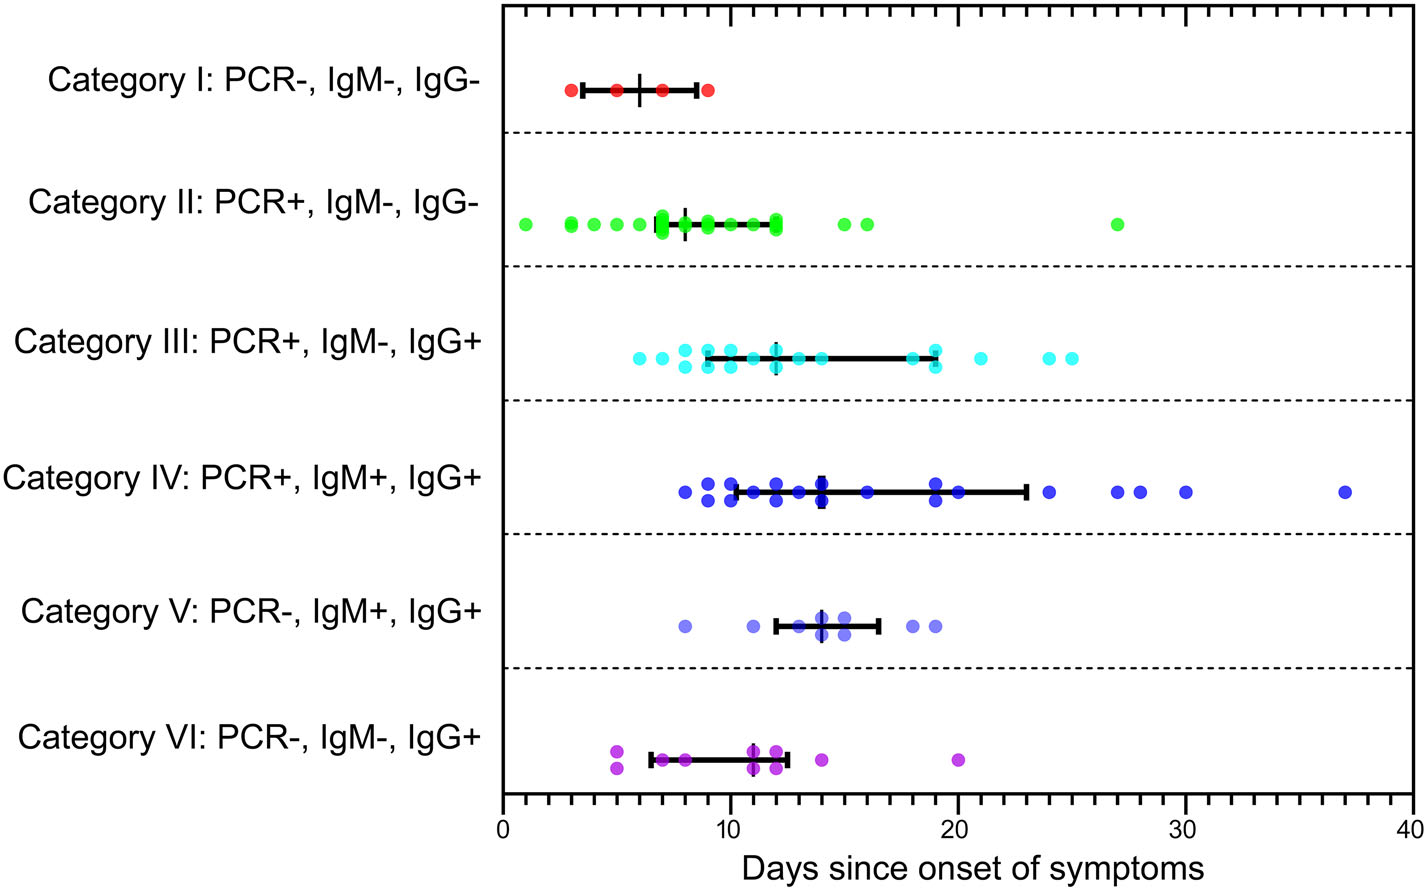
Figure 1. The correlation between sample collecting time of COVID-19 patients and different test results combination. Six categories of samples with different test results were characterized on the left side of the figure. Each colored dot represented one patient sample and its time interval between symptom onset and sample collection was scaled on the lateral axis. The median time interval and interquartile range were reported for each category. PCR+: positive for SARS-CoV-2 RNA in nucleic acid test; PCR−: negative for SARS-CoV-2 RNA in nucleic acid test; IgM+/IgG+: positive for SARS-CoV-2 IgM/IgG antibody in serologic test; IgM−/IgG−: negative for SARS-CoV-2 IgM/IgG antibody in serologic test.
When comparing patients with mild/moderate symptoms and patients with severe/critical diseases, no obvious difference was found between their gender ratios (P = 0.136), age composition (P = 0.571) and NAT positive rates (P = 0.748), but the mild/moderate group had later sampling time and higher antibody positive rates than the severe/critical group (Table 1). When comparing to the severe/critical cases with the same sampling time, mild/moderate cases presented higher seroconversion rate and higher antibody titer for both IgM and IgG antibodies (Fig. 2). Similar analysis was performed on cases of different genders and in different age groups, but no significant difference was observed between their antibody levels and temporal profiles (Fig. 3).
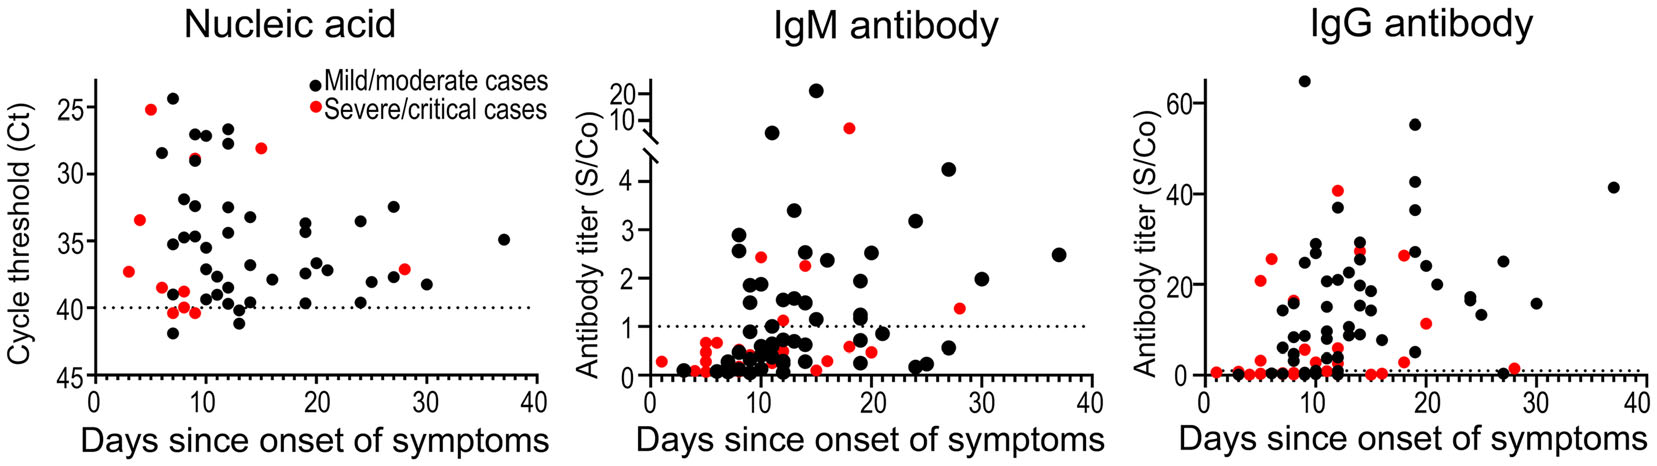
Figure 2. Comparison of nucleic acid and serologic test results between COVID-19 patients with different disease severity. Study subjects were separated into mild/moderate cases (black dots) and severe/critical cases (red dots), and their nucleic acid and serologic test results were compared. The time interval between symptom onset and sample collection was scaled on the lateral axis in each panel. For nucleic acid test (left) and IgM (middle)/IgG (right) antibody tests, the vertical axes reported qPCR cycle thresholds (Ct) and S/Co values, respectively. The dash line represented the threshold of each test.
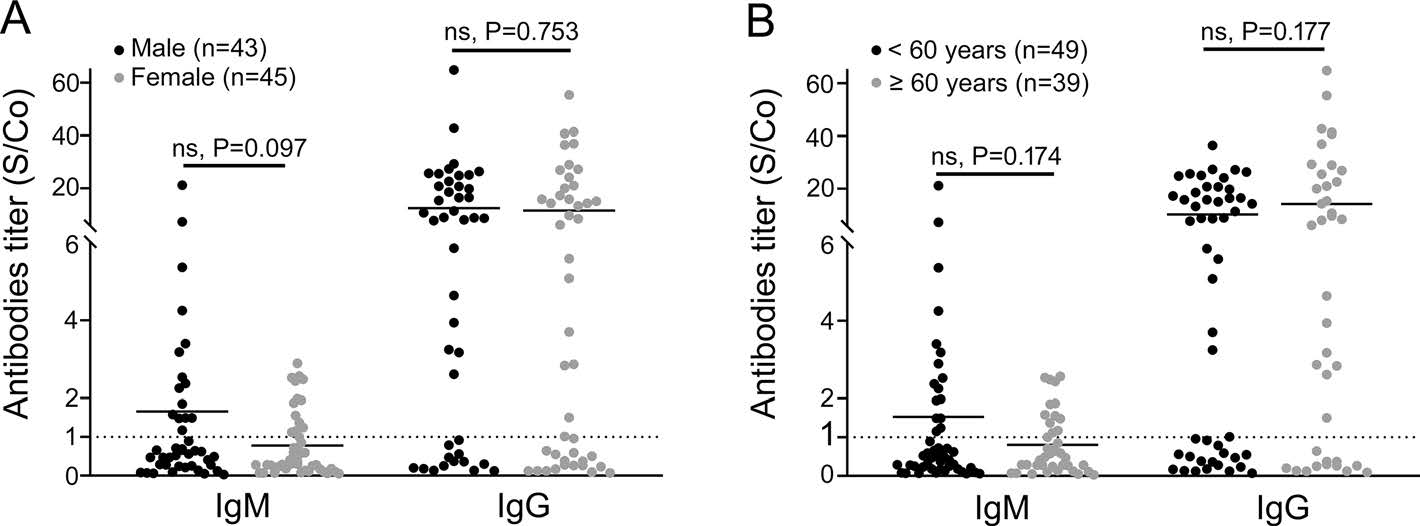
Figure 3. Comparison of serologic test results between COVID-19 patients of different genders and age groups. A The serologic test results of males (black dots) and females (grey dots) were compared. Every dot represented one patient and the vertical axis reported the S/Co values of SARS-CoV-2 IgM and IgG antibody tests. B The serologic test results of < 60 years group (black dots) and ≥ 60 years group (grey dots) were compared. Every dot represented one patient and the vertical axis reported the S/Co values of SARS-CoV-2 IgM and IgG antibody tests. The dash line represented the threshold of each test.
Demographic Features and SARS-CoV-2 Test Results of Participants
The Relationship Between Antibody Levels and Disease Progression
-
Although NAT has been regarded as the gold standard of COVID-19 laboratory diagnosis, it is not suitable for low viral load patients and its accuracy is largely depended on the sampling procedure (To et al. 2020). It makes serologic test a valuable compliment for clinical diagnosis as well as providing information about the disease dynamic. In this study, two NMPA approved M-CLIA kits were used to detect the level of SARS-CoV-2 IgM and IgG antibodies in the serum of COVID-19 patients. In addition to the 65 COVID-19 patients identified by NAT, the antibody tests identified another 19 SARS-CoV-2 infected patients among the 88-person cohort, which diminished the need of multiple sampling and significantly improved the diagnostic accuracy. Meanwhile, the relatively low consistency between NAT and antibody test results also indicated those results should not be interpreted independently. These data provided adequate evidence that serology is a particularly important supplementary tool for diagnosis of the novel and emerging SARS-CoV-2 (Loeffelholz and Tang 2020).
Temporal profile of serum antibody is vital for the interpretation of serologic test result and evaluating the immune protection situation of subject. In this study, level of serum antibody against SARS-CoV-2 started to rise since day 5 after disease onset and remained high in samples collected 1 month after onset. IgG level was rose earlier than IgM, just like in several other studies (Thevarajan et al. 2020; To et al. 2020; Zhang et al. 2020), but it could be related to the unbalanced sensitivity of IgM and IgG assays, since earlier IgM seroconversion has also been reported (Xiang et al. 2020; Zhao et al. 2020a). The validation and standardization of SARS-CoV-2 serologic assays in large clinical cohort is crucial for enabling uniform assessment of immunogenicity and efficacy (Okba et al. 2020).
We further looked into the possible correlates of serum antibody level with demographic features, including gender, age and disease severity. Our results suggested early seroconversion and high antibody titer were likely linked with less severe clinical symptoms. The finding is in consistent with earlier observations of recovered patients (Dong et al. 2020; Thevarajan et al. 2020) and the 'two-phase immune response' theory in which early adaptive immune response plays protective role in the course of COVID-19 (Shi et al. 2020), but opposite to a previous study which reported positive correlation between clinical severity and antibody titer (Zhao et al. 2020a). Such conflicted data warrant further study of the immunological characteristics of COVID-19 patients with different disease severity.
There are several limitations in this study. First, only one blood sample was collected from each patient, causing a delay between the reported seroconversion time and the actual seroconversion time. Second, two different NAT assays were exploited in the detection of SARS-CoV-2 RNA due to the urgent procurement in the outbreak, which leaded to a potential difference in test sensitivity. Finally, participants' comorbid conditions were not included in the analysis, because we did not have access to the clinical information of participants.
In summary, this study supported the combination of serologic testing and NAT in routine COVID-19 diagnosis and provided evidence on the temporal profile of antibody response against SARS-CoV-2 in patients with different disease severity. More insights about the immunological features of COVID-19 patients are important for disease prognosis prediction and vaccine development.
-
The work was supported by the Emergency Scientific Research Project for COVID-19 from Wuhan City (Grant No. 2020020101010008).
-
WHK and MQL designed the study. WHK, RZ, JBZ, DGK, JS, QR, and MQL collected samples and clinical information and analyzed data. WHK, RZ and MQL analyzed and interpreted the data. WHK and MQL wrote and revised the manuscript. MQL finalized the manuscript. All authors had full access to the final version of the report and agreed to the submission.
-
The authors declare that they have no conflict of interest.
-
All procedures performed in studies involving human participants were in accordance with the ethical standards of the institutional and with 1964 Helsinki declaration and later amendments or comparable ethical standards. This study was reviewed and approved by the Ethics Committee of Wuhan Centers for Disease Prevention and Control. Since samples were collected with medical necessity and in accordance to the government guidance, written informed consent was waived.

 DownLoad: