


HTML
-
The emerging coronavirus disease (COVID-19) is caused by an infection of severe acute respiratory syndrome coronavirus 2 (SARS-CoV-2) (Zhou et al. 2020; Zhu et al. 2020) and has similar symptoms to SARS-CoV. Until 3 August, 2020, there were over 18, 000, 000 confirmed COVID-19 cases with more than 690, 000 deaths from SARS-CoV-2 infection around the world. However, there is currently no specific antiviral drug available for the thousands of hospitalized patients, posing an urgent demand for identifying efficient drugs to combat the disease. Previously, we have reported several drugs including remdesivir (a nucleoside analog that targets virus replication) and chloroquine (a possible entry inhibitor), which has been recommended in the seventh edition of the guidelines for the diagnosis and treatment for COVID-19, could efficiently inhibit SARS-CoV-2 infection in vitro at low-micromolar concentrations, providing important drug candidates for clinical treatment of COVID-19 (Zhou et al. 2020).
Virus-encoded proteases play crucial roles in the life cycles of many viruses, therefore are potential and historically approved drug targets. The genome of coronavirus (CoV) is a positive-sense, single-stranded RNA, which encodes the replicase polyproteins and four major structural proteins, including spike glycoprotein (S), envelope protein (E), membrane protein (M) and nucleocapsid protein (N) (Wu et al. 2020). Production of the replicase polyproteins is initiated by the translation of ORF1a and ORF1ab, which produces two large viral polyproteins pp1a and pp1ab, respectively. Then these two polyproteins are further processed by two viral proteases, namely the papain-like protease (PLpro), and a 3C-like protease (3CLpro) which is also called main protease (Mpro). Processing of the viral polyprotein by proteases is essential for virus proliferation, suggesting the possible anti-SARS-CoV-2 potential of known viral protease inhibitors (Wu et al. 2020). Actually, the Chinese National Health Commission has recommended to use human immunodeficiency virus (HIV) protease inhibitors lopinavir/ritonavir (LPV/r, marketed as Kaletra® produced by AbbVie) as an emergent clinical countermeasure for SARS-CoV-2. Kaletra is an orally administered co-formulated ritonavir-boosted protease inhibitor comprising lopinavir and low-dose ritonavir (Croxtall and Perry 2010). However, a randomized, controlled, open-label trial indicated that, no benefit was observed with LPV/r treatment beyond standard care in hospitalized adult patients with severe COVID-19 (Cao et al. 2020). Besides these, rupintrivir is an inhibitor which can effectively inhibit human rhinovirus 3Cpro (Dragovich et al. 1999) and CoV 3CLpro (Anand et al. 2003), and a number of rupintrivir analogues have been found that can inhibit CoV replication by targeting 3CLpro (Kuo et al. 2009). AG7404 is an analogue of rupintrivir with improved oral bioavailability, and displays anti-viral activity in vitro and is safe and well-tolerated in vivo (Patick et al. 2005). However, which kind of viral inhibitors are superior against SARS-CoV-2 remains vague. To provide further experimental evidence for the clinical application of viral protease inhibitors to treat this disease, and to figure out which kind of viral protease inhibitors are worth further structure modification, we systematically explored the antiviral efficiency of lopinavir/ritonavir, and picornavirus cysteine protease 3C inhibitors AG7088 (rupintrivir) and AG7404. Moreover, considering that Kaletra was not clinically effective, we carried out in vitro to in vivo extrapolation (IVIVE) analyses for LPV/r, and tried to figure out whether a revised dose regimen for LPV/r could possibly lead to a superior clinical efficacy against COVID-19.
-
African green monkey kidney Vero E6 cell line was obtained from American Type Culture Collection (ATCC) and maintained in minimum Eagle's medium (MEM; Gibco Invitrogen) supplemented with 10% fetal bovine serum (FBS; Gibco Invitrogen), 1% antibiotic/antimycotic (Gibco Invitrogen), at 37 ℃ in a humidified 5% CO2 incubator. Human liver cancer Huh7 cell line was cultured in Dulbecco's modified Eagle's medium (DMEM; Gibco Invitrogen) supplemented with 10% FBS, 1% antibiotic/antimycotic (Gibco Invitrogen), at 37 ℃ in a humidified 5% CO2 incubator.
A clinical isolate SARS-CoV-2 (nCoV-2019BetaCoV/Wuhan/WIV04/2019) (Zhou et al. 2020) was propagated in Vero E6 cells, and viral titer was determined by 50% tissue culture infective dose (TCID50) as described in our previous study (Wang et al. 2020). All the infection experiments were performed in a biosafety level-3 (BSL-3) laboratory.
Ritonavir (Selleck Chemicals, no.S1185), lopinavir (Selleck Chemicals, no.S1380), rupintrivir (Sigma-Aldrich, no.PZ0315), AG404 (synthesized by Wuxi AppTec), chloroquine (Sigma-Aldrich, no.C6628) were purchased from indicated companies.
-
Vero E6 or Huh7 cells pre-seeded in 48-well cell-culture petridish (1 × 10⁵ cells/well) were treated with the different doses of the indicated compounds for 1 h and infected with SARS-CoV-2 at an MOI of 0.2 (Vero E6) or 0.1 (Huh7). Two hours later, the virus-drug mixture was removed and cells were cultured with drug containing medium. At 48 h post infection (h.p.i.), the cell supernatant was collected and lysed. The viral RNA extraction and quantitative real time PCR (RT-PCR) analysis was described in our previous study (Wang et al. 2020).
-
To detect intracellular expression level of viral NP, cells were fixed with 4% paraformaldehyde and permeabilized with 0.5% Triton X-100. Then cells were blocked with 5% bovine serum albumin (BSA), and were incubated with the primary antibody (anti-sera against the NP of a bat SARS-related CoV, 1:1000 dilution) for 2 h, followed by incubation with the secondary antibody (Alexa 488-labeled goat anti-rabbit, 1:500, Abcam). The nuclei were stained with Hoechst 33258 dye (Beyotime, China). The image was taken by fluorescence microscopy.
-
For Western blot analysis, proteins were separated on 12% SDS-PAGE and then transferred onto PVDF membranes (Millipore). The membranes were blocked with 5% BSA in TBS buffer with 0.05% Tween 20 for 1 h at room temperature, and then incubated with the anti-NP sera (1:2000 dilution) as the primary antibody. After that, the membranes were incubated with horseradish peroxidase (HRP)-conjugated Goat Anti-Rabbit IgG (Proteintech, China). Protein bands were detected by SuperSignal West Pico Chemiluminescent substrate (Pierce).
-
The inhibitors (lopinavir, ritonavir, rupintrivir, AG7404) were built and subjected to the optimize geometry calculation in mechanics using MMFF94 parameter at Discovery Studio 2.5. They were then docked at the homology model of SARS-CoV-2 3CLpro (PDB: 6LU7, Resolution: 2.16 Å) at Schrodinger Glide program.
Cells, Virus and Reagents
Evaluation of the Antiviral Activities of the Test Compounds
Immunofluorescence Microscopy
Western Blot Analysis
Molecular Docking
-
The cytotoxicity of lopinavir or ritonavir was determined in permissive African green monkey kidney Vero E6 cells (ATCC-1586) by CCK8 assay before the antiviral assay was carried out. Then, Vero E6 cells were treated with a series of concentrations of the two compounds, followed by infection with a clinical isolate of SARS-CoV-2 (nCoV-2019BetaCoV/Wuhan/WIV04/2019) (Zhou et al. 2020) at a multiplicity of infection (MOI) of 0.2. At 48 h p.i., viral copy numbers in the cell supernatant were quantified using quantitative real time PCR (qRT-PCR). The results showed that the half maximal inhibition concentration (IC50) and half cytotoxic concentration (CC50) values of lopinavir were ~ 12.01 μmol/L and 80.82 μmol/L, respectively, with the selectivity index (SI) of ~ 6.73 (Fig. 1A, upper left panel). For ritonavir, the IC50 and CC50 values were 19.88 μmol/L and 94.71 μmol/L (SI = 4.76), respectively (Fig. 1A, upper right panel). Meanwhile, the infected cells were fixed and subjected to immunofluorescence assay (IFA) using anti-sera against viral nucleocapsid protein (NP), and the results were in accordance with the qRT-PCR results, as evidenced by the decreased NP expression levels after the treatment of lopinavir and ritonavir at the indicated concentrations (Fig. 1B, upper panels).
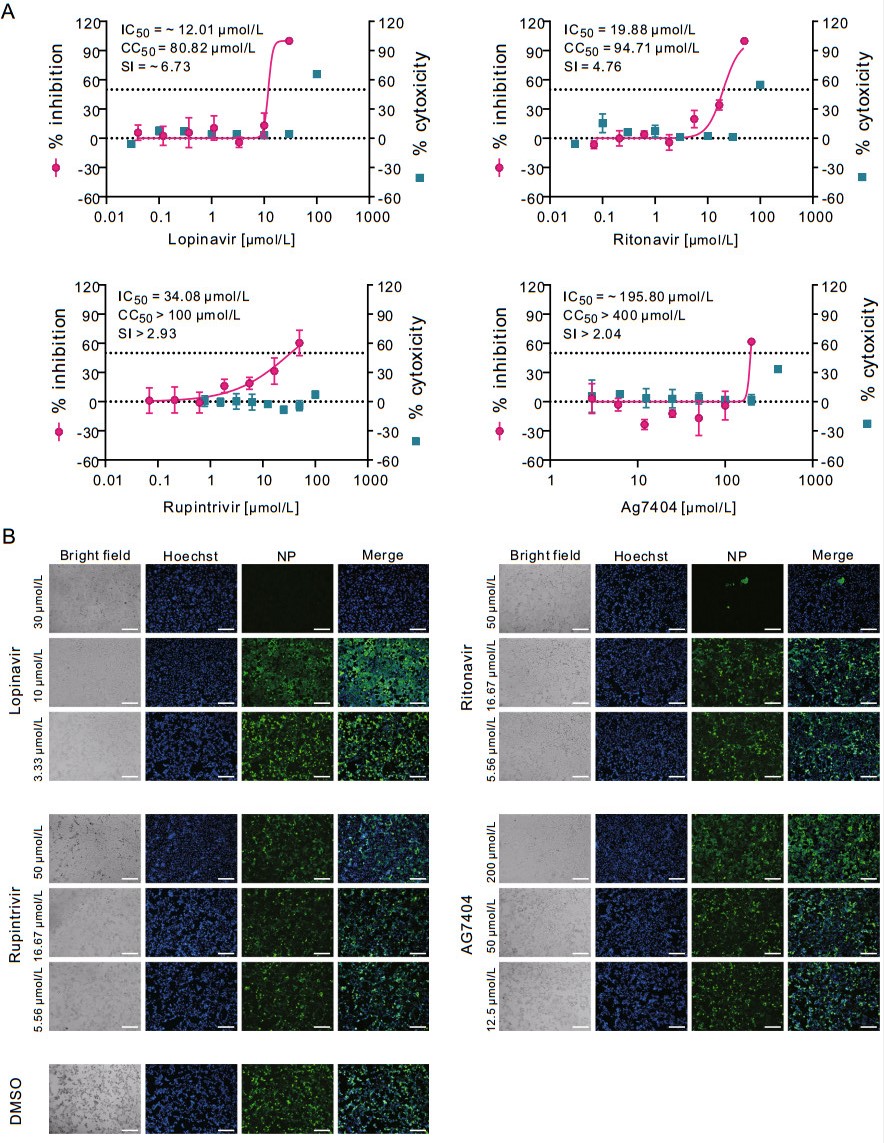
Figure 1. In vitro inhibition of viral protease inhibitors against SARS-CoV-2 in Vero E6 cells. Vero E6 cells were infected with SARS-CoV-2 at an MOI of 0.2 in the treatment of different concentrations of the indicated compounds or DMSO control. At 48 h p.i., cell supernatants were collected and cells were fixed. A The viral yield in the cell supernatant was quantified by qRT-PCR. Cytotoxicity of these drugs to Vero E6 cells was measured by CCK-8 assays. The left and right Y-axis of the graphs represent mean % inhibition of virus yield and % cytotoxicity of the drugs, respectively. The experiments were done in triplicates. B Fixed cells were subjected to IFA by employing anti-NP rabbit sera. The nuclei were stained with Hoechst dye. Bars, 100 μm.
To further investigate whether lopinavir and ritonavir are effective in inhibiting SARS-CoV-2 replication in human cells, the efficacy of these two drugs in human liver cancer Huh7 cells were evaluated (MOI = 0.1). The results showed that lopinavir (IC50 = 7.79 μmol/L; CC50 = 64.43 μmol/L; SI = 8.27) and ritonavir (IC50 = 11.68 μmol/L; CC50 = 83.73 μmol/L, SI = 7.17) could also block virus infection in Huh7 cells (Fig. 2A, upper panels). Similarly, the IFA confirmed the inhibitory effect of lopinavir and ritonavir against SARS-CoV-2 (Fig. 2B, upper panels). To be noted, the lower MOI was used for infection of Huh7 cells (MOI = 0.1) compared to that for Vero E6 cells (MOI = 0.2), therefore less amounts of Huh7 cells compared to Vero E6 cells were found to be infected at 48 h p.i. (Fig. 1B and 2B, the DMSO control group). This may partially explain the decreased IC50 values for both drugs in Huh7 cells compared to the counterparts in Vero E6 cells.
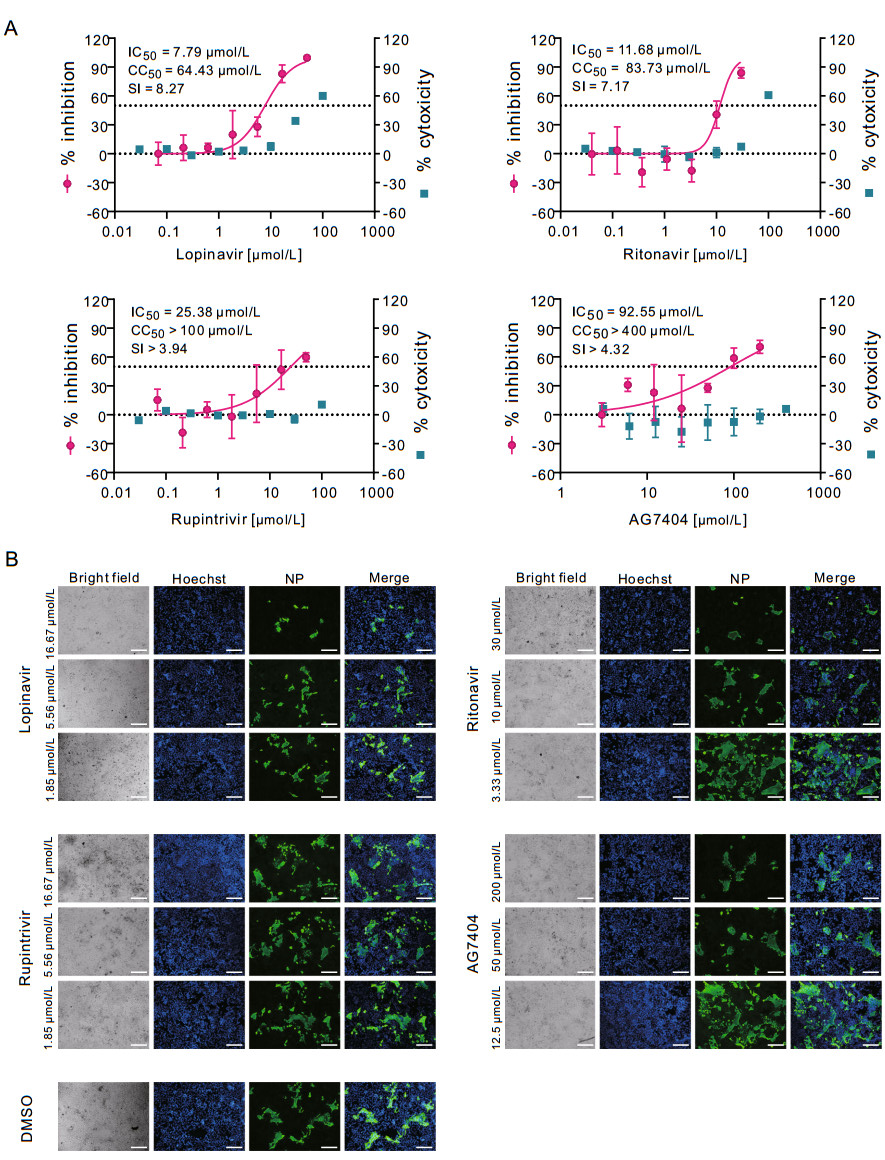
Figure 2. In vitro inhibition of viral protease inhibitors against SARS-CoV-2 in Huh7 cells. Huh7 cells were infected with SARS-CoV-2 at an MOI of 0.1 in the treatment of different concentrations of the indicated compounds. At 48 h p.i., cell supernatants were collected and cells were fixed. A The viral yield in the cell supernatant was quantified by qRT-PCR. Cytotoxicity of these drugs to Vero E6 cells was measured by CCK-8 assays. The left and right Y-axis of the graphs represent mean % inhibition of virus yield and % cytotoxicity of the drugs, respectively. The experiments were done in triplicates. B Fixed cells were subjected to IFA by employing anti-NP rabbit sera. The nuclei were stained with Hoechst dye. Bars, 100 μm.
-
To explore at which stages of infection lopinavir and ritonavir functioned, time-of-drug-addition assay was performed as described previously (Liu et al. 2020). Compounds were added during or after virus entry, and virus production in the cell supernatants and NP expression in the infected cells were measured at 14 h p.i. As shown in Fig. 3A, both compounds inhibited SARS-CoV-2 infection after virus entry, but not during virus entry, suggesting that these drugs acted at post-entry stages of the SARS-CoV-2 infection in Vero E6 cells. This is in accordance with the presumed mode of action of lopinavir and ritonavir as viral protease inhibitors, which is supposed to inhibit virus replication by interfering viral polypeptide processing. However, this hypothesis needs further experimental evidence.
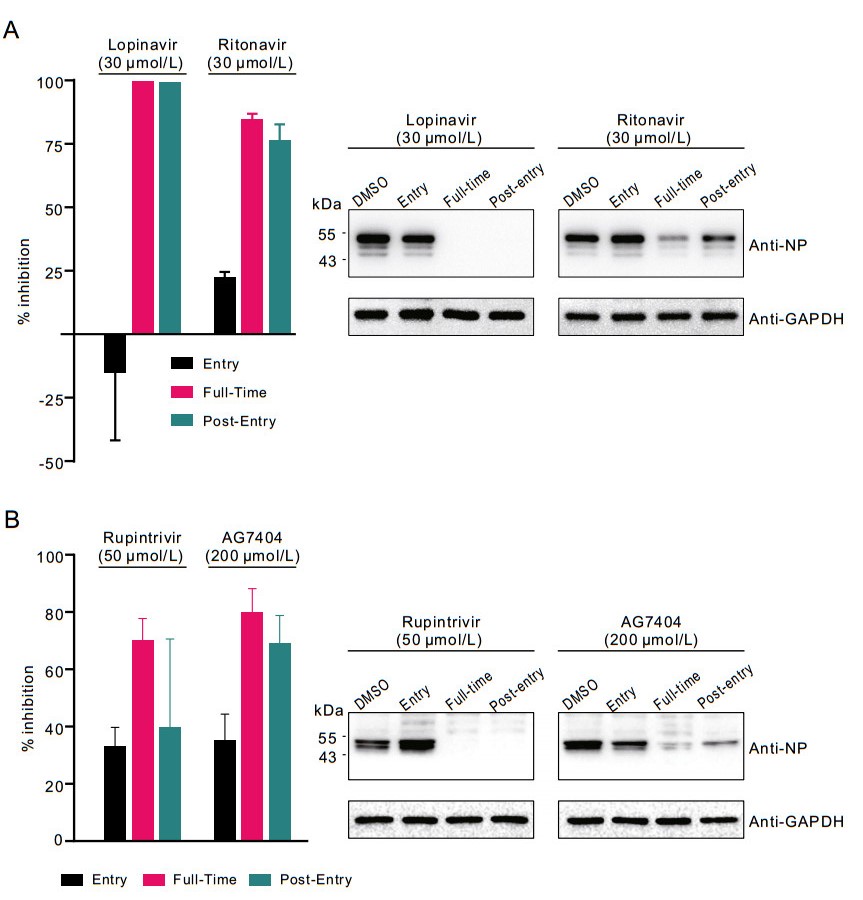
Figure 3. Time-of-drug-addition experiment of viral protease inhibitors. Time-of-drug-addition experiment of lopinavir and ritonavir (A) or rupintrivir and AG7404 (B). For "full-time" treatment, Vero E6 cells were pre-treated with indicated compounds for 1 h, and infected with SARS-CoV-2. Two hours later, the virus–drug mixture was removed, and the cells were cultured with compound-containing medium until the end of the experiment. For "Entry" treatment, Vero E6 cells were pre-treated with indicated compounds for 1 h, and infected with SARS-CoV-2. Two hours later, the virus–drug mixture was removed, and the cells were cultured with fresh culture medium until the end of the experiment. For "Post-entry" experiment, Vero E6 cells were infected with SARS-CoV-2. Two hours later, the virus-containing medium was removed, and the cells were cultured with compound-containing medium until the end of the experiment. For all treatments, an MOI of 0.2 was used for lopinavir and ritonavir groups, and an MOI of 0.05 was used for rupintrivir and AG7404 groups. At 14 h p.i., virus yield in the infected cell supernatants was quantified by qRT-PCR (left) and NP expression in infected cells was analyzed by Western blot (right).
-
As mentioned before, apart from lopinavir and ritonavir, we also tested rupintrivir and AG7404. In both Vero E6 cells and Huh7 cells, rupintrivir inhibited SARS-CoV-2 infection only at high drug concentrations (Vero E6: IC50 = 34.08 μmol/L; CC50 > 100 μmol/L, SI > 2.93; Huh7: IC50 = 25.38 μmol/L; CC50 > 100 μmol/L, SI > 3.94); while AG7404 inhibited SARS-CoV-2 infection at even higher concentrations (Vero E6: IC50 ~ 195.8 μmol/L CC50 > 400 μmol/L, SI > 2.04; Huh7: IC50 = 92.55 μmol/L; CC50 > 400 μmol/L, SI > 4.32) (Figs. 1A and 2A, lower panels). The antiviral activities of these compounds were also confirmed by IFA (Figs. 1B and 2B). By using high drug concentrations, both rupintrivir and AG7404 were demonstrated to inhibit SARS-CoV-2 at the stages post virus infection (Fig. 3B), which was similar to the possible mechanism of lopinavir and ritonavir in antagonizing SARS-CoV-2 infection.
-
To explore the molecular interaction pattern, the coordinates of X-Ray crystal structure of the 3CLpro from the SARS-CoV-2 (PDB number: 6LU7; Resolution: 2.16Å) were used as the template to dock the four inhibitors (lopinavir, ritonavir, rupintrivir and AG7404). The structure was refined by performing an energy minimization with Schrodinger software using protein preparation module. The docking results indicated that Lopinavir as ligand gave the highest score (− 9.327) (Fig. 4), suggesting it might be a potent inhibitor interacting with the SARS-CoV-2 3CLpro active site residues. Comparative active site analysis of SARS-CoV (1Q2W) and SARS-CoV-2 3CLpro showed highly conserved residues Thr23 (in model Thr25), His39 (His41), Cys42 (Cys44), Tyr48 (Tyr54), Cys139 (Cys145), His157 (His163), Glu160 (Glu166), and Gln183 (Gln189). The active site residues in SARS-CoV-2 3CLpro His41, Cys145 and Glu166 are directly involved in biding with lopinavir which was successively docked over the active site of the crystal structure. The docking scores of − 8.522, − 7.239 and − 6.414 were obtained for ritonavir, rupintrivir and AG7404, respectively (Fig. 4), implying that the binding of the catalytic site was not as ideal as lopinavir. The crystal structures of SARS-CoV-2 3CLpro in complex with inhibitors supported the antiviral efficacy of the four drugs (Figs. 1 and 2), and shed light onto the possible drug binding mechanism, as well as the development of novel 3CLpro inhibitors against novel SARS-CoV-2.
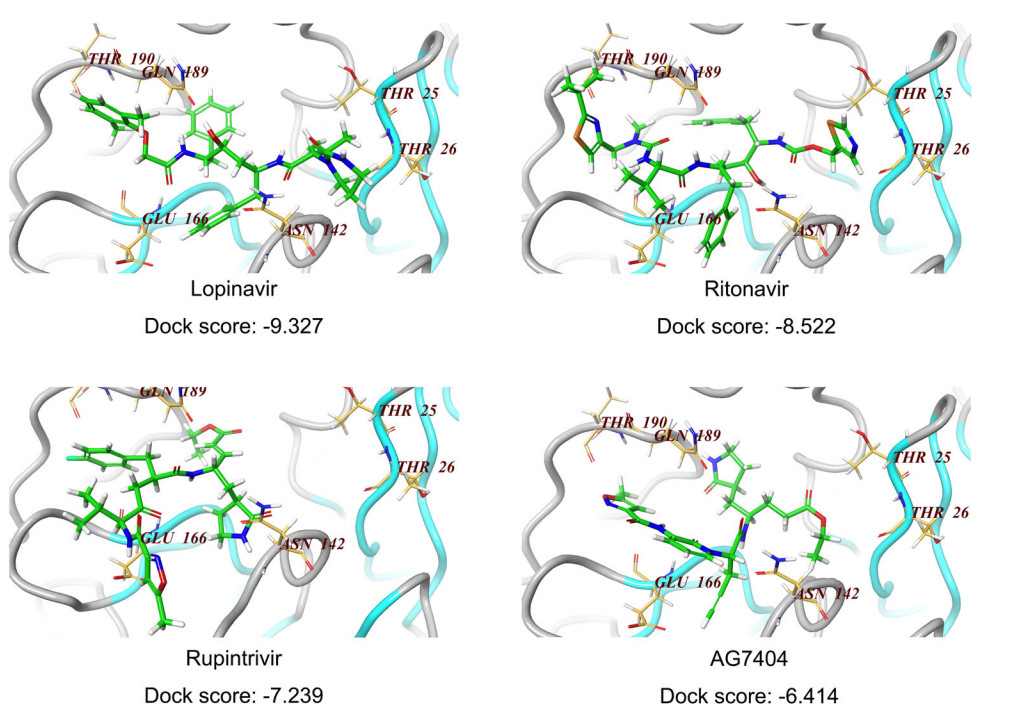
Figure 4. Docking of compounds on active site of SARS-CoV-2 3CLpro homology model. For molecular docking, the compounds (lopinavir, ritonavir, rupintrivir, AG7404) were built and subjected to the optimize geometry calculation in mechanics using MMFF94 parameter at DS2.5. The compounds were then docked at the homology model of SARS-CoV-2 3CLpro using Schrodinger Glide program. The docking scores of these four compounds were calculated and listed below.
-
To assess the antiviral activity against SARS-CoV-2 by lopinavir and ritonavir in vivo, and figure out whether lopinavir and ritonavir still worth further clinical trials, in vitro IC50 values toward SARS-CoV-2 and HIV and in vivo exposure were summarized and compared (Table 1). The Cmax of lopinavir and ritonavir following administration of 400 mg of lopinavir and 100 mg of ritonavir to healthy male volunteers are 13.5 μmol/L and 0.15 μmol/L, respectively, however, it is well recognized that only a free drug that is unbound to plasma proteins can move freely across cellular membranes to distribute between plasma and tissue (http://www.fda.gov/cder/foi/nda/2000/21-226_Kaletra_biopharmr_P1.pdf). Thus, it is generally thought that free concentrations in plasma should be equivalent to free concentrations in tissue at the steady state, which contributes to therapeutic effects (Smith et al. 2010). Considering the free concentration of lopinavir and ritonavir on clinic relevant level (0.2 μmol/L and 0.002 μmol/L, respectively) is well below the in vitro inhibition of SARS-CoV-2 in Vero E6 cells and Huh7 cells, the antiviral effect against SARS-CoV-2 is not likely achievable in vivo (or in clinic) with the dosing regimen in the proposed COVID-19 treatment. In contrast, the mean IC50 values of lopinavir against several clinical isolates of HIV-1 subtype B ranged from 4 to 11 nmol/L in the absence of serum (Abbott Laboratories, European Medicines Agency). Even At the end of the dosage interval, the mean trough concentrations (Ctrough) of lopinavir was as low as 5.3 μmol/L with protein adjusted unbound concentration of ~ 80 nmol/L, which is still more than 10-fold higher than its in vitro IC50 against HIV (Smith et al. 2010). Regarding to ritonavir, considering the low free plasma concentration (2–0.6 nmol/L), the in vivo activity of ritonavir could be ignored. To sum, the IVIVE of lopinavir and ritonavir suggested that these two drugs are far from capable of inhibiting SARS-CoV-2 in vivo.
Drug Virus In vitro efficiacy (µmol/L) In vivo concentration (µmol/L) IC50 (µmol/L) Cmax Unbound Cmax Cmin Unbound Cmin Lopinavir SARS-CoV-2 7.79–12.01 13.5b 0.2c 5.3d 0.08d HIV 0.004–0.011a Ritonavir SARS-CoV-2 11.68–19.88 0.15e 0.002 0.038e 0.0006 HIV 0.022–0.16e Unbound Cmax and unbound Cmin represent the free plasma concentration after protein-binding correction. Protein bindings of lopinavir and ritonavir are 98%–99%. 98.5% were used here to calculate the unbound values.
In vitro anti-HIV activity values used here obtained from the in vitro activity study absence of human albumin.
aData obtained from Abbott Laboratories and European Medicines Agency.
bData obtained from http://www.fda.gov/cder/foi/nda/2000/21-226_Kaletra_biopharmr_P1.pdf.
cData obtained from referenceGulati et al. (2009) .
dData obtained from referenceMurphy et al. (2001) .
eData obtained from reference Cvetkovic and Goa (2003).Table 1. Comparation of lopinavir and ritonavir in vitro antiviral efficacy against SARS-CoV-2 or HIV and in vivo plasma exposures.
In Vitro Antiviral Activity of Lopinavir and Ritonavir
Time-of-Drug-Addition Assay of Lopinavir and Ritonavir
In Vitro Antiviral Activity and Stage of Action of Rupintrivir and AG7404
Molecular Docking
In Vitro to In Vivo Extrapolation
-
In this study, we tested the anti-SARS-CoV-2 activities of lopinavir/ritonavir, rupintrivir and AG7404 in vitro. The IC50 values of lopinavir and ritonavir against SARS-CoV-2 were ~ 10 and ~ 15 μmol/L, respectively, which were lower than the IC50 values determined by another study group, which claimed that the IC50 values of lopinavir and ritonavir were 26.63 μmol/L, and > 100 μmol/L (Choy et al. 2020). And this may because different sources of SARS-CoV-2 were used, since the IC50 value of remdesivir determined by this research was 23.15 μmol/L, which is much higher than the value in our previous study (Wang et al. 2020). To provide better analytic information to therapeutic strategy and efficacy of LPV/r against SARS-CoV-2, pharmacokinetics profile and drug–drug interaction should be taken into consideration. As mentioned in Table 1, the low concentration of free lopinavir could hardly support the efficacy in vivo. Additionally, although LPV/r are well tolerated under the suggested dosing regimen in HIV patients, potential drug–drug interaction liability via Cytochrome P450 (CYP) enzymes should be take into consideration. LPV/r is an inhibitor of CYP3A in vitro. Coadministration of LPV/r and drugs metabolized primarily by CYP3A may result in increased concentrations of the other drugs. LPV/r is also metabolized by CYPs and has been shown, in vivo, to induce its own metabolism and results in increase the biotransformation of some drugs metabolized by CYPs. Many medicines are contraindicated to LPV/r due to drug–drug interactions. As a result, a number of drugs may require dosage adjustments or additional monitoring to avoid potentially drug–drug interactions with LPV/r. Currently, multiple drugs are utilized including many traditional Chinese medicines for COVID-19 treatment. Combination of LPV/r with other medicines could induce potential risk.
Common side effects of Kaletra include gastrointestinal upset, nausea, diarrhea, fatigue, rash, headache, and, with long term use, lipodystrophy and dyslipidemia, some of which was also observed in recent emergent use on treating of SARS-CoV-2 patients. Some clinicians were concerned on the adverse events, arguing that Kaletra were not a good choice to fight SARS-CoV-2 considering the potential risks. Our research revealed that Kaletra was indeed effective in inhibiting SARS-CoV-2 in vitro, however, the drug concentration in blood could hardly achieve the level needed to inhibit virus propagation. This was in accordance with recent clinical studies, showing that LPV/r was ineffective relieving symptoms or accelerating virus clearance in COVID-19 patients (Cao et al. 2020). To conclude, our research suggested that administration of LPV/r under standard dose could hardly provide any benefit to COVID-19 patients, and adjustment of dosing regimen will not lead to clinical benefit due to the very low unbound Cmax of lopinavir. Further clinical trial of LPV/r is not recommended. Nevertheless, this research provided useful information for design of novel anti-SARS-CoV-2 protease inhibitors.
-
We thank Hao Tang, Jia Wu, Jun Liu and Tao Du from BSL-3 Laboratory of Wuhan Institute of Virology for their critical support. This work was supported in part by grants from the National Science and Technology Major Projects (Grant Number 2018ZX09711003), National Key Research and Development Project (2020YFC0841700), the National Natural Science Foundation of China (Grant Number 31621061), and the Hubei Science and Technology Project (Grant Number 2020FCA003).
-
WZ, MW, GX, ZH, RC, and LZhang conceived and designed the experiments; JL, MX, YW, WS, XW, HZ, XJ, YS, HH, YL, LZhao, WL, YL, XG and XZ participated in multiple experiments; ZLS, FD, and XLY provided the virus; GZ provided AG7404; JL, WZ, ZH, GX, MW, RC, XZ and LZhang analyzed the data; LZhang, M., WZ, RC, and ZH wrote the manuscript; WZ, MW, and GX, provided the final approval of the manuscript.
-
The authors declare that they have no conflict of interest.
-
This article does not contain any studies with human or animal subjects performed by the author.

 DownLoad: