


HTML
-
Globally, as of 30 November 2020, there have been 62,195,274 confirmed cases of COVID-19 caused by severe acute respiratory syndrome coronavirus 2 (SARS-CoV-2), including 1,453,355 deaths, according to the WHO (WHO 2020a). SARS-CoV-2 nucleic acid could be detected in pharynx, bronchoalveolar lavage fluid and feces of patients (Zhang et al. 2020), which is associated with angiotensin-converting enzyme 2 (ACE2), the receptor of SARS-CoV-2, existing in multiple organs of the host (Wang and Xu 2020; Xu et al. 2020).
One significant characteristic of COVID-19 different from other coronavirus infections is that the symptoms vary from patients to patients (Arashiro et al. 2020). As reported in a clinical analysis (Park 2020), fever and respiratory symptoms started from 3 to 7 days after exposure to SARS-CoV-2. Among the patients, 80% had no or mild to moderate pneumonia, and approximately 20% had severe pneumonia. Different studies have tried to find the factors contributing to various COVID-19 symptoms. For example, Li et al. (Li et al. 2020) found that the dead COVID-19 patients had lower percentages in counts of CD3+, CD4+, and CD8+ lymphocytes than that of the survivors, which has strong predictive values for in-hospital mortality, organ injury, and severe pneumonia. In order to identify the factors determining the transition of symptoms from mild to severe, used proteomics and metabolomics to determine the markers in patients with COVID-19. There were 22 proteins and 7 metabolites screened from serum through a machine learning prediction. With them, COVID-19 patients may have a high probability to develop into severe cases (Shen et al. 2020a).
Many studies have proven that microbiota is an important component of human body (Kamada et al. 2013; Lopez and Skaar 2018). Some evidences indicate that microbiome plays an important role in modulating immune response against pathogen infections (Vesterbacka et al. 2017; Hanada et al. 2018). Vice versa, during viral pathogen infections, such as influenza and AIDS, the secondary bacterial infections might happen and disrupt the balance of the original microbiota (Vesterbacka et al. 2017; Hanada et al. 2018; Tsang et al. 2020). Recent studies have shown that the microbiome of the upper respiratory tract also affects human health (De Boeck et al. 2020). Some scientists have also noticed the relationship between microbiota and COVID-19 infections (Khan and Khan 2020; Shen et al. 2020b; Zuo et al. 2020). For example, Tao et al. performed gut shotgun metagenome analysis of fecal samples from patients with COVID-19 in Hong Kong (Zuo et al. 2020). They found that the patients with COVID-19 had significant alterations in fecal microbiomes compared with the controls, characterized by enrichment of opportunistic pathogens and depletion of beneficial commensals at all time points during hospitalization. According to their results, the severity of the disease may be reduced by altering gut microbes. But it is not clear whether the similar conclusion could be extended in other organs within the patients. Furthermore, the enriched opportunistic pathogens identified may contribute to controlling the secondary bacterial infection, which is also a risk for COVID-19 critical patients. It has been reported that the secondary bacterial infection rate of the COVID-19 patients was between 1% and 10% (Huang et al. 2020).
In the current study, microbiome difference between SARS-CoV-2 RT-qPCR (quantitative reverse-transcription polymerase chain reaction) positive and negative pharyngeal swabs from suspected patients were analyzed. Pharyngeal swabs are chosen because SARS-CoV-2 is transmitted through contacting with the upper respiratory tract and the swabs are easily available since they are normally collected for the detection of SARS-CoV-2 by RT-qPCR due to that they contain relatively high viral loads after onset of symptoms (Lippi et al. 2020; WHO 2020b).
-
Pharyngeal swabs in viral transportation medium (VTM) were collected from 22 suspected COVID-19 patients with the symptoms of fever and cough at the First People's Hospital of Jiangxia District in Wuhan during the period from 25 January 2020 to 10 February 2020. All the patients had the typical symptoms of COVID-19 such as fever and cough. The pharyngeal swab samples were inactivated at 56 ℃ for 1 h. The samples were shaken and mixed with a vortex before nucleic acid extraction. RNA extraction was performed according to the instructions of QIAamp Viral RNA Mini Kit (Qiagen, Hilden, Germany). The quality and quantity of the RNA were determined by Nanodrop (ND-2000, Thermo Fisher, Waltham, MA, USA). All samples were tested by RT-qPCR targeting RBD sequence of SARS-CoV-2 spike protein. The primers and probes used were as follows: forward primer: 5′-CAATGGTTTAACAGGCACAGG-3′, reverse primer: 5′-CTCAAGTGTCTGTGGATCACG-3′, probe: 5′- FAM-ACAGCATCAGTAGTGTCAGCAATGTCTC-BHQ1-3′. The primers and the probe were synthesized by Sangon Biotech Co., Ltd. (Shanghai, China). Quantitative reverse transcription PCR (RT-qPCR) was performed using LightCycler® Multiplex RNA Virus Master (Roche Diagnostics GmbH, Mannheim, Germany). Briefly, the 5× RT-qPCR reaction mixture (4 μL each) was mixed with 2 μL of 10× primer and probe mixture, 0.1 μL of RT enzyme solution, 8.9 μL of water, and 5 μL of RNA template and performed in a CFX96 Touch™ Real-time PCR detection System (CFX96, Bio-Rad Laboratories, Hercules, CA, USA) with an initial reverse transcription step at 50 ℃ for 10 min, next denaturation step at 95 ℃ for 2 min, then 40 cycles of denaturation at 95 ℃ for 10 s, annealing at 60 ℃ for 45 s with fluorescent signals acquisition and the last step at 40 ℃ for 30 s.
-
The transcriptome sequencing was performed to confirm the molecular diagnosis results. The cDNA was synthesized firstly using TaKaRa PrimeScript IV 1st strand cDNA Synthesis kit (Takara Bio Inc., Kusatsu, Shiga, Japan) and ds-cDNA Synthesis Module 2 (Vazyme Biotech Co., Ltd, Nanjing, China). The sequencing libraries were prepared using VAHTS Universal Plus DNA Library Prep Kit. Paired-end sequencing was performed on the MGI-seq2000 platform (MGI Tech Co. Ltd, Shenzhen, China). The cDNA synthesis, library preparation and sequencing were performed by the Frasergen Bioinformatics Co., Ltd, Wuhan, China. For metagenomic sequencing, total DNA was extracted with QIAamp DNA Mini Kit (Qiagen, Hilden, Germany) according to the instruction of the manufacture. Library preparation and sequencing were performed as described above producing 150 bp pair-end reads.
-
Transcriptome data and metagenomic data were processed by filtering the host genome sequences first using the fastq screen software (version 0.14.0, with the options chose—aligner bowtie2—nohits, http://www.bioinformatics.babraham.ac.uk/projects/fastq_screen/), respectively. The filtered data were then trimmed by Trimmomatic software (Bolger et al. 2014) (In the version 0.36, the options of LEADING: 20 TRAILING: 20 SLIDINGWINDOW: 4:20 MINLEN: 40 were chosen) to remove low quality sequences.
For the transcriptome data, we mainly focused on the SARS-CoV-2 genome assembly. Ninety-seven SARS-CoV-2 genomes were downloaded from NCBI GenBank as the references. The clean reads were mapped to these references through samtools software (version 1.9) (Li et al. 2009). The reads which were aligned to the references were extracted and transformed to fastq format by bcftools software (version 1.9, with the default options) (Narasimhan et al. 2016). The de novo assembly was performed by SPAdes (version 3.13.0, with the default options) (Bankevich et al. 2012). SARS-CoV-2 genomes or draft genomes assembled from the SARS-CoV-2 positive samples together with the references were used to do multi-sequences alignment with MAFFT (version 7.4.07, with the default options) (Katoh and Standley 2013). Since the genome fragments assembled from the samples were of uneven quality, only the genomes with high quality were used for phylogenetic tree construction. The phylogenetic analysis for SARS-CoV-2 was performed by FastTree (Price et al. 2009) with the options of -gtr -nt -fastest and 1000 bootstrap value. The phylogenetic tree was visualized by an online tool iTOL (Letunic and Bork 2019).
-
To compare with pharyngeal samples from healthy people, seven next-generation shotgun sequencing microbiome data of pharyngeal samples from healthy people were downloaded from the public database: www.hmpdacc.org/hmp/resources/. The open access number of the healthy control group is listed in Supplementary Table S1. All the clean data were assembled using the megahit software (version 1.1.3, with the default options) (Li et al. 2015). After that, clean reads were mapped to the contigs by bowtie2 (Langmead and Salzberg 2012). In order to minimize the errors due to the sequencing differences between samples, the RPKMs (Reads Per Kilobase per Million mapped reads) value, which was used to describe the relative abundance of each microorganism or virus, was calculated and normalized based on the lengths and the numbers of the contigs of the mapped reads in each sample (Li et al. 2009; Han et al. 2018). Besides, the species annotation of each contig was processed by kraken2 (Wood and Salzberg 2014).
The downstream analysis was mainly processed in the R language program (version 3.5.3; https://cran.r-project.org/bin/windows/base/old/3.5.3/). The principal coordinates analysis (PCoA) based on the Bray-Curtis distances was calculated with the vegan package (Oksanen 2014). For the analysis of the differential species (including SARS-CoV-2) abundance, owing to the lack of an optimal single method in current studies (Zhang et al. 2019), the analysis of the abundance difference between groups was performed by two diverse methods. One method was the combination of Linear Discriminant Analysis (LDA) together with the Kruskal-Wallis (KW) sum-rank test, which was completed by the software LEfSe (with the default options) (Segata et al. 2011) commonly used for differential species identified. Another approach was edgeR (Robinson et al. 2010) in conjunction with the LIMMA package (Ritchie et al. 2015), a generalized linear model, which has been found to have the best overall performance in a metagenomic profile (Jonsson et al. 2016; Zhang et al. 2019). Here, when determining the differential abundance species via edgeR, the abundance level of species with an absolute value log2 fold change ≥ 2 and P value ≤ 0.05 would be filtered as differentially abundant species.
-
Streptococcus suis and S. agalactiae were grown on Todd Hewitt agar (THA). E. coli, Acinetobacter baumannii, and Bacillus cereus were grown on Lysogeny broth agar (LBA). A single colony of each bacterial strain was inoculated into respective media and incubated overnight at 37 ℃. Colony forming unit (CFU) was then determined by plating series of dilutions on respective agar.
-
Vero cells (African green monkey kidney cell line) were cultured in DMEM containing 10% FBS, 100 units/mL penicillin and 100 µg/mL streptomycin at 37 ℃ in a 5% CO2 atmosphere. Vero cells were seeded in 24 well plates with a density of 1 × 10⁵ cells/well and grown to 80% confluence in DMEM with 2% FBS and without antibiotics. Each well was then challenged with 106 CFU of each bacterium, taking bacterial free cells as controls. Total cellular RNA was isolated from cells at 0 h, 4 h and 8 h post incubation using TRIzol (Invitrogen-Gibco, Grand Island, NY) assay as described previously (Rio et al. 2010). RNA concentration and purity were then determined using Nanodrop 1000 Spectrophotometer at 260 nm. Each of these tests was done in triplicate throughout the study.
-
The expression level of ACE2 in Vero cells cocultured with bacteria was determined by RT-qPCR using a HiScript® II One Step RT-qPCR SYBR® Green kit (Vazyme, Nanjing, China) following the manufacturer's instructions, with the primers ACE2-F (5′-CGAAGCCGAAGACCTGTTCTA-3′) and ACE2-R (5′-GGGCAAGTGTGGACTGTTCC-3′). Briefly, the amplification was performed as follows: 50 ℃ for 15 min, 98 ℃ for 2 min, followed by 40 cycles of 98 ℃ for 10 s, 60 ℃ for 15 s, and 68 ℃ for 30 s), and a default melt curve step in ABI Stepone machine. The housekeeping gene GAPDH was used as the reference gene with the primers GAPDH-F (5′-AACTCTGGTAAAGTGGAT-3′) and GAPDH-R (5′-TACTCAGCGCCAGCATCG-3′). The relative expression level of ACE2 was determined using the 2−ΔΔCt method as described previously (Livak and Schmittgen 2001) and compared to that of the control group using the Student's t test by R program (version 3.5.3; https://cran.r-project.org/bin/windows/base/old/3.5.3/).
-
All the statistical analyses were performed in the R program (version 3.5.3; https://cran.r-project.org/bin/windows/base/old/3.5.3/). The two independent groups were analyzed via Student's t-test. Data are showed as means ± SD. Statistical differences were considered significant at *P < 0.05, **P < 0.01 and ***P < 0.01.
Sample Collection and SARS-CoV-2 Detection
DNA and RNA Library Construction
SARS-CoV-2 Genome Assembling
Metagenomic Data Processing
Growth of Bacteria
Cell Culture
RT-qPCR Detection of the Expression Level of ACE2
Statistical Analysis
-
The nucleic acid of SARS-CoV-2 in pharyngeal swabs was determined by RT-qPCR test targeting RBD sequence of SARS-CoV-2 spike protein. The Ct values of the 11 positive samples are shown in Table 1. The extracted RNA of the 22 samples was sent for transcriptome sequencing to verify the results of the molecular diagnosis. Sequencing results confirmed the presence of SARS-CoV-2 in the 11 RT-qPCR positive samples and no SARS-CoV-2 RNA in the 11 RT-qPCR negative samples. After analyzing the transcriptome data of the 11 SARS-CoV-2 positive samples, four complete genome sequences with high quality, four draft genomes and three genomes with some fragments were obtained (Table 1). Furthermore, the phylogenetic tree constructed with the four high-quality SARS-CoV-2 genomes and 232 reference genomes showed that the four SARS-CoV-2 genomes are different (Supplementary Fig. S1).
Sample Seq length (bp) Number of contigs Number of reads Ct value Avg depth S1 30,062 1 200,476 17.5 886 S2 29,977 1 295,310 17.1 316 S3 30,026 1 225,212 23.1 1,009 S4 29,531 7 3632 26.2 11 S5 29,660 1 292,054 23.6 35 S6 393 1 82 28.4 30 S7 27,958 10 3268 26.3 10 S8 29,889 23 2836 28.6 11 S9 1061 2 12 31.2 2 S10 2553 5 148,226 26.4 103 S11 29,296 3 8050 25.7 36 Table 1. Sequencing and RT-qPCR results of the 11 SARS-CoV-2 positive samples.
-
The chi-square test and the Student's t test confirmed that the SARS-CoV-2 detection results were not correlated with gender and age (All P > 0.05, Supplementary Table S2). For the microbiome analysis, each sample had an average of 9,852,978 reads after filtering the host genome and low-quality sequences. An average of 39,000 contigs was obtained per sample, and the detailed information is available in Supplementary Table S3. For each sample, about 75% contigs were longer than 350 bp and the average length of the contigs was about 425 bp, as shown in Fig. 1A. Contigs with the length longer than 350 bp were used for the species annotation. Altogether, a total of 6502 species were identified including 5896 bacterial taxa and 606 viral taxa belonging to 70 orders and 123 families. In particular, most of the 606 viral taxa identified were phages. In addition, the species accumulation curve in Fig. 1B shows that the total number of species gradually becomes saturated as the number of the samples increases.
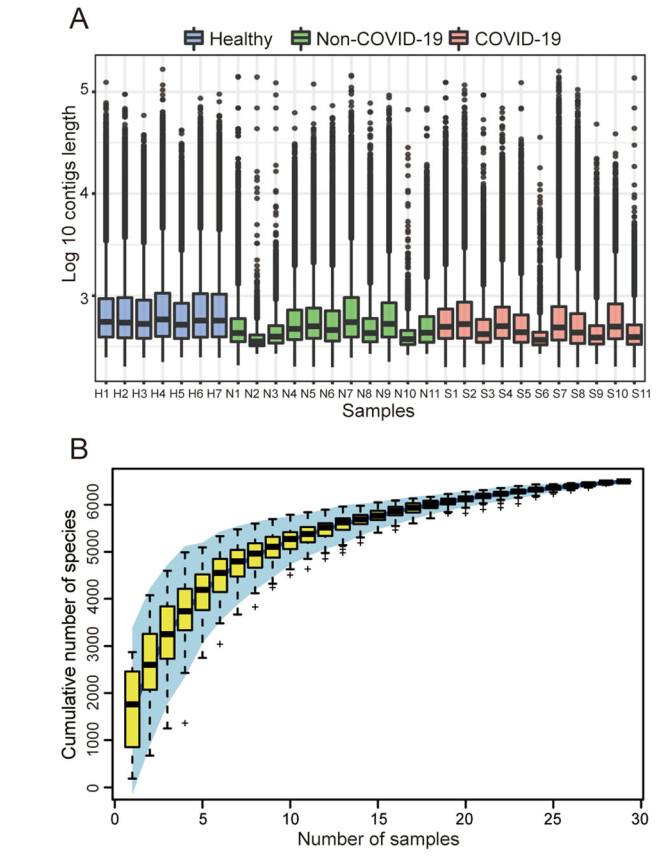
Figure 1. Basic information of the metagenomic data. A Length distribution of the contigs assembled from each sample. B Cumulative curve of the species identified in the samples.
-
Based on the annotation information, a bacterial and viral composition profile with the abundance information was achieved (Supplementary Table S4). To investigate the difference in richness and evenness of the 6502 species among the three groups, we calculated and compared the alpha diversity index, including Observed species, Shannon index as well as Pielou evenness index between the groups (Han et al. 2018). Significant differences were observed in the alpha diversity of the two patients' samples (the COVID-19 group and the Non-COVID-19 group) from the healthy people group as shown in Fig. 2A-2C (P < 0.05 in Kruskal-Wallis test). However, the Observed species and the Shannon index indicated there was no significant difference between the COVID-19 and the Non-COVID-19 groups, as shown in Fig. 2A and 2B. Interestingly, compared with the Non-COVID-19 group, the COVID-19 group had a significantly lower Pielou evenness index (Fig. 2C, P = 0.019). Due to the large number of species taxa, the top twelve abundant orders in the samples, including Bacteroidales, Lactobacillales, Caudovirales etc., were used for analyzing the taxonomic compositions. At the order level, the UPGMA cluster analysis revealed that the samples from healthy control were clustered obviously together and different from the two patient cohorts. While the taxonomic composition of the COVID-19 group showed similar to that of the Non-COVID-19 group (as shown in Fig. 2D).
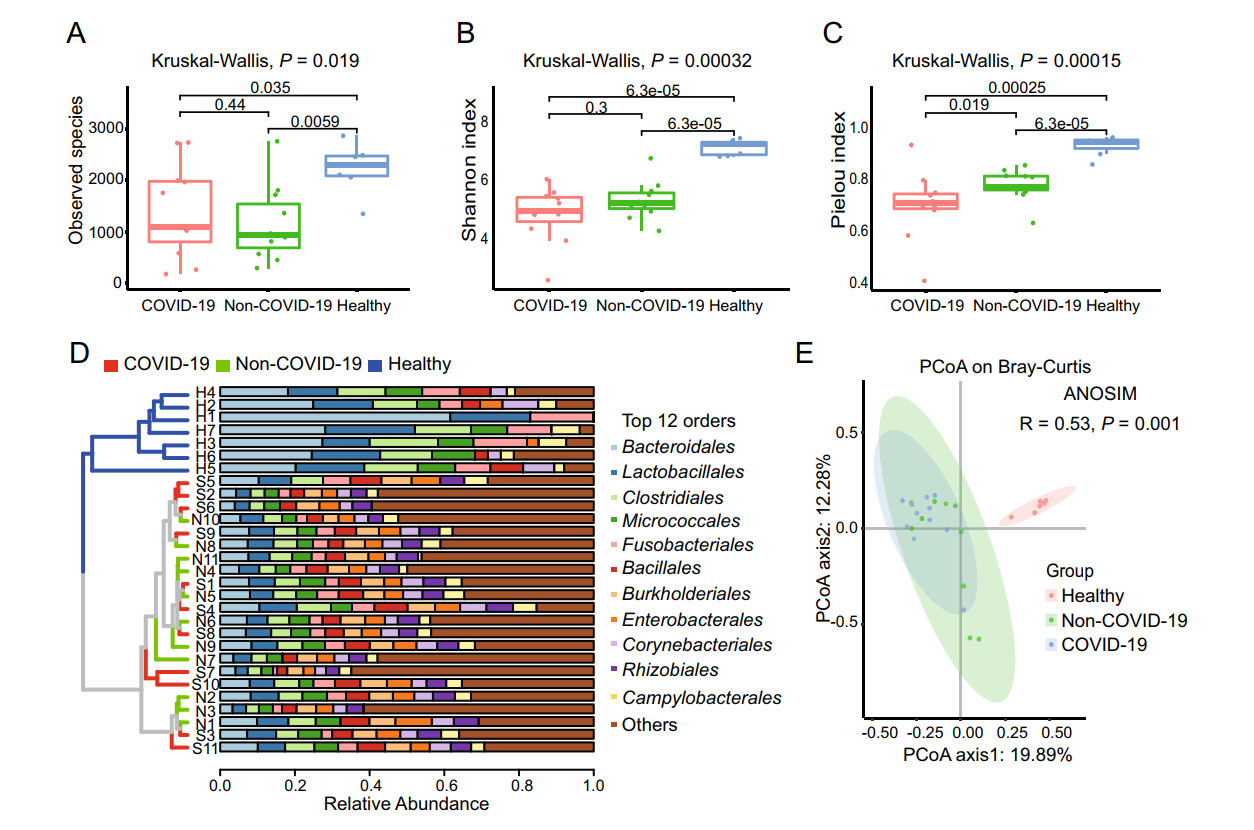
Figure 2. The microbiome difference in the pharyngeal swabs of the COVID-19 group (n = 11), the Non-COVID-19 group (n = 11) and the Healthy group (n = 7). Comparison of the alpha diversity indexes using Observed species (A), Shannon index (B), and Pielou index (C) based on the metagenomic profiles at the species level. The Kruskal-Wallis test is used for significance calculation. D Samples clustered by UPGMA using Bray-Curtis distance (left), and top twelve abundant orders with the relative abundance in the corresponding samples (right) at the order level. E Principal Coordinate Analysis (PCoA) of the species present in more than 20% of all samples based on the Bray-Curtis distance. ANOSIM, R = 0.53, P = 0.001.
Then the Principal Coordinates Analysis (PCoA) was performed to investigate the similarity of the microbiome in the three cohorts based on the Bray-Curtis distance. In order to reduce individual difference, 3069 species which present in at least twenty percentage of all samples (≥ 6 samples) except SARS-CoV-2, were chosen for analysis. Similar to the results of alpha diversity, there was a clear separation in the beta diversity results between the healthy control group and the patient groups. (Fig. 2E, ANOSIM, R = 0.53, P = 0.001).
-
We further studied the distribution of the 1090 species presented in over 60% of all samples (≥ 18 samples) to find if there are some opportunistic pathogens enriched in the COVID-19 group, which may contribute to the secondary infections in COVID-19. From the linear discriminant analysis (LDA), it was found that there were 37 species with highly discriminated abundance among the groups. As shown in Fig. 3A, all these species had much higher abundance in the patient groups than that of the healthy group. It was also worth noting that most of these species had higher abundance in the COVID-19 group than that of the Non-COVID-19 group, including some opportunistic pathogens such as Streptococcus and Prevotella (Fig. 3A). Comparative analysis of the differential abundance species by the generalized linear model showed that there were 81 species except SARS-CoV-2 having higher abundance in the COVID-19 group than that of the Non-COVID-19 group, and no species having lower abundance (Fig. 3B). The species ranked by log2 fold increase in the abundance were shown in the Supplementary Table S5. Among them, 51 species were found enriched at least 8 folds in the COVID-19 group compared with that in the Non-COVID-19 group (Supplementary Table S5), and the top three enriched genera were Streptococcus, Prevotella, and Campylobacter. Mapping the reads of each sample back to the genome of each enriched species identified by the generalized linear model confirmed the enrichment (Supplementary Figure S2, all with P < 0.05). Furthermore, the heatmap clearly showed that the abundance of the enriched species identified via LDA method and generalized linear model in the 3 groups (Fig. 3C).
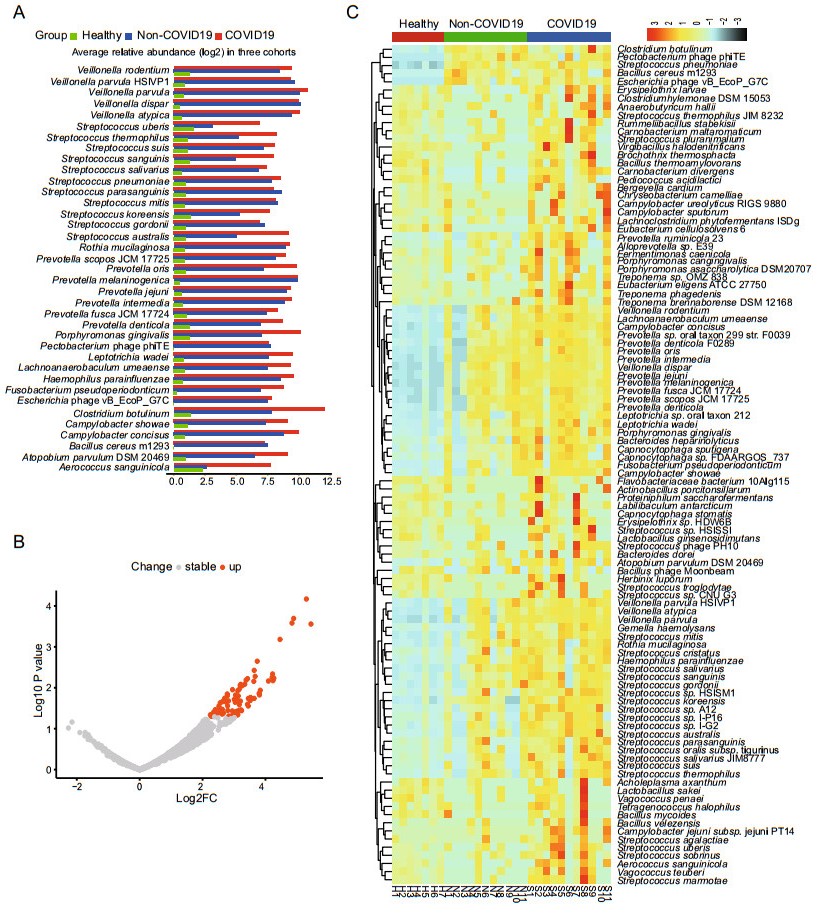
Figure 3. Analysis of species with differential abundance among the COVID-19, Non-COVID-19 and healthy cohorts. A Average relative abundance of the most discriminated species identified by linear discriminant analysis in three cohorts. B Differential abundance species identified by comparative analysis of the COVID-19 and the Non-COVID-19 group via generalized linear model. C Heatmap showing the abundance changes of all the significantly differential species among the three cohorts.
-
Cell protein ACE2 is considered as the receptor for SARS-CoV-2 binding to the host. Previous studies found the dynamic variation of ace2 gene expression can be in response to Pseudomonas aeruginosa infection (Sodhi et al. 2019), and periodontopathic bacteria may enhance the SARS-CoV-2 infection by increasing the expression of ACE2 (Takahashi et al. 2020). In order to understand if the enriched opportunistic pathogens may play certain roles in SARS-CoV-2 infection, some enriched bacteria in the COVID-19 group were chosen to study their effects on the expression of ACE2 of Vero cells in vitro. Because most species among the 51 species enriched at least 8 folds belong to Streptococcus genus, two Streptococcus species, S. suis and S. agalactiae, together with other three species (Acinetobacter baumannii, Bacillus cereus and Escherichia coli) with no significant difference in abundance from the metagenomic profiles were selected for the experiment. Surprisingly, compared with the pathogen-free blank control, the two Streptococcus strains were found to be able to significantly promote the expression level of ace2 gene at 8 h after interacting the bacteria with the cells (Fig. 4), while the other three bacteria exhibited no significant effects on the expression of ACE2 (Fig. 4).
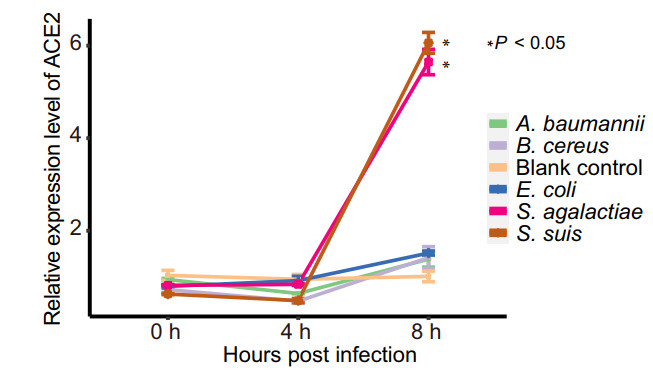
Figure 4. Relative expression level of ACE2 with time after interaction of the Vero cells with the bacteria. Each of treatment was performed three replications. The relative expression level of ACE2 was determined using the 2−ΔΔCt method (Livak and Schmittgen 2001) and compared to that of the blank control group using the Student's t test. Each point in the line chart represents the mean value of relative expression level of ACE2 at the different infection time, and the error bar represents the standard deviation.
Transcriptome Data Confirmed SARS-CoV-2 Infection
Basic Information of the Metagenomic Data
Metagenomic Characteristics of the Three Cohorts
Comparative Analysis of the Opportunistic Pathogens in the COVID-19 Pharyngeal Swabs
Effects of Two Streptococcus on the Expression of ACE2
-
It is well known that genetic and environmental factors play important roles in shaping human microbiota and immunity (Carmody et al. 2015). Microbiota may play certain roles in immune response to COVID-19 (Dhar and Mohanty 2020). Because SARS-CoV-2 is transmitted through contacting with the upper respiratory tract, pharyngeal swabs were used in the current study to find the microbiome difference between COVID-19 patients and Non-COVID-19 patients. Unlike previous studies which mainly focused on gut microbiome of hospitalized COVID-19 patients (Khan and Khan 2020; Shen et al. 2020b; Zuo et al. 2020), the microbiome in throat may be helpful for identifying risk factors for SARS-CoV-2 infection and the development of severe COVID-9 illness. Another advantage is that pharyngeal swabs can be collected easily and are compatible with the current RT-qPCR detection of SARS-CoV-2.
Based on the metagenomic sequencing data, we identified 6502 microbial taxa in the pharyngeal swabs, which showed that there exist diversified microbes in human throats. Both alpha diversity and beta diversity analysis indicated that the species diversities of the COVID-19 group and the Non-COVID-19 group were significantly lower than that of the healthy people group. The linear discriminant analysis and the generalized linear model indicated that there were 81 species having significantly increased abundance in the COVID-19 group compared with that in the Non-COVID-19 group (Fig. 3B), which supports the results of the Pielou index analysis shown in Fig. 2C. Among the species enriched in the COVID-19 group (Supplementary Table S5), the top three enriched genera were found to be Streptococcus, Prevotella, and Campylobacter. These results are consistent with the findings of a recent study (Zuo et al. 2020), showing that the opportunistic pathogens such as Clostridium hathewayi, Streptococcus parasanguinis, Actinomyces odontolyticus were enriched in the guts of the hospitalized COVID-19 patients. Further investigation on the relationship between the enriched opportunistic pathogens and the secondary infections in the COVID-19 patients would provide helpful guides for better treatment outcomes of COVID-19 patients.
It is also clearly a question to be answered whether these enriched opportunistic pathogens would affect SARS-CoV-2 infection. If so, how do they affect? In this study, we found that two Streptococcus, i.e. S. suis and S. agalactiae, can promote the ACE2 expression level in Vero cells, which indicates that they may promote SARS-CoV-2 infection. Other studies have found that the Campylobacter jejuni which is one of the enriched opportunistic pathogens identified in COVID-19 patients can cause significant inflammation, enteritis and diarrhea in humans (Konkel et al. 2001; van Vliet and Ketley 2001; Young et al. 2007). It has been reported that about 3% of COVID-19 patients had symptoms of diarrhea (Huang et al. 2020). It may be worth to do further study to see if diarrhea after SARS-CoV-2 infection would be caused by Campylobacter. While for Prevotella, Abdul et al. have found that the over-expressed Prevotella proteins can promote viral infection (Khan and Khan 2020). The Prevotella proteins are also found to be involved in multiple interactions with NF-κB which is related to the clinical severity of COVID-19 (Khan and Khan 2020). Therefore, all these studies indicated that the enriched pathogens in the COVID-19 patient group may play certain roles in SARS-CoV-2 infections. They could affect the expression of the ACE2 and/or modulate the immune system involved in the virus-host interactions.
Overall, our study reveals for the first time that there are several enriched opportunistic pathogens in the pharyngeal tracts of the COVID-19 patients compared with the uninfected people. These bacteria might be involved in the virus-host interactions to affect SARS-CoV-2 infection and cause potential secondary bacterial infections through changing the expression of the ACE2 and/or modulate the host's immune system. It also provides new clues for further investigations on elucidating whether and how microbiota in human throat would play certain roles in SARS-CoV-2 infections.
-
We would like to thank the financial supports of CAS (project No 153B42KYSB20170004) and the Wuhan National Biosafety Lab for this study. We are grateful to Ms. Lei Zhang from the Core Facility and Technical Support of Wuhan Institute of Virology for the sequencing support.
-
JY and HW generated the idea, designed the experiment and wrote the manuscript. DX performed the bioinformatic analysis and wrote the manuscript. CM and XZ performed the sequence experiments and revised the manuscript. XP and JX collected samples and extracted nucleic acids to construct libraries for sequencing. CM and HY performed the experiments of bacteria on ACE2 expression and revised the manuscript. JY and HW finalized the manuscript. All authors read and approved the final manuscript.
-
The authors declare that they have no conflict of interests.
-
Additional informed consent was obtained from all patients for which identifying information is included in this article. The study and use of all samples were approved by the Ethics Committee of Wuhan Institute of Virology, CAS (No. WIVH1720 2001).

 DownLoad: