


-
09H1N1, which is a combination of gene segments from both North American and Eurasian swine lineages[5, 20, 21], has crossed the species barrier to humans and has rapidly spread across the world. Several reports have illustrated the origin of this virus, which showed that all segments of 09H1N1 are directly related to swine influenza virus, including not only H1N1, but also the other subtypes of influenza A virus, mainly from America and Eurasian. The results also revealed that 09H1N1 is a triple reassortant of the segments from swine, avian and human influenza viruses.
It has been well established that synonymous codon usage varies both among genomes and within genomes. Several factors which can influence codon usage have been reported, such as mutational bias[9], translational selection[7], replicational and transcriptional selection [14], secondary structure of proteins [6], gene function[23], gene length[13] and environmental factors [2]. Codon usage biases of some organisms, such as bacteria, yeast, drosophila and mammals, have been examined in earlier research[15]. More recently, reports about the codon usage of RNA virus have also been reported [9, 19, 23], which show that intra-genomic synonymous codon usage bias (referred to as "codon usage bias" for brevity hereafter) of most RNA viruses is quite low.
It is well known that a detailed knowledge of codon usage biases in RNA viruses can lead to a better understanding of the processes governing their evolution, particularly the role played by mutation pressure[9]. Such information can also provide clues to the mechanisms involved in the regulation of viral gene expression and the evolution of viruses.
HTML
-
The sequences analyzed in this report were downloaded from the Influenza Virus Sequence Database[1]. Given that evolutionary analysis of 09H1N1[5, 20, 21], showed that all segments of 09H1N1 are directly related to swine influenza A virus and 09H1N1 is a triple reassortant of the segments from swine, avian and human influenza viruses, three criteria were used to select the genomes. 1). All three hosts are considered suitable for H1N1: swine, avian and human, while swine is the only host for the other strains. 2). Only full length sequences were selected, i.e., they should contain 8 complete segments. 3). Except for H1N1, the sources of the strains were limited to three regions: Asia, Europe and North America. Based on this criteria, we then applied an additional 14 sub-criteria to screen the strains with the exception of 09H1N1 (Table 1). If there were more than 5 strains satisfying the sub-criteria, the 5 most recently sequenced samples were chosen. We also selected the earliest sequenced complete 09H1N1 strain (A/New York/1669/2009(H1N1)) as a reference genome. Based on these criteria, a total of 60 strains were selected. The sources of strains and the corresponding sub-criteria are listed in Table 1.

Table 1. Details of candidate data
-
Relative synonymous codon usage (RSCU) is defined as the ratio of observed codon counts to the counts expected where codon usage is uniform. The value of RSCU close to 1.0 indicates a lack of codon bias, while greater than 1.0 it means the corresponding codon is more frequently used than expected. The values are largely independent of amino acid com-position, and widely used in comparing codon usage among gene segments that are different in size and amino acid composition.
Relative codon frequency (RF) is calculated as the ratio of the number of occurrences of codon to the sum of all synonymous codons of the same one. Compared with RSCU, RF does not consider the amino acid composition, but only reflects the codon bias in a specific amino acid.
Where nac denotes the number of the cth codon of amino a in the gene segment or genome and da denotes the degree of codon degeneracy for amino acid a.
-
GC3s is defined as the ratio of G+C content of the synonymous third codon position. GC is the proportion of G and C in all of positions. T3s, C3s, A3s and G3s denote the ratios of the specified nucleotide at the third synonymous codon position to the maximum number possible for that nucleotide without altering the amino acid composition.
-
GRAVY denotes the general average hydro-phobicity score for the conceptually translated gene product and is defined as the mean of the sum of the hydrophobic indices of each amino acid.
Aromo is calculated as the ratio of aromatic amino-acids (Phe, Tyr, Trp) in the hypothetical translated gene product.
-
For a given gene sequence, Nc is defined by:
Amino acids are divided into several classes based on the degree of codon degeneracy, i.e., the amino acids with the same degree of codon degeneracy belong to the same class.
$$\overline{{{F}_{i}}}$$ denotes the average homozygosity for the amino acid class whose degree of codon degeneracy is i. The coefficients 9, 1, 5 and 3 denote the number of amino acids belonging to different classes. Nc is generally used as an index to measure the bias of a gene, with a value from 20 to 61. The smaller Nc is, the more bias of the gene it denotes. As highly biased genes are also highly expressed, Nc is also used to evaluate the expression level of genes [17]. -
We defined the distance of two genome considering the 59 codon usage biases by:
Where Rik and Rjk denote the RSCU values of codon k of genome i and j respectively. As 60 strains were selected, A 60×60 matrix was constructed based on the distance between each genome pair. We then used the hclust function in the R statistical software package to lay out a cluster map based on the 60×60 matrix. The complete linkage method was used.
-
CA is a statistical visualization method for identifying associations between the levels of a two-way contingency table. It can transform high dimensional data into a series of axis, which contain the contribution of different factors responsible for the difference between variables. Each axis includes all of the contribution values of variables of the two-way contingency. Generally, the first two axes are used as the coordinate to layout a plot, so that the global view of the data can be easily interpreted by the distances of different variables in the plot. CA has been widely used in codon usage analysis to investigate the major trend in codon usage variation among genes. It has been proved that CA based on RSCU was biased[16] for introducing unjustified statistical weights on data, yielding biased results especially for codon usage in rare amino-acids such as Cysteine. As a variant of CA, WCA considers codons coding the same amino acid as a group, and centres the data based on the amino acid, leading to a removal of much of the bias caused by amino acid composition and codon degeneracy. The effectiveness of WCA has been demonstrated by H.Suzuki et al [18] when applying four different CA methods to 241 bacterial genomes including WCA.
-
Codon usage indices including RSCU, GC3s, T3s, C3s, A3s, G3s, GC, GC12s and dinucleotide frequencies were computed by CodonW 1.4.4 (http://codonw. sourceforge.net/). WCA, cluster analysis and statistical mapping were performed by R[8], where the ade4 [4]and seqinr packages [3] in R were used for WCA. Correlation analysis was carried out using Spearman's rank correlation method.
Materials
RSCU, RF [18]
GC3s, GC, T3s, C3s, A3s and G3s
GRAVY [11] and Aromo [12]
Effective number of codons (Nc) [22]
Distance measure and cluster analysis
Correspondence analysis (CA) and within correspondence analysis (WCA)
Software and statistic method
-
The overall RSCU values of 59 codons (two codons with degree of codon degeneracy 1 and three termination codons were excluded from calculation) of 09H1N1 and the indices for genes of 09H1N1 such as Nc and GC3s, are listed in Table 2 and Table 3. From Table 2, we found that most preferentially used codons of 09H1N1 are A-ended and U-ended, including 10 A-ended codons and 6 U-ended codons of the 20 most preferentially used codons. It was also observed that Nc values varied from 46.24(HA) to 57.29(M1). Based on these results, it can be concluded that codon usage bias of 09H1N1 is quite low.

Table 2. Synonymous codon usage in 09H1N1

Table 3. Indices for genes of 09H1N1
-
WCA on codon usage: To seek for the sources of variation of codon usage bias in 09H1N1, WCA was implemented on genome of 09H1N1 based on the AF value of each gene and ten axes containing the positions of ten genes for each axis generated. As mentioned above, the axis of WCA denotes the source of the variation among a set of multivariate data points. The top four largest trends, which can explain 65.45% of the variation accumulatively, were observed: the first axis accounts for 24.61% of the variation, whereas the next three axes accounted for 18.08%, 11.58% and 11.18% of the variation respectively. Meanwhile, a scatter map of values of first two axes produced by WCA was plotted (Fig. 1). The distance between two points on a map can be used as an indicator to measure the similarity between them. Therefore, we can clearly investigate codons preferred by specific gene and the relationship between genes in the perspective of codon bias. We can observe from the distribution of codons in Fig 1 that genes in the positive axis have preference in using A-ended codons and have lower GC composition, while genes in the negative axis incline to use T-ended codons and have higher GC composition.
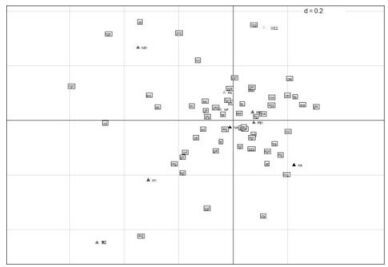
Figure 1. A scatter map of values of first two axes produced by WCA. The distance between genes can be seemed as a indicator for their codon usage similarity. A close distance means a close codon usage between genes. While the codons close to gene suggest the codons that the gene preferred.
Base composition constraint as a key factor can influence the codon usage bias of 09H1N1: Wright et al put forward the Nc-plot (Nc plotted against GC3s) as part of a general strategy to investigate patterns of synonymous codon usage[22]. A reference line was displayed to show the expected position of genes whose codon usage is only constrained by variation of GC3s. Genes, of which codon choice is constrained by GC3s originating from mutational pressure, will lie on or just below the reference line of the predicted values. It can be seen clearly from Fig. 2 that most of the points lay well below the expected curve, which indicates that the codon choice constrained by GC3s mutation bias is small and uneven. To further validate this result, the correlation coefficient between GC12s and GC3s was also calculated (r = 0.25, p = 0.49), the different base composition between intron and synonymous sites also suggested that codon usage bias of 09H1N1 is not likely the result of mutation pressure, since the effects are not the same at all codon positions[9]. To validate the other factors shaping the codon usage bias of 09H1N1, correlation coefficients between the position of genes along the first four axis and A3s, T3s, G3s, C3s, GC3s, GC12s, GC were calculated. The results are listed in Table 4. As shown from Table 4, the positions of genes along the axis 1, which accounts for substantial amount of synonymous codon usage bias of intra-genome, are significantly correlated with A3s (r= 0.91, p < 0.01), GC12s (r =-0.830, p < 0.01) and also slightly correlated with GC composition (r=0.75, p < 0.05), while the second axis of the WCA is slightly negatively correlated with T3s (r=-0.76, p < 0.05). The other indices, such as G3s, C3s, GC3s, have little relationship with the first and second axis. Taken together, the close relationship between codon usage bias and composition constraint indicated that base composition constraint is a crucial factor contributing to codon usage bias.
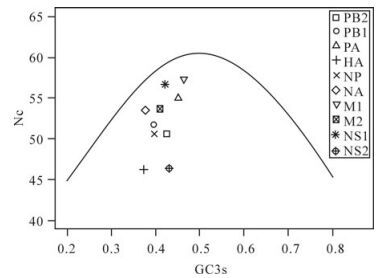
Figure 2. Nc-plot of genes of A(H1N1). A reference line indicates the expected codon usage if codon usage is only constrained by variation of GC3s.

Table 4. Correlation coefficients between values of the top four axes and indices of 09H1N1 genes
Dinucleotide biases are also a key factor determining the codon usage bias of 09H1N1: Dinucleotide biases, which are independent of the overall base composition, are present in virtually all viruses[10]and may also affect codon bias. Thus, to investigate relationship between composition of dinucleotides and the codon usage bias of 09H1N1, 16 dinucleotide frequencies were calculated for each gene (Table 5), we found that majority of dinucleotide frequencies deviate from the mean value except TT and GG. The two highest dinucleotide frequencies are AA and GA, and the first two lowest dinucleotide frequencies are CG, CC. We also calculated the correlation coefficients between the 16 dinucleotide frequencies and the position of genes along the first four axes generated by WCA (Table 6).The results suggested that TC, CG, AC and AA are correlated with the position of genes along Axis 1, among which TC, AA, CG, GC are significantly correlated (p < 0.05). There are two (GT, GA) and one (GG) dinucleotides correlated with the position of genes along the Axis 2 and Axis 3, respectively (p < 0.1). However, there is no dinucleotide correlated with the position of genes along the Axis4. These observations suggested that the composition of dinucleotides also as a factor can determine the codon usage bias of 09H1N1.

Table 5. Frequencies of 16 dinucleotides of the 10 genes respectively

Table 6. Correlation coefficients between values of the top four axes and the frequency of sixteen dinucleotides
Translational selection can also drive the codon usage bias of 09H1N1: To investigate whether translational selection, gene length, hydrophobicity of proteins and aromaticity of amino acids contribute to the codon usage bias of 09H1N1, we calculated correlation coefficients between Nc, Length, Gravy, Aromo and the position of genes along the first four axis respectively. The results indicate that only Nc (r=-0.81, p < 0.01) has a significantly negative correlation with the position of genes along the Axis 1. Because Nc can be used to evaluate the expression level of genes[17], the result suggests a close relationship between translational selection and codon usage bias. As Wright proposed that [22] the calculations of Nc for short sequences (e.g. less than 200 codons long) where there are some amino acids that are not used, can lead to inaccurate performance. At the same time, NS1 and M2, with only 121 and 97 codons, are short compared with other genes. Moreover, all of the three genes have unusual amino acid compositions, for example, NS2 has the lowest proportion of 4-fold and highest proportion of 6-fold amino acids; M2 has the second lowest proportion of 1-fold and 4-fold amino acids, and PA has the highest proportion of 2-fold amino acids. Correlation coefficient would increase to 0.93 if excluding these three genes. It has been shown that gene function also affected the inter-genome codon usage biases of different subtype influenza A virus[23]. To reveal whether genes' functions contribute to codon usage bias of 09H1N1, Ten proteins of 09H1N1 were classified into two major types: Structural proteins (HA, NA, NP, M1 and M2) and nonstructural proteins(PBl, PB2, PA, NS1 and NS2). Structural proteins participate in the assembly of virus particles and play crucial roles in the maintenance of the virus morphology, virus particles assembly, adsorption, invasion and release. While nonstructural proteins play important regulatory roles in the virus replicate cycle, without participating in the assembly of virus particles. It can be seen clearly from Fig 1 that there doesn't exist a clear boundary between these two classes. This is likely because of the existence of other factors, such as mutational pressure and translational selection, which also contribute and it is difficult to ascertain the exact correlation between codon usage bias and gene function.
Cluster analysis based on codon usage bias: We calculated the overall RSCU of 59 sense codons for each genome of 60 strains, and then plotted the cluster map for the strains, as shown in Fig. 3. It can be seen that 09H1N1 and H1N1_swine05 (A/swine/Kansas/ 77778/2007(H1N1)) are clustered together in Fig 3, indicating that they have a close relationship. Also H1N2 from Asia and North America, H3N2 from North America and H9N2 from Asia are also clustered in a large branch containing 09H1N1, suggesting a close phylogenetical relationship among them.
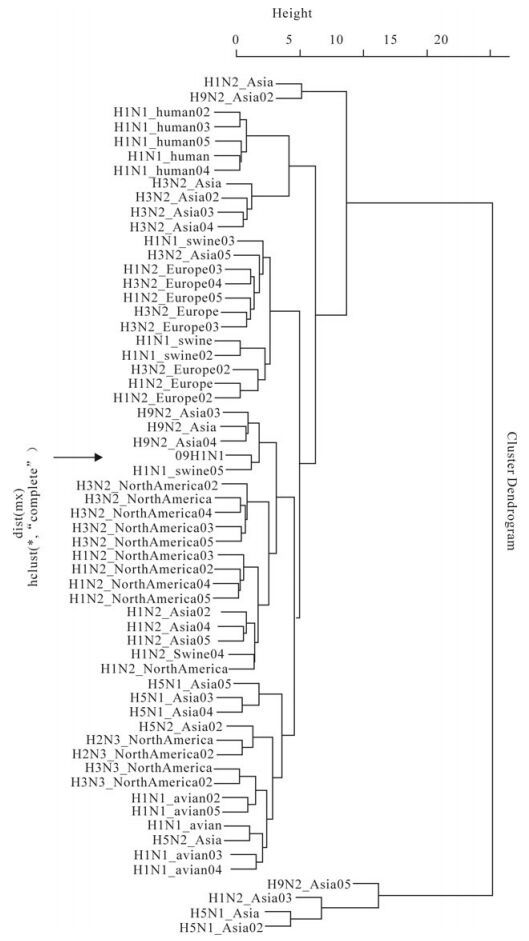
Figure 3. Cluster map for 60 strains based on the overall RSCU of their genome. The cluster was implemented based on the codons' RSCU of each genome; meanwhile, the sources of virus were listed in Table 1.
Synonymous codon usage of 09H1N1
The causes of codon usage bias of 09H1N1
-
In this study, we investigated the codon usage bias of 09H1N1. Through codon usage analysis, we found that the most preferentially used codons of 09H1N1 are A-ended and U-ended codons and the codon usage bias of 09H1N1 is quite low. After long term coexisting with a host, the codon usage patterns of the virus may adapt to its host. It is believed that the codon usage patterns of host may become an obstacle to block the virus to transmit to another species with codon usage patterns quite different from its natural host. The low codon usage bias suggests a more uniformed synonymous codon selection of 09H1N1, which may endow 09H1N1 the advantage to transmit across the species barriers.
Codon bias is likely a product of various kinds of mutational and selective forces. We try to investigate the various factors shaping the codon bias of 09H1N1, rather, we need to mention that there may exist other factors influencing the codon bias of 09H1N1 that are not detected. Through Nc-plot and the computation of correlation coefficient between the position of genes along the first two axis of WCA and indices related to base composition, we found that base composition constrains is a key factor driving the codon usage bias of 09H1N1, while the low correlation coefficient between GC3s and the position of genes along the first two axes suggested that GC3s mutational bias is small and uneven in shaping the codon usage bias of 09H1N1, which is consistent with the Nc-plot and correlation extent between GC12s and GC3s. As it has been proved that mutational bias is the main factor determines the codon usage bias of influenza A virus [23], the uneven and small effect of mutational bias on 09H1N1 may give indirect support for its complex genome origins. Meanwhile, the correlation between Nc and Axis 1 deriving from WCA suggests a close relationship between translational selection and codon usage bias. Other factors, such as gene length, hydrophobicity of proteins and aromaticity of amino acid have no significant correlation with the codon usage bias of 09H1N1. As there doesn't exist a clear boundary between structural proteins and nonstructural proteins in Fig 1, it is likely that gene function is entangled with other factors, it's hard to ascertain the exact correlation between bias and gene's function.
The correlation relationships between the 16 dinucleotide frequencies and the first three axes derived from WCA suggests that dinucleotide biases, which are independent of the overall base composition, can also affect the codon usage bias of 09H1N1. The relationship between dinucleotide frequencies and codon usage bias is evident in some cases. For example, the AA dinucleotide has the highest mean frequency in table 5, there are six codons including AA, related to coding four amines, i.e. Gln, Asn, Lys and Glu, the most preferentially used codons of all these four aminos are all AA-including codons. The situation is similar to GA, which has the second highest mean frequency. In contrast to AA and GA, CG has the lowest mean frequence, of the eight codons containing CG, which relate to encode 5 amino, only have a mean RSCU value of 0.38, meanwhile, the least preferentially used codons of these five amino all contain CG. The significant CG deficiency is a common phenomenon in small eukaryotic viruses. Thus, it could be a strategy for viruses to resist host defense as CpGs may be recognized by the host's innate immune system as pathogen signature [19].
Other than the analysis mentioned above, the cluster map among genomes of 60 different strains was also plotted. 09H1N1 and swine05 (A/swine/ Kansas/77778/2007(H1N1)) are closely clustered in the cluster map among genomes, which suggests that they have similar codon usage bias. Early evolutional original analysis of 09H1N1 had revealed that six of eight segments have high similarity with the swine H1N2 influenza A viruses isolated in North America and Asia [20, 21]. Together with the fact that H1N2 is descendant of the triple-reassortant swine H3N2 isolated in North America[21], it is under-standable that H1N2 from North America and Asia, H3N2 from North America are clustered in the same big branch as 09H1N1. It is worth noting that H9N2 from Asia are also in the same big branch as 09H1N1, which was ignored in the original analysis [20, 21]. As codon usage bias may be related to gene' function, expression level and protein structure, and cluster analysis based on codon usage bias may provide additional information when compared with sequence analysis. Further experiments or data are needed to verify whether there exist a biological relationship between 09H1N1 and H9N2 from Asia.
Our results will provide a complement to phy-logenetic studies of 09H1N1. Furthermore, a better knowledge of codon usage biases in RNA viruses will provide necessary information, which is useful to understand the processes governing their evolution, such as mutation pressure. At last, such information can provide relevant clues to grasp the regulation of viral gene expression and evolutionary origin of different genes of 09H1N1.

 DownLoad: