


-
Porcine circovirus (PCV) is a small, non-enveloped, spherical single-stranded DNA virus. Two distinct genotypes of PCV, designated PCV1 and PCV2 have been identified. PCV1 does not usually cause disease, while PCV2 can cause postweaning multisystemic wasting syndrome (PMWS) and other diseases in swine [1, 9, 19]. PMWS usually occurs together with porcine reproductive and respiratory syndrome[3, 18], caused by respiratory syndrome virus (PRRSV). For virus detection, three methods are commonly used: virus isolation, serological testing and detection of genomic sequences by nucleic acid amplification[22, 23]. PCV2 does not produce a cytopathic effect during isolation and in vitro culture, and therefore can not easily be identified by cell culture technology alone[2]. Currently, an enzyme-linked immunosorbent assay (ELISA) and a polymerase chain reaction (PCR) are the two major detection approaches for PCV2 [12, 20]. The ELISA has lower sensitivity than the PCR, but PCR usually has relatively high requirements in terms of equipment, running costs and trained technicians, and PCR products need to be analyzed by agarose gel electrophoresis.
Since the development of loop-mediated isothermal amplification (LAMP) in 2000[11] the technique has been extensively applied in the identification of veterinary microorganisms because of its simplicity (one-step reaction), sensitivity and real-time detection[21]. LAMP reactions are performed under isothermal conditions and do not require precise laboratory facilities, thereby dramatically reducing the cost of detection. In addition, the efficient amplifi-cation resulting from this method enables the simple visual observation of products via colorimetric methods or UV illumination [14, 15].
To date, several researchers have reported the rapid detection of PCV2 using LAMP assays [4]. However, most established LAMP assays are validated by agarose gel electrophoresis, which can only be applied to identify the final results of the amplification. Thus, the judgment of the results can be imprecise. Identification of amplified LAMP products can be observed visually due to turbidity caused by magnesium pyrophosphate[10], a byproduct of the amplification reaction. Using a Loopamp turbidimeter (LA-320), the amplification reaction can be monitored in real time and viewed via the use of special computer software. Additionally, false-positive and non-specific reactions can be excluded by setting a standard reaction. Here, we report for the first time, the use of a Loopamp real-time turbidimeter (LA-320) to monitor the amplification reaction and develop an effective system for the detection of PCV-2.
HTML
-
Viral Strains and clinical samples
The HUN-09 (GenBank accession number: GQ449670), HUB-09 (GenBank: GQ449671) and SD-09 (GenBank: GQ449669) strains of PCV2 and the HRB-09 (GenBank: GQ449672) strain of PCV1 were isolated and identified in our laboratory[8]. Porcine parvovirus (PPV), PRRSV and Pseudorabies virus (PRV) were provided by the National Classical Swine Fever Reference Laboratory. Eighteen clinical samples were collected from tissue samples and sera from diseased pigs in Henan Province, China.
DNA and RNA extraction
Extraction of nucleic acid of PCV2, PCV1, PRV, PPV and PRRSV from the tissue samples of the diseased pig were performed using the E.Z.N.A. Viral Kit (Omega-Bio-tek, USA), in accordance with the manufacturer's instructions. The nucleic acid concentration was then determined using a UV-visible spectrophotometer.
Design of the PCV2 LAMP primers
Using the sequences of the six PCV2 strains published by GenBank as a template, multiple primers (using the website: http://primerexploer.jp) were designed and screened by comparing the results of different primer combinations using a LAMP turbidimeter. The optimal primer set was identified by screening the designed primers using the DNA LAMP Kit, according to the manufacturer's instructions. The primers used for the PCV2 LAMP assay are listed in Table 1.

Table 1. Primers used for the PCV2 LAMP assay
PCV2 LAMP assay and products Identification
This assay used the optimized primers to explore the levels and proportions of different components for the PCV2 LAMP assay using the DNA LAMP Kit, and then optimized the other components of the reaction mix. A 20-μL reaction system was chosen for the PCV LAMP assay containing: 12.5 μL of reaction buffer mix (RM), 1 μL of reaction primer mix (PM), 1 μL of reaction enzyme mix (EM) (8 U/μL Bst DNA polymerase, large fragment) and 5.5 μL of template DNA. The concentration of the primers in the PM were as follows: F3, 5 pmol/μL; B3, 5 pmol/μL; FIP, 40 pmol/μL and BIP, 40 pmol/μL. a reaction tube containing PCV2 LAMP reaction solution alone was used as the negative control.
Considering the criteria proposed for Norovirus by the manufacturer, we defined the cutoff values for positive samples as the values at which the peak curve of the reaction rate increased above 0.1. The results were monitored using the software provided along with the Loopamp real-time turbidimeter to determine the optimal reaction system. The reaction rate and time points during the reaction process were displayed and recorded both graphically and as text.
At the end of the reaction, 5 μL of SYBR Green Ⅰ nucleic acid gel stain was added to the PCV2 LAMP reaction system and any change in color of the LAMP reaction solution was observed via the naked eye. A green color indicated a positive reaction and orange indicated a negative reaction.
Specificity and Sensitivity test of the PCV2 LAMP assay
The genomic nucleic acids of the PCV2 isolate, PCV1, PRV, PPV and PRRSV, were extracted using the E.Z.N.A. Viral Kit. To assess the specificity of the LAMP assay for PCV2, DNA of PCV2, PCV1 and PRV, and cDNA of PRRSV were extracted and used as templates for the PCV2 LAMP assay. The reaction was analyzed with the Lamp real-time turbidimeter, incubated at 63.5℃ for 60 min. On completion of the reaction, the amplified products were stained with SYBR Green Ⅰ.
The extracted PCV2 template was diluted 10-fold into eight concentrations ranging from 1.0×100– 1.0×10⁻⁷ per reaction. Sensitivity tests were performed according to the established LAMP assay method.
Evaluation of LAMP assay with clinical samples
18 suspicious samples were collected from epidemic areas, virus were isolated, DNA was extracted. and templates were detected with LAMP and PCR. PCR amplification of the DNA extracted from the tissue samples was performed using PCV2 primers (FP: 5'-CCTTTGTTACAAAGTTATCAT CT-3'and LP: 5'-CGTATCCAAGGAGGCGTTA-3'). The 50-μL PCR reaction system included 5 μL of 5× buffer, 10 mmol/L of dNTPs, 1 U of Taq DNA polymerase, 25 μmol/L of each primer, 3 μL of total DNA and 38 μL of demineralized water. The reaction conditions were as follows: one cycle of 94℃ for 4 min; then 30 cycles of 94℃ for 45 s, 49℃ for 45 s and 72℃ for 45 s; followed by one cycle of 72℃ for 10 min. The PCR products were analyzed by 1% agarose gel electrophoresis and then observed and photographed under UV. A 402 bp fragment was expected.
-
Results of the PCV2 LAMP assay
The LAMP assay was performed on the DNA extracted from the PCV2 isolates using the LAMP turbidimeter. Software-based monitoring also showed that when the temperature of the LAMP turbidimeter reached 63℃, the result could be interpreted as positive when the peak value of the reaction rate curve of the positive control reaction system exceeded 0.1 within 30 min.
At the end of the PCV2 LAMP reaction, SYBR Green Ⅰ nucleic acid gel stain was added. Observation by the naked eye detected green fluorescence in the positive sample tube, and orange fluorescence in the negative tube. The results were consistent with those detected by the LAMP turbidimeter, suggesting that the observed color change, after the addition of SYBR Green Ⅰ nucleic acid gel stain, was specific.
Specificity test
We validated the specificity of the LAMP method by detecting the viral DNA template, as described in method. PCV2 showed a positive reaction, while the other experimental samples showed negative reactions (Fig. 1). These results suggested that the method was specific for PCV2.
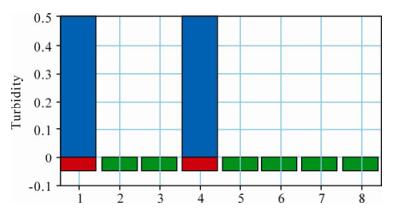
Figure 1. Specificity of the PCV2 LAMP assay as verified using the LAMP turbidimeter and SYBR Green Ⅰ staining. The red color represents positive results, the green color represents negative results, and the blue color represents the turbidity of the PCV2 LAMP products. 1, PCV2 SD-09 isolate; 2, PCV1; 3, Negative control; 4, PCV2 HUN-09 isolate; 5, PRV; 6, PPV; 7, PRRSV; 8, Water control
Sensitivity test
The concentrations of the extracted DNA templates from isolates SD-09 and HUN-09 were 8 ng/μL and 10 ng/μL, respectively. Using the established PCV2 LAMP method, we amplified the DNA template (10 ng/μL) extracted from the SD-09 PCV2 isolate, and diluted it using a 10-fold dilution series from 1–10–7. Fig. 2 shows the various concentrations of DNA template of the SD-09 PCV2 isolate analyzed with the LAMP turbidimeter. When the concentration of the template decreased, the slope of the positive reaction rate remained unchanged and the time required for the reaction increased. A rapid and effective amplification of 55 ng PCV2 nucleic acid could still be observed when the dilution reached 10–6 (Fig. 2). During the reaction, the interval from the time point at which the amount of reaction products reached the detection limit to the time point at which the product was judged as positive was only 2-5 min, indicating that the PCV2 LAMP assay was highly efficient at amplifying the PCV2 template.
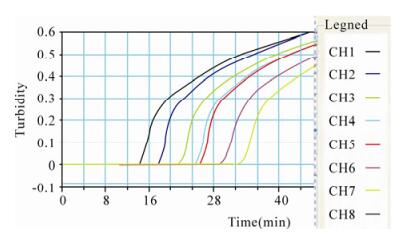
Figure 2. Validation of the PCV2 LAMP assay by analyzing serial dilutions of the DNA template with the LAMP turbidimeter. CH1: 1, CH2: 10–1, CH3: 10–2, CH4: 10–3, CH5: 10–4, CH6: 10–5, CH7: 10–6, CH8: 10–7 dilution
Application and Evaluation of the PCV2 LAMP assay for the clinical samples
The LAMP assay was applied to the analysis of clinical samples and the results obtained from the LAMP turbidimeter are shown in Fig. 3, in which lane 1 is the positive control and lane 2 is the negative control. Positive results were obtained with isolates H1, SD1, HB2, SX21 and SX23 and a negative result was obtained with the other 13 samples (including isolate TJ5).
Figure 3. Analysis of the clinical samples by the PCV2 LAMP assay using the LAMP turbidimeter. 1, Positive control; 2, Negative control; 3, Isolate H1; 4, SD1; 5, TJ5; 6, HB2; 7, SX21; 8, SX23
The clinical samples were also analyzed by PCR after cell culture and the results are shown in Fig. 4. Table 2 summarizes the results of the LAMP assay, PCR and virus isolation for the PCV2 positive and negative controls, and the clinical samples. Of the 18 clinical samples, five were found to be positive by the LAMP assay, and four were found to be positive by PCR and virus isolation (Table 2). Again, the five positive samples detected by the LAMP method included all of the samples found to be positive by the other methods (i.e., virus isolation and PCR).indicating that we had developed a rapid and sensitive LAMP assay for PCV2 detection.
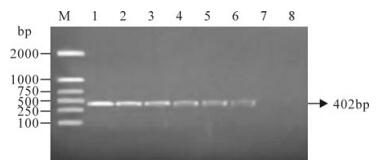
Figure 4. PCR amplification of the clinical samples. Lane 1: DNA marker (DL 2000); Lane 2, Positive control; Lanes 3-7, Detected samples; Lane 8, Negative control

Table 2. Results of Comparison detection
-
Effective pathogen detection is a crucial initial step in the prevention and control of PCV2. During the past decade, various nucleic acid amplification techniques, such as PCR, ELISA, have been developed to address the need for the rapid identification of PCV2 at the serotype level with more accuracy. Even though the magnitude of amplification can be obtained, these PCR-based methods have limitations. For example, PCR usually has a relatively high resource requirement, i.e., its results need to be further determined by agarose gel electrophoresis.
In this regard, as a novel technique of nucleic acid amplification, LAMP is advantageous due to low cost and low resource requirements, and possesses high sensitivity and specificity compared with other molecular biological methods [13, 16, 17]. For these reasons, LAMP assays have been extensively applied in the identification of veterinary microorganisms [4~7] in China. However, there have been no reports on the establishment of a PCV2 detection system using a LAMP real-time turbidimeter.
In China, this is the first report on the application of the RT-LAMP assay technique using a LAMP real-time turbidimeter to analyze all aspects of the PCV2 LAMP reaction system. As a result, we determined the time interval from the initiation phase to the plateau phase of the reaction with positive templates of different concentrations, and selected the optimal reaction conditions, including the PCV2 LAMP primers with the highest efficiency and specificity. PCV2 nucleic acids can be easily identified using this system within 30 min, which is faster than PCR. The detection limit is only 5.5×10⁻⁵ng of PCV2 nucleic acid, indicating that the system is also highly sensitive. These two features enable the system to detect PCV2 early and quickly.
The PCV2 LAMP method used in this study had a reaction time of only 30 min per reaction, which is faster than conventional PCR or serological assays. The existence of a small number of target templates enables effective amplification within a short time period for the LAMP assay. Compared with conventional PCR methods, LAMP does not require expensive temperature-controlled equipment and can instead be performed in a normal thermostatic water bath. During the interpretation of the reaction results, a specific fluorescence developer (SYBR Green Ⅰ) can be added which enables direct observation of the results with the naked eye. This negates the need for agarose gel electrophoresis apparatus or optical imaging equipment.
There is no cross-reaction between PCV2 and other related viruses, such as PRRSV, PCV1, PRV and PPV, which suggested that the method is highly specific among the viral strains tested. In addition, LAMP is a simple, time-saving procedure, allowing the results to be obtained within 1 h, dramatically quicker than conventional PCR. Of the 18 samples detected by the PCV2 LAMP method in this study, positive results were obtained for five samples. These five positive samples included all of the samples found to be positive by ELISA and PCR, indicating the potential applicability of this method.
In conclusion, a PCV2 LAMP assay was developed successfully and shown to be a simple, highly sensitive, rapid and reliable method for the clinical diagnosis of PCV2 infection.
Acknowledgments
This work was supported in part by grants from the National Support Project (2007BAD86B04-4) (China). we would also like to thank to Eiken Co. for technical support.

 DownLoad: