


-
It is well known that insect cell lines have been used for the study of insect and plant viruses [6, 8]. In particular, with the advent of the baculovirus-insect cell system, a new exciting application for insect cells in biotechnology was realized to provide adequate levels of recombinant proteins or maximum production of viruses. The optimum growth temperatures for different cells are an important factor [3, 8, 15]. Usually the optimal growth temperature of insect cell lines ranges from 25℃ to 33℃ with an optimum at 28℃[7]. A temperature shift to 45℃ leads to the death of Drosophila cells, except when cells have been pretreated to an intermediate temperature for a short time, i.e, 1h at 37℃[7, 16]. Survival at a stress temperature has been correlated with the synthesis of heat shock proteins (hsp) first described in Drosophila [4, 17], and further documented in many prokaryotic and eukaryotic cells subjected to a transient rise in temperature [1, 2, 13]. Lepidopteran heat-tolerant (ht) cell lines have been obtained with sf-9, sf-21 and several Bombyx cells[5, 11]. They have a distinct karyotype, membrane lipid composition, morphology, and growth kinetics from the parental cell lines. Also Lynn reported that virus appeared to have the highest titer in some cells when at 22℃ but the time required to reach the maximum titer was slower at this temperature[14].
In this paper, we describe the development of ht cell lines, BTI-TN-5B1-4 (High5) and BTI-TN-MG1 (MG1), from other insect species Trichoplusia ni [9]. Adaptation of cell lines High5 and MG1 to 33℃ and 35℃ was carried out by shifting the culture temperature between 28℃ and higher temperatures by a gradual stepwise increase in temperature. The cell-lines with the temperature adaptation were designated as sf9-ht33, sf9-ht35, High5-ht33, High5-ht35, MG1-ht33, and MG1-ht35. Then we examined their charac-teristics in different temperatures.
HTML
-
Cells and virus
Sf-9 (passage 21), High5 (passage 95), and MG1 (passage 72) cell lines were obtained from Dr. Granados. AcMNPV-1A (wild-type virus) budded virus (passage 5) was obtained from Dr. Ping Wang. The cell cultures were maintained in TNM-FH medium (Grace`s medium plus 10% serum, GIBCO, New York, USA).
Procedures of adaptation to a higher culture temperature
All of the cell lines, sf-9, High5, and MG1 were adapted to 33℃ and 35℃ by shifting the culture temperature between 28℃ and higher temperatures by a gradual stepwise increase in temperature. All cultures were initiated at a cell density of 2×10⁵ cells/mL in a flask with 5 mL of the cell suspension to incubate at 28℃ for 2 d. then the culture flasks were transferred to 30℃ incubation for 2-3 days. Following this the flask was gently shaken, 4.5 mL of the old medium with the suspended cells was discarded then 4.5 mL of fresh medium was replaced. The flask was then returned to 28℃ again. The procedure was repeated until the cells were considered to be fully adapted to 30℃. Following the method above, the adapted cells to 33℃ and 35℃ were also obtained. The process of adaption to a higher culture temperature was accomplished over a period of two months. The cell lines with temperature adaption were designated as sf9-ht33, sf9-ht35, High5-ht33, High5-ht35, MG1-ht33, MG1-ht35.
Cell morphological observation
The morphology of heat adapted cells at 3 days after incubation at their adapted temperatures was observed, and microscopic images of the cell lines were obtained by using an Olympus IX71 inverted phase–contrast microscope with a digital camera at around subculture passage 70. Cell size was measured according to a calibrated manufacturing factor [19]. Average cell dimensions were determined from measurement of 50 cells.
Cell growth curves
Triplicate 25 cm2 flasks of sf-9, sf9-ht33, sf9-ht35, High5, High5-ht33, High5-ht35, MG1, MG1-ht33, and MG1-ht35 cell lines were respectively prepared at a density of 1.0×10⁶cells/flask and allowed to grow at their adapted temperatures, 28℃, 33℃, and 35℃, respectively. At 24h-intervals the cell densities from replicate flasks were determined by using a hemacytometer. Then cell population doubling times were calculated using the exponential formula described by Hayflick (1973).
Changes of cell density in serial passages
Multiple 25 cm2 flasks containing 5mL of 2.0×10⁵cells/mL were prepared from sf-9, High5, MG1, and their ht cell lines and incubated at 28℃, 33℃, and 35℃ for 3 days, respectively. The cell density was measured prior to subculture. This process of serial passage was carried out from 1st to 9th passages.
Virus infection and viral production
Sf-9, High5, MG1, and their ht cell lines were seeded in triplicate into 24-well plates (Corning, NY, USA) at a density of 2.0×10⁵cells/well and allowed to attach for 2h at 28℃. Following gentle removal of the spent medium, 0.5 mL AcMNPV-1A budded virus (BV) (multiplicity of infection [MOI] = 10) was added into each well to absorb for 1 h on a shaker. After gently removing the inoculum and washing with fresh medium, 2 mL of fresh medium was replaced, and then the plates were incubated at their adapted temperatures, 28℃, 33℃ and 35℃, respectively. The cultures were collected to determine the ratio of infection and virus production at 3 days postinfection (p. i.). For examination of occlusion body (OB) production, the infected cells were disrupted by sonication to release virus OB. The density of OB was examined by a hemocytometer[12, 18]. For the BV productions, the collected supernatants with BV from each culture were titered by the end-point dilution method described by Lynn [14]. Briefly, 96-well culture plates, containing 2.5×10⁴ cells/well in 0.2 mL TNM-FH medium, were inoculated with 0.1 mL of a 10 fold dilution of virus onto each 12 wells of the respective cell lines. The plates were sealed in airtight plastic boxes with moistened towels to maintain humidity and placed in incubators at 28℃, 33℃, and 35℃. TCID50/mL was determined by using an Olympus IX71 inverted phase-contrast microscope for the presence or absence of OB.
-
Cell morphology
Cell lines sf-9, High5, MG1, and their heat adapted to 33℃ (ht33) and 35℃ (ht35) counterparts were observed by microscope. Each image of the cultures was captured at 3 days after incubation at their adapted temperatures (Fig. 1). All of cell lines grew as anchorage dependent cells in a T-flask. The morphology of the cells, grown in TNM-FH medium, did not obviously change, however the cell size of sf9-ht cells was enlarged and those of High5 and MG1 cells were reduced after heat adaptation (Table. 1).

Figure 1. Microscopic observation of cell lines sf9, High5, MG1 (parental) and their sub-cell lines heat adapted to 33℃ (ht33) and 35℃ (ht35). Image of the culture was captured at 3 days after incubation at their adapted temperatures. An internal scale bar represents 50 μm

Table 1. Characteristics of heat tolerant cell lines derived from Sf9, High5 and MG1
Growth of cell lines
Growth curves of cultured cells of sf-9, High5, MG1, and their heat adapted cells were determined at their adapted temperatures (Fig. 2). All heat adapted cell lines were faster-growing than that those of parental cell lines. The population doubling times of sf9-ht35, High5-ht35 and MG1-ht35 cells were 4, 3 and 1 h less than those of their parental cell lines, respectively (Table. 1), and the times that cells reached a maximal density were shortened with the rise of culture temperature (Fig. 2).
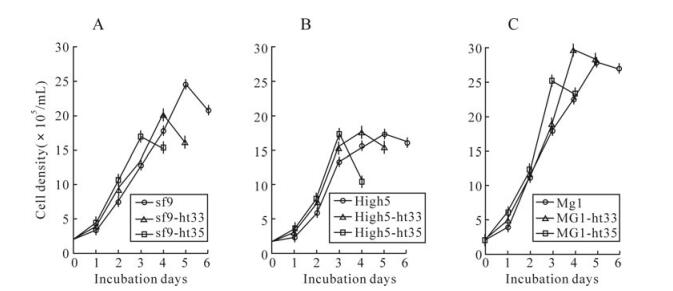
Figure 2. Growth curves of cultured cells of sf9, sf9-ht33, sf9-ht35(A), High5, High5-ht33, High5-ht35(B), MG1, MG1-ht33, MG1-ht35 (C) at their adapted temperatures, 28℃, 33℃ and 35℃, respectively. Point of ○, □ or △ and length of the vertical line represents a mean and standard deviation of the measured cell densities
Viral susceptibility and production
The susceptibility of both parental cells (sf-9, High5, and MG1) and their ht cells (sf9-ht33, sf9-ht35, High5-ht33, High5-ht35, MG1-ht33, MG1-ht35) to wild type AcMNPV at their adapted temperatures was approximately similar with a infection of over 95% of the cells 3 days P. i. (Fig. 3).
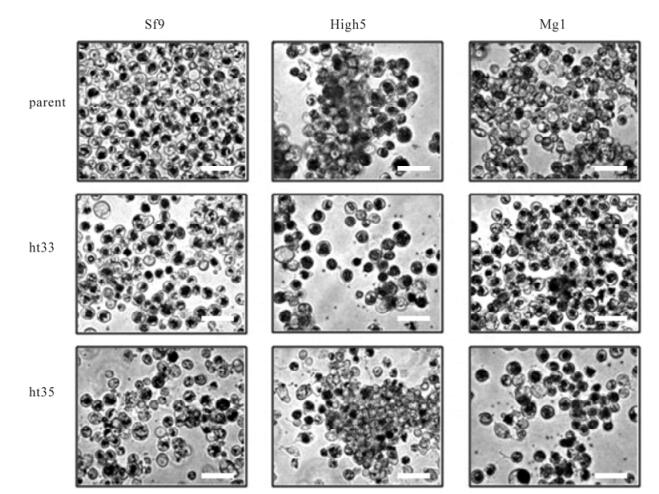
Figure 3. Microscopic observation of cell lines sf9, High5, MG1 (parental) and their ht cell lines infected with AcMNPV at their adapted temperatures. Image of the infected culture was captured at 4 days post-infection. interval scale bar represents 50 μm
The production of budded virus (BV) and occlusion body (OB) by these cell lines at different temperatures was measured 3 days P. i. and was optimum at its own adapted temperature (Fig. 4). When at 28℃ culture, the parental cells, sf-9, High5, and MG1, showed the highest level of BV production (average of 7.8×10⁷, 5.7×10⁷ and 5.2×10⁷ TCID50/mL, respectively) in comparison to the lower level produced in ht-33 (average of 3.0×10⁷, 5.0×10⁷ and 4.4×10⁷ TCID50/mL, respectively) and ht-35 cells (average of 2.5×10⁷, 2.2×10⁷ and 7.0×10⁶ TCID50/mL, respectively) (Fig. 4). When at 33℃ culture, the production of BV by the ht-33 cells, sf9-ht33, High5-ht33, and MG1-ht33, was the highest (average of 3.5×10⁷, 3.7×10⁷ and 4.6×10⁷ TCID50/mL, respectively) as compared to parental cells and ht-35 cells. When at 35℃ culture, all of the ht-35 cells produced over sevenfold more BV than parental cells and ht-33 cells. The production of occlusion body by these cells showed a similar trend to the results with BV production.
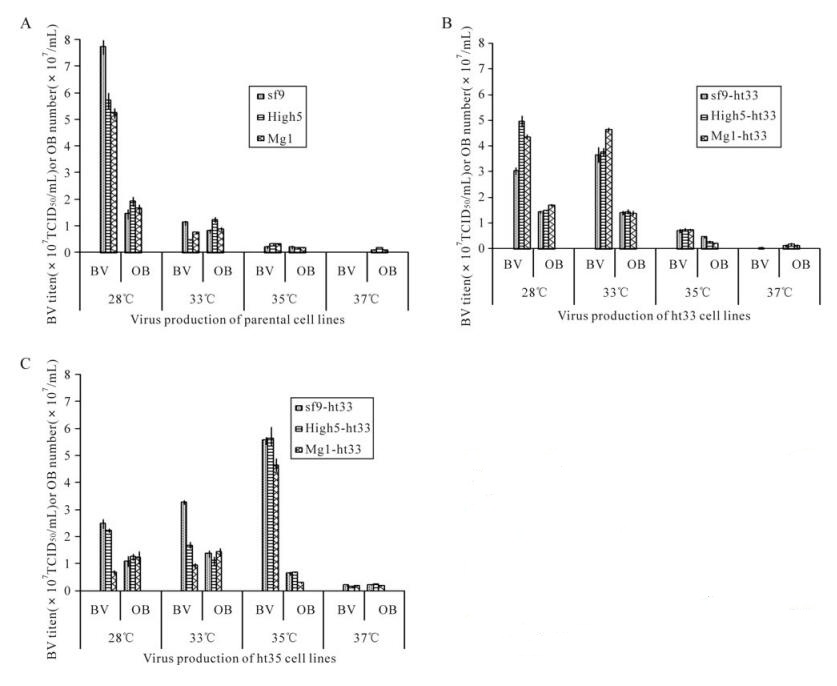
Figure 4. AcMNPV production of sf9, High5, MG1(A), sf9-h33, High5-ht33, MG1-ht33(B), sf9-ht35, High5-ht35, MG1-ht35 (C) at 28℃, 33℃, 35℃ and 37℃. At 4 days after infection, culture medium and cells containing AcMNPV BV and OB were collected and measured for their virus production. Length of bars and lines on top of their represent means standard deviation of the production, respectively
Changes of cell density in cultures of their adapted temperatures
The serial passage of parental cells and their ht cells during subculture at 28℃, 33℃ and 35℃ demonstrated that each cell line had an constant density at its own adapted temperature through the ninth passage (Fig. 5).
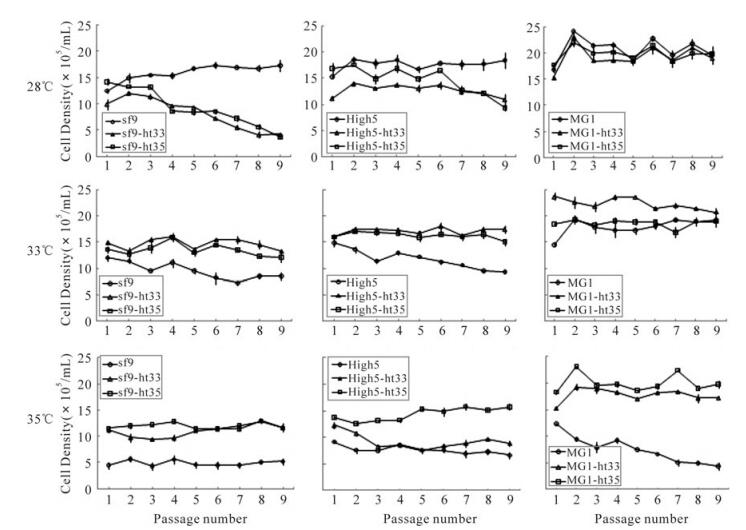
Figure 5. Change of cell density in cultures of sf9, High5, MG1 (parental) and their ht cell lines during subcultures at 28℃, 33℃ and 35℃. Point of ○, □ and △ represent a mean of the measured cell densities
At 28℃ culture, the parental cells (sf-9 and High5) were able to keep an almost constant density between 1.5×10⁶and 2.0×10⁶cells/mL, but the sf9-ht33 and High5-ht35 had not adapted to the lower temperature, so the cell density in cultures of both sf9-ht and High5-ht cells went rapidly down after 3ird passage. However, all of MG1 cells including ht-33 and ht-35 could suit this low temperature with higher cell density (between 1.6×10⁶ and 1.8×10⁶ cells/mL) in comparison to sf-9 and High5 cells. At 33℃ culture, the parental cell lines of sf-9 and High5 could not adapt to the higher temperature and the cell density gradually decreased with the increase of subculture passage. But other ht cells including MG1 parental cells could always keep higher cell density. At 35℃ culture, all of the ht35 cells including sf9-ht35, High5-ht35, and MG1-ht35 were able to still maintain the highest level of cell density in comparison to other cells investigated in this study.
-
In this study, we carried out the adaption of cell lines by shifting the culture temperature between 28℃and 35℃. In the first stage, the cells were transferred from 28℃ to 30℃ for 3-5 days culture with the result in that some cells died because of the high temperature. The surviving cells were returned to 28℃ culture again for recovery, and then they were transferred to 30℃ culture again. The procedure was repeated several times, until the cells were able to grow normally at 30℃; these were designated ht30 cells. With the same method, we obtained ht33 and ht35 cells. Although there were several reports on heat-temperature adapted cell lines [5, 11, 14], we have not successfully obtained any ht37 cells from sf-9, High5 and MG1 cells. But MG1-ht35 cells will be a potential resource because the cells appeared very high resistance to high temperature. Also we suggest that subculture interval of the heat tolerant cells should be shortened for one day. When cells were cultured at 28℃, the subculture intervals were four days, but when the heat tolerant cells were subcultured at 33℃ or 35℃, the intervals between subcultures were three days, because the cells began to die after four days.
These results in this study confirmed the intuition that these cell lines will provide good materials for plaque assay, or for comparing difference between culture cells in vitro and larval tissue in vivo. Also, the results will provide useful resources for virus and recombinant protein production.
Acknowledgments
The authors gratefully acknowledge support from the Chinese National Basic Research Program (973) 2009CB118900, and Chinese National Science Foundation Project 30771451, and Boyce Thompson Institute for Plant Research Project BTI-QAU 1-23-2007. We also thank Changyou Li for making charts.

 DownLoad: