


HTML
-
It is well established that different sites within a protein evolve at different rates according to their role within the protein [7, 8]; sites that are involved in forming important components of the protein structure or are involved in key functions are generally highly conserved, in contrast to other sites where mutations can be accommodated without loss of function. These sites are assumed to be less critical. A third possibility is that a site mutation may occur if there is a compensating mutation at a second site. Identification of these correlated mutations can aid in tasks such as ab initio protein structure [9, 19], structure function analysis[1, 14] or sequence alignment [4].
Entropy is a common measure of the variation in an alignment. The entropy H(i) at a particular site i is defined in terms of the uncertainty of determining the amino acid or nucleotide at that site; a site which is highly variable will have a high entropy value, whereas a site that is co mpletely conserved will have an entropy of 0. In the same way, the entropy between two sites i & j can be defined as a measure of the certainty of predicting the sequence at site j, given the sequence at site i. These two metrics are combined to define the Mutual Information (MI) which is an explicit measure of the dependency between two sites.
There have been many reported studies that have used variations on MI to identify coevolving site pairs [2, 3, 18, 30]. However, several other approaches have also been developed for predicting coevolving site pairs. These include 1) identification of site pairs with frequencies that deviate from the expected distribution [16, 21], 2) site substitution/correlation analysis [10, 26] and 3) statistical coupling analysis which calculates the degree to which the amino acid frequencies at one site are affected by a change in the frequency distribution at a second site[23, 27].
One limitation of all of these methods is that the detected signal is a combination of several com-ponents. These arise not only from structural and functional constraints, but also from background noise generated by stochastic events (for example, pairs of sites with high entropy values will have a strong MI signal) and phylogenetic effects (sets of closely related sequences can share two point mutations from a common ancestor which will be over represented in the analysis). Studies suggest that a minimum of 130 sequences are needed to distinguish true signal from background noise[24].
Current estimates indicate that globally, there are more than 33 million currently infected with AIDS[28]. Consequently, HIV is one of the most widely studied viruses with more than 350 000 nucleotide sequences submitted to the NCBI GenBank database as of Dec 2010. Within the genome, the gp120 protein is required for virus entry and plays a key role in the HIV life cycle by mediating binding to CD4 cell surface receptor on target cells [29] and is therefore one of the most frequently sequenced regions of the genome. Additionally, the structure of the protein has been solved in the both bound and unbound states [15, 22, 31, 32]. Thus, the gp120 protein seemed a good choice for a pilot study to investigate whether Mutual Information could be used to study an entire protein in order to identify coevolving sites.
In this study we first generated specific alignments for major subtypes or circulating recombinant forms and estimated the coevolution probability for all possible site pairs using mutual information as the metric. To determine the statistical significance of any site pair we bootstrapped the alignment and compared the Mutual Information between the random and real data sets. We then mapped the most probable coevolving sites on to the solved gp120 structure to interpret the significance of the predicted pair.
Our results suggest that, in the case of a virus such as a HIV with a high mutation rate, a larger sequence set is not necessarily beneficial as it becomes more difficult to achieve a reliable alignment in the highly variable regions of the sequences. Thus it seems that mutual information should still be combined with additional analysis techniques to achieve the best results. Nevertheless, using the larger dataset we were able to able to verify our approach and identify a number of sites that had been identified in previous experimental studies as well as locate sites close to the C terminus of the gp120 protein that only appeared to be coevolving in the C subtype.
-
All full length drug na ve sequences which spanned the entire gp120 gene sequence were downloaded from the LANL HIV database as of 1/3/2009 for subtypes B & C and circulating recombinant form CRF07. A total of 1163, 1180 and 304 sequences were downloaded for these three sets respectively. Only 6 drug na ve samples were available for CRF08.
The sequences were aligned using T-COFFEE [25] and visually inspected and adjusted using SeaView [11] and BioEdit (http://www.mbio.ncsu.edu/bioedit/bioedit.html). Any sites containing more than 50% gaps were removed from the alignment as they introduced too much noise into the analysis. Sequences were initially aligned using nucleotide sequences and the final alignment was translated to protein sequence. In order to directly compare the results between sequence sets the sequences were realigned using sequence HXB2 as a reference.[17]
-
Mutual information was calculated according to
Where H(i) and H(j) are the entropy of sites i and j respectively
and H(i, j) is the mutual entropy between sites i and j, (i ≠ j)
To estimate the statistical significance of the estimated MI values, each alignment was bootstrapped by randomly selecting and switching site pairs from two randomly selected sequences (i.e. site i in sequence k was switched with site j in sequence l). Each alignment was subjected to 5, 000 bootstraps and sites that had MI values that were higher than the corresponding values in all 5, 000 bootstrapped alignments were retained as most probable candidates for coevolving sites (i.e. P < 2×10⁻⁴).
-
The statistically significant sites selected in the previous step were then mapped on to the solved structure for the gp120 trimer bound to the cell surface receptor CD4 [22] (PDB entry2NY7). This was done using code from the BioJava software package (www.biojava.org) to load the 3D structure and to thread the consensus sequence to obtain the most probable alignment. Based on this structure, the distance between the most probable site pairs could be estimated.
-
The software used to analyze the alignments and generate the plots was written in java and can run on any platform that supports the java VM. The bootstrap analysis of the B subtype alignment took ~1 week on a standard desktop computer running Debian with a 2.6GHz AMD64 and required~1.6G of memory. Structures were viewed using pymol (www.pymol.org).
Sequence selection and Alignment
Calculation of MI values
Analysis of Significant MI Values
Software
-
The alignment of the gp120 consensus sequence for subtype B and C to the HXB reference sequence is shown in Fig. 1. Key sites in the solved structure are shown in Table 1.
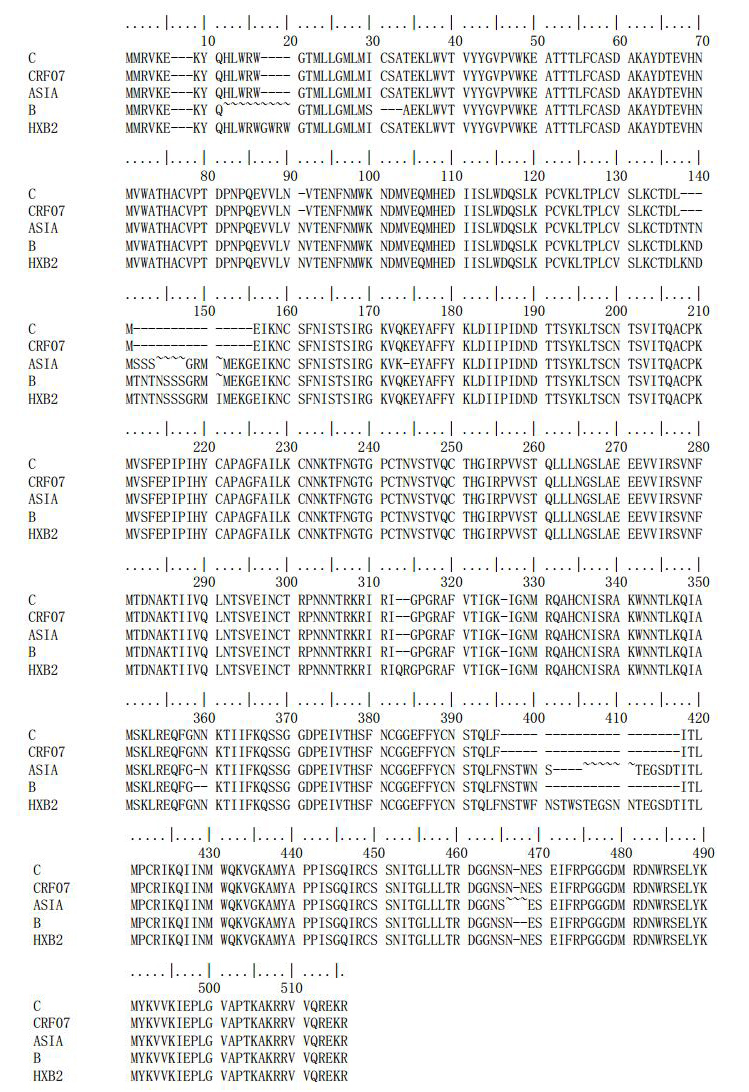
Figure 1. Realignment of gp120 sequences sets for subtype B, subtype C, CRF07 to reference sequence HXB-2. " ~" indicates sites that contain less than three amino acids and cannot be translated.

Table 1. Key structure elements within the gp120 sequences.
The raw MI arrays calculated for the gp120_B and gp120_C alignments are shown in Fig. 2A and 2B respectively. The figures also show the location of the points with respect to the regions of the solved structure and the specific secondary structure features that have been identified within the structure. In both arrays the V1/V2 and V3 loops show the greatest variation. Although there appears to be more variation in the V1/V2 loop, this is because many of the sites within the V3 loop contained large numbers of insertions or deletions and couldn't be included in the analysis. For the raw data, the most notable difference occurs close to the amino terminal of the protein. The C subtype array appears to contain a region of coevolving sites which is absent in the B subtype array.
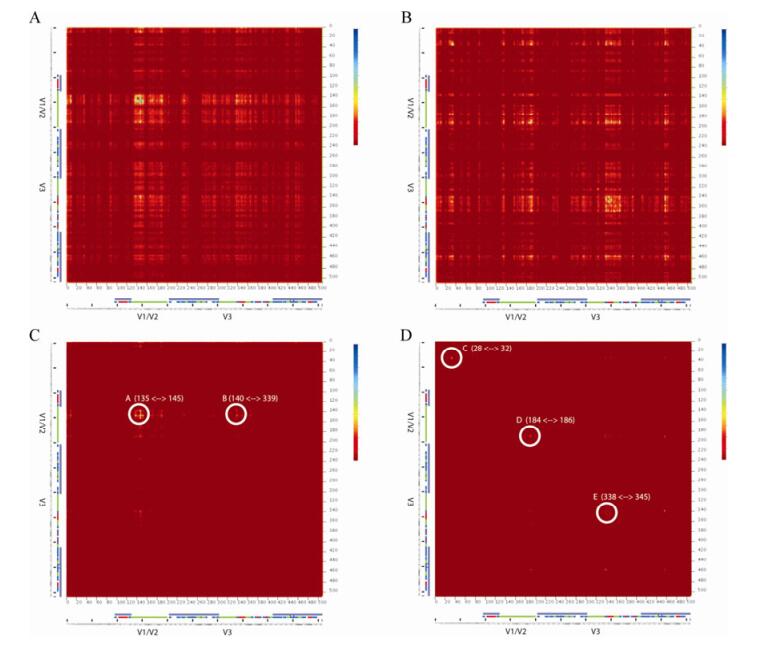
Figure 2. Calculated mutual information arrays for gp120 subtype B and subtype C. (A) and (B) raw mutual information for subtype B and C respectively. (C) and (D), mutual information arrays after removing sites that were not statistically significant at 5000 bootstraps. Circled regions highlight regions that appear to contain sites of interest. Letters correspond to the marked positions on the structure in Fig. 3.
The statistically significant points (P < 0.0002) that remain after bootstrapping are shown in Fig. 2C and 2D. For subtype B, there are two clearly defined regions that remain and which are distinct from the three regions identified in the subtype C array. The figure also shows the range of sites that define hotspots, but it seems likely that some of the signal is due to noise and not all of the sites are coevolving. Region A occurs around aa140 and corresponds to the N terminal of the V1 loop. This is not present in the solved structure, but the loop is thought to be located at the top of the trimer away from where the protein binds to the CD4 receptor (arrow A in Fig. 3). This prediction is supported by a fusogenicity study which found that a mutation at position aa140 had a negative effect on the fusion ability of the virus [6]. A second region is predicted to occur between positions 140 and 339 (A and B on Fig. 3). In this case, the positions are on opposite sides of the protein and even in the trimer are not in close proximity; therefore it seems unlikely that these sites are coevolving and the signal is probably produced by random co-mutations that the bootstrapping failed to remove.
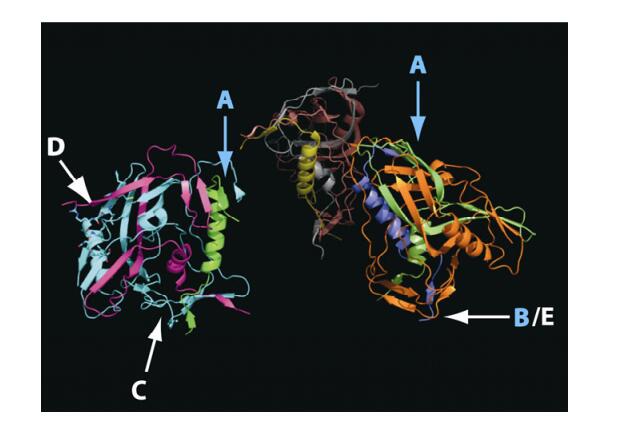
Figure 3. Location of predicted coevolving sites on the Solved structure for the gp120 trimer (PDB structure 2NY7). The base of the trimer binds to the CD4 cell surface receptor. Letters refer to the highlighted regions in Fig. 2. A and D correspond to the N terminus of the V1 and C terminus of the V2 loop respectively, B/E corresponds to the V3 loop in the CPGR region. C corresponds to a region close to the N terminus of the gp120 protein. See text for details
For gp120 subtype C there are three regions that remain after bootstrapping. The first of these occurs at ~aa30 at the N terminus of the protein. Again, this region falls outside the solved structure but it is likely this region is located at the base of the trimer where the structure binds to the CD4 cell surface receptor (Fig. 2). Because the alignments for both subtypes are realigned according to reference sequence HXB2 it is possible to compare this region in the two alignments. Interestingly, between positions aa28 to aa35 in subtype C this region does appear to show greater variation than subtype B. Fig. 4 shows an entropy plot for this region. While the entropy is relatively well conserved across the region, the average entropy between aa28 to aa35 for subtype C is an order of magnitude higher than the value for subtype B. This finding is further supported by visual inspection of the alignment (data not shown).
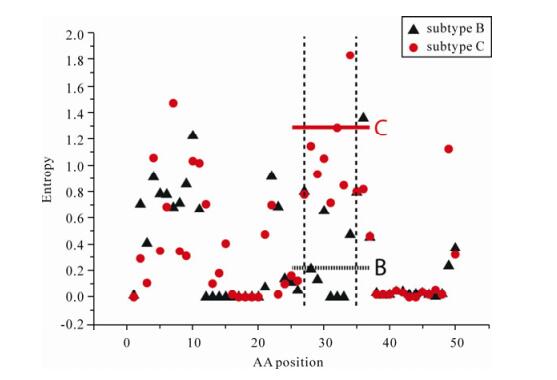
Figure 4. Entropy vs amino acid position in the area around region C in Fig. 2 and Fig. 3 for subtype B and C. Subtype B is shown as black triangle, subtype C is shown as red circles. In this region, the mutual information array predicts a number of coevolving sites for subtype C, but not for subtype B. The entropy plot indicates that the subtype B alignment is highly conserved whereas the subtype C sequences show greater variation. The vertical dashed lines indicate the range of region C marked in Fig. 2D, The horizontal lines show the average entropy across the region for each subtype: subtype B dashed black line; subtype C red solid line. Outside this region the entropy is approximately the same for both subtypes.
Region D corresponds to the C terminal of the V2 protein at ~aa180. Again, because this region is not part of the solved structure it is difficult to inter pret the significance of these sites. However, once again, the prediction is supported by the same fusogenicity study which found that a mutation at aa180 also produced a decrease in the fusion ability of the virus [6]. Region E in Fig. 1D corresponds to the V3 loop, close to the CPGR motif [12, 13, 20]. There are many coevolving sites predicted in this region which is consistent with one of the earliest mutual information studies on HIV which examined the variation in V3 loop within a broad sequence set [18].
-
Identification of coevolving sites can provide insight into protein structure and function and can provide guidance in tasks such as sequence analysis [4] and protein structure and function prediction [1, 9, 14, 19]. Many methods have been developed to identify these sites [10, 16, 21, 23, 26, 27]. Calculation of the mutual information between sites is a relatively simple method but has the advantage of being a more intuitive quantity. The downside of the method is it generates a high level of background signal; our data would probably benefit from additional bootstrapping. The use of mutual information to identify coevolving sites is not particularly novel but our goal here was to investigate whether larger datasets could improve the prediction ability of the method.
We should emphasize that our results are preliminary and should be interpreted with caution. In particular, we attempted to identify coevolving sites in the gp120 B and C subtypes by using a single dataset for each subtype. A better approach might be to first estimate the phylogenetic relationship between the sequences within a particular subtype and then analyze subgroups that are defined according to highly supported sub-clades. This would produce better alignments which would reduce the background signal and help to identify less frequent co-mutations that may nevertheless be significant.
Another improvement worth investigating would be the separation of the alignment into highly variable and less variable regions. Currently, our approach is best suited to identification of sites in highly variable regions – any covariation in the more conserved regions may be lost in the noise generated by the highly variable regions. This occurs because, during bootstrapping, this randomness becomes somewhat dispersed through the alignment as the sequence is shuffled and this may be sufficient to mask some of the low, but nevertheless significant, signal. By dividing the array into high variable/highly variable, more conserved/more conserved and highly variable/more conserved sections and analyzing these regions separately, it may be possible to identify additional sites of statistical significance.
Finally, in this study we only used the Mutual Information metric to identify coevolving sites. It has already been reported that the principal drawback with this method is the high background signal. Our goal was to see whether larger datasets would lead to improved signal to noise ratio and we deliberately chose HIV as this is one of the most sequenced viruses to date. However, it seems that there is a trade off between the benefit associated with the larger number of sequences and the high mutation rate of the virus which makes it difficult to obtain good alignments and which increases the background signal. It seems therefore that using Mutual Information as the only measure for identifying coevolution is not sufficient and it would be worthwhile to estimate additional quantities based on analysis of site pair frequency [16, 21] distributions, site substitution/correlation analysis [10, 26] and statistical coupling analysis [23, 27]. We are in the process of incorporating these methods into our software; our latest software uses the Average Product Correction to estimate the background signal in the mutual information [5].
Nevertheless, in spite of all these concerns, we were able to make predictions for (i) the V1/V2 loop that were supported by experimental studies, (ii) the V3 loop that were supported both by results from previous analysis and experimental studies and (iii) a novel prediction at the C terminal of the protein. Future versions of the software may be for useful functional analysis of well studied proteins with known or partially solved structures

 DownLoad: