


HTML
-
Interaction of influenza virus with the surface of the host target cells and its subsequent internalization are the subject of numerous studies (Lakadamyali M, et al., 2003; Nichols J E, et al., 1992; Rust M J, et al., 2004; Yoshimura A, et al., 1984). Influenza virion labeling is an experimental necessity for such studies because the alternative approach that utilizes specific anti-influenza antibodies or serum has a number of methodological limitations, including higher risk of artifacts due to a multistep protocol. Unfortunately, direct labeling with fluorescent molecules such as fluorescein isothiocyanate (FITC) (Yoshimura A, et al., 1984) has several disadvantages due to reduced viral infectivity and the chemical modification of external influenza virus proteins that are responsible for virus interactions with target cell receptors (Freistadt M S, et al., 2006; Nichols J E, et al., 1992). Modern protein labeling techniques with different lipid traces (e.g., lipophilic dialkylcarbocyanines) utilize milder labeling conditions compared to FITC modification and demonstrate the improved reproducibility of labeling and/or fluorescence intensity signals (Ewers H., et al., 2012; Fecek R J, et al., 2006; Lakadamyali M, et al., 2003; 1992; Rust M J, et al., 2004; Zhang S L, et al., 2010). However, such tracers do not exclude the possible disturbance of functional properties of the viral surface proteins due to covalent attachment of the label to the virions, and they require highly purified initial material and have low solubility in aqueous solutions. In addition, a recently developed membrane association-based strategy of fluorescence molecular painting that labels the viruses with a green fluorescent protein (GFP) carrying a specific glycosylphosphatidylinositol (GPI) moiety is not suitable for molecules that form di-or multimers and is absolutely dependent on the presence of the lipophilic parts of the GPI-anchored GFP for association with enveloped virus particles (Metzner C, et al., 2013).
KODETM technology, which utilizes a series of Function-Spacer-Lipid (FSL) constructs, is optimized for efficient, reliable, and gentle cell integration of different dyes into cellular and viral lipid membranes (Blake D, et al., 2011; Frame T, et al., 2007; Hadac E, et al., 2011; Henry S, 2009). In particular, unsaturated oleic acid chains of dioleoylphosphatidylethanolamine (DOPE) in FSL constructs provide a rapid and higher degree of construct insertion into lipid cellular/viral membranes, and the spacer makes the whole structure dispersible in physiological buffers. KODETM technology is a membrane-targeting labeling method that is dependent on the presence of the lipophilic parts in cellular/viral membranes. However, in contrast to covalent chemical modification with direct FITC labeling (Yoshimura A, et al., 1984), attachment of fluorescein and biotin to the cells or virions in a lipid form is carried out under physiological conditions, which allows maximum preservation of cellular/viral proteins and ensures the integrity of supramolecular ensembles on the membrane surface.
In this study, we describe the method of synthesis and insertion of highly stable fluorescein-and biotin-labeled constructs, fluo-Ad-DOPE (Figure 1A) and biot-CMG2-DOPE (Figure 1B) (Abbreviations: Ad, the adipoyl linker -OC (CH2) 4CO-; CMG2, the carboxymethylglycyl linker), into the membrane of human and avian influenza A and B viruses. We assessed whether FSL labeling had any deleterious effect on the biological properties of influenza viruses, such as viral attachment, hemagglutinin (HA) receptor specificity, neuraminidase (NA) activity, and virus growth in vitro.
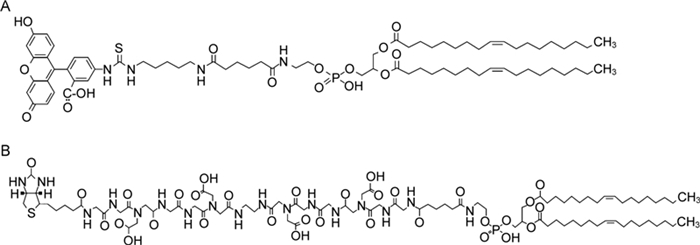
Figure 1. Chemical structures of (A) the synthetic fluorescent lipid, fluo-Ad-DOPE, where a fluorescein residue is conjugated to dioleoylphosphatidylethanolamine (DOPE) residue by a 15-atom linker, and (B) the synthetic biotinconjugated lipid, biot-CMG2-DOPE, where biotin is conjugated to DOPE by hydrophilic N-carboxymethylglycyl (CMG2) linker.
-
Madin-Darby canine kidney (MDCK) cells were obtained from the Institute of Cytology RAS (Moscow, Russia) or from the American Type Culture Collection (Manassas, VA, USA) and were maintained as previously described (Ilyushina N A, et al., 2008).
Avian influenza viruses A/FPV/Rostock/34 (H7N1), A/mallard/Pennsylvania/10218/84 (H5N2), A/duck/ France/46/82 (H1N1), and human A/Puerto Rico/8/34 (H1N1) strain were obtained from the Institute of Poliomyelitis and Viral Encephalitides RAMS (Moscow, Russia). Human A/California/07/09 (H1N1), A/ Perth/16/09 (H3N2), and B/Brisbane/60/08 were obtained from the Influenza Division of the Centers for Disease Control and Prevention (Atlanta, GA, USA). Stock viruses were prepared by one passage in the allantoic cavities of 10-day-old embryonated chicken eggs for 48 h at 37℃ (or at 33℃ for B virus), then purified and concentrated by ultracentrifugation through 30% sucrose as previously described (Mochalova L, et al., 2003). Virus samples were stored at 4℃ in phosphate-buffered saline (PBS) with 0.01% NaN3. The protein concentration of the concentrated virus was determined by the Bradford assay, as described previously (Bradford M, 1976). All experimental work was performed in biosafety level 2 laboratories approved for use with these strains by the Russian Ministry of Health or the U.S. Department of Agriculture and the U.S. Centers for Disease Control and Prevention.
-
We first synthesized an activated 1, 2-O-dioleoylsn-glycero-3-phosphatidylethanolamine (DOPE) -Ad-ONSu) substrate. For this purpose, DOPE dissolved in chloroform together with triethylamine was added to a solution of bis (N-hydroxysuccinimidyl) adipate in dry N, N-dimethylformamide. The mixture was stirred for 2 h at room temperature, neutralized with acetic acid, and then partially concentrated. After purification using column chromatography (Sephadex LH-20, 1:1 chloroform-methanol, 0.2% acetic acid), condensation of activated DOPE with 1, 5-diaminopentane (DOPE-Adcadaverine) was performed. DOPE-Ad-ONSu dissolved in dichloromethane was added to a solution of cadaverine in dichloromethane. The mixture was kept for 30 min at room temperature, and then acetic acid was added slowly during 5 min. Then the solution was concentrated and purified using a Sephadex LH-20 column (1:2 chloroform-methanol). Further, to condensate DOPE-Adcadaverine with FITC solution of DOPE-Ad-cadaverine and triethylamine dissolved in dichloromethane was added to a solution of FITC in dimethyl sulfoxide (DMSO). The mixture was kept for 2 h at room temperature, concentrated, and then purified using Sephadex LH-20 (1:2 chloroform-methanol) column to yield 8 mg (~8%) of fluo-Ad-DOPE as Et3N-salt and about 40 mg of pure material. The latter was chromatographed using silica gel (ethyl acetate-propane-2-ol-water, 6:3:1) to yield 24.3 mg (~40%) of fluo-Ad-DOPE as Na-salt. This construct is now available commercially from KODE Biotech (www.kodebiotech.com) as FSL-FLRO4 (Figure 1A). Biot-CMG2-DOPE (Figure 1B) was synthesized as described earlier (Korchagina E, et al., 2012). Both FSL lipids formed micelle-like structures in aqueous solutions with an average size of critical micelle concentration 5 μmol/L (data not shown).
-
Fluo-Ad-DOPE (0.5 mg) was dissolved in 50 μL 50 mmol/L NaHCO3 (pH 8.3) followed by addition of 450 μL PBS. The obtained stock solution was frozen and stored in the dark at –20℃. The stock solution was thawed directly before use and diluted in PBS for preparation of three concentrations, namely 25, 50, and 100 μg/mL. To label virus, an equal volume of fluo-Ad-DOPE solution was added to an equal volume of the concentrated virus. Avian A/FPV/Rostock/34 (H7N1) and human A/Puerto Rico/8/34 (H1N1) influenza viruses were labeled with all three concentrations of fluo-Ad-DOPE. Avian A/mallard/Pennsylvania/10218/84 (H5N2) and A/duck/France/46/82 (H1N1) strains were labeled with fluo-Ad-DOPE at a concentration of 50 μg/mL. All mixtures were incubated at room temperature in the dark for 2 h with periodic stirring. Any excess of fluo-Ad-DOPE was removed using chromatography with a Sephadex G-50. In addition, sucrose density gradient experiments demonstrated that all influenza viruses studied co-localized with the fluorescent fluo-Ad-DOPE label. Labeled viruses were stored at 4℃ in the dark in PBS containing 0.01% NaN3 for 4-6 weeks. Labeling of human A/California/07/09 (H1N1), A/Perth/16/09 (H3N2), and B/Brisbane/60/08 influenza viruses with biot-CMG2-DOPE was performed by the same procedure described above.
Labeling of influenza viruses with FITC (Sigma-Aldrich, St. Louis, MO, USA) was performed as described previously (Yoshimura A, et al., 1984) with some modifications. Briefly, concentrated viruses (1.5 mg/mmol/L in PBS), A/FPV/Rostock/34 (H7N1), A/mallard/Pennsylvania/10218/84 (H5N2), A/duck/France/46/82 (H1N1), and A/Puerto Rico/8/34 (H1N1) were mixed with an equal volume of FITC solution (0.1 mg/mL) in 0.5 mol/L bicarbonate buffer (pH 9.5) and incubated at room temperature for 1 h. Unconjugated dye was removed with a Sephadex G-50 column, and labeled viruses were stored at 4℃ in the dark in PBS containing 0.01% NaN3.
Viruses incubated with PBS instead of fluo-Ad-DOPE, biot-CMG2-DOPE, or FITC at the same labeling conditions and were used as unlabeled controls in all experiments. Additionally, preparations with no virus that were incubated with the FSL constructs and then subsequently purified did not carry any fluorescence.
-
MDCK cells were infected with A/Puerto Rico/8/34 (H1N1) influenza virus labeled with fluo-Ad-DOPE (50 μg/mL) at a multiplicity of infection (MOI) of 1 plaque-forming unit (PFU)/cell and fixed for 30 min in 4% formaldehyde at 24-h post-infection. Fixed cultures were examined under GFP-filtered microscopy, utilizing an inverted Olympus Ⅸ50 microscope system (Olympus, Tokyo, Japan) with a mercury bulb and a GFP filter attached to an Olympus digital camera and QCapturePro imaging software (QImaging, Surrey, BC, Canada).
-
MDCK cells were infected with biot-CMG2-DOPElabeled human influenza viruses at an identical MOI of 10 PFU/cell and fixed for 30 min in 4% formaldehyde at 2-h post-infection. Fixed cultures were blocked with 3% bovine serum albumin (BSA), stained with streptavi din-peroxidase (Sigma-Aldrich) in 3% BSA in PBS, and developed with substrate solution (0.1 mol/L sodium acetate [pH 5.0], containing 4 mmol/L o-phenylenediamine, and 0.004% H2O2). Optical density was determined at 492 nm (Victor 2 reader, Perkin Elmer, Waltham, MA, USA) and the background level from mock-infected cells used as a negative control was subtracted.
-
Adhesive MDCK cells were released from tissue culture plates with trypsin solution and washed twice with 0.2% BSA in PBS (PBA) followed by centrifugation. Aliquots of cell suspension (105 cells in 50 μL) were transferred to U-bottom plates (Medpolymer, St. Petersburg, Russia) and 50 μL/well of labeled virus (~20 μg/mL) was added. Cells were incubated with the viruses at 37℃ for 30 min on a shaker followed by three washes with PBA. Cells were then intensively mixed with 1 mL PBS and transferred into flow cytometry tubes. Fluorescence of cell-bound viruses was measured using a FACScan (Becton-Dickinson, Franklin Lakes, NJ, USA) at 488 nm and analyzed using Dako Summit v.4.3 software (Dako, Glostrup, Denmark).
-
The binding activity of influenza viruses to fetuin (containing α2, 3-and α2, 6-linked sialyl receptors) and synthetic biotin-conjugated 3′-and 6′-sialylglycopolymers obtained by conjugation of a 1-N-glycyl derivative of 3-aminopropylglycoside of 3′-and 6′-sialyllactosamine (3′SLN and 6′SLN) with poly (4-phenylacrylate) (Bovin N V, et al., 1993) was investigated in a direct solid-phase assay as described previously (Mochalova L, et al., 2003). In brief, 96-well plates (Corning Inc., Corning, NY, USA) were coated with viruses, labeled with fluo-Ad-DOPE, biot-CMG2-DOPE, or unlabeled, with a titer of 16 HA units (40 μL/well) at 4℃ for 16 h followed by washing with PBS. After blocking (100 μL/well of PBS containing 1% of BSA) plates were kept at room temperature for 90 min and washed with cold PBS containing 0.05% Tween 20 (washing solution). After addition of serially diluted sialyl receptor, 35 μL/well, in working buffer (PBS with 0.01% of Tween 20, 0.1% BSA, and 5 μmol/L NA inhibitor [2, 3-didehydro-2, 4-dideoxy-4-amino-N-acetyl-D-neuraminic acid]) plates were kept at 4℃ for 1 h. Plates were washed with cold washing solution and incubated with streptavidin-peroxidase (Sigma-Aldrich) in working buffer at 4℃ for 30 min. After washing, 50 μL/well of substrate solution (0.1 mol/L sodium acetate [pH 5.0], containing 4 mmol/L o-phenylenediamine, and 0.004% H2O2) was added, incubated for 10 min and the reaction was stopped with 2 mol/L H2SO4. Optical density was determined at 492 nm (Victor 2 reader, Perkin Elmer). Furthermore, the affinity of viruses, labeled with biot-CMG2-DOPE or unlabeled, for synthetic 6′-sialylglycopolymers obtained by conjugation of a 1-N-glycyl derivative of or 6′-sialyllactose (6′SL) or 6′SLN was measured in a competitive assay based on the inhibition of binding to peroxidase-labeled fetuin (Matrosovich MN, et al., 1993). Association constant (Ka) values were determined as sialic acid (Neu5Ac) concentration at the point Amax/2 on Scatchard plots.
-
A modified fluorometric assay was used to determine the NA activity of influenza A and B viruses, labeled with fluo-Ad-DOPE, biot-CMG2-DOPE, or unlabeled (Potier M, et al., 1979). We measured the NA enzyme activity at pH 7.0 with 33 mmol/L 2-(N-morpholino) ethanesulfonic acid hydrate (MES, Sigma-Aldrich), 4 mmol/L CaCl2, and fluorogenic substrate 2′-(4-methylumbelliferyl)-α-D-N-acetylneuraminic acid (MUNANA, final substrate concentration, 125 μmol/L; Sigma-Aldrich). The reaction was terminated by adding 14 mmol/L NaOH, and fluorescence of released 4-methylumbelliferone was measured in a Fluoroskan Ⅱ instrument (Labsystems, Thermo Scientific, Waltham, MA, USA) using excitation and emission wavelengths of 355 nm and 460 nm, respectively. Values are the mean of two to three independent determinations.
-
The infectivities of labeled and unlabeled influenza viruses were determined by the 50% tissue culture infectious dose (TCID50) and plaque assay. Briefly, confluent monolayers of MDCK cells growing in 96-well microplates were inoculated with serial virus dilutions. After 3 days, viruses were titrated by an HA assay with 0.5% packed turkey red blood cells, and virus titers were expressed as log10 TCID50/mL by the end-point method described by Reed and Muench (Reed LJ, et al., 1938).
For the plaque assay, confluent MDCK cells were incubated at 37℃ (or at 33℃ for influenza B viruses) for 1 h with 10-fold serial dilutions of virus. The cells were then washed and overlaid with minimal essential medium (MEM) containing 0.3% BSA, 0.9% Bacto agar, and 1 μg/mL L-[tosylamido-2-phenyl] ethylchloromethylketone (TPCK) -treated trypsin. After 3 days of incubation at 37℃, cells were stained with 0.1% crystal violet in 10% formaldehyde solution, and the PFU per milliliter and plaque size were determined using the Finescale comparator (Finescale Inc., Los Angeles, CA, USA).
-
To determine multistep growth curves, MDCK cells were infected with viruses, labeled with fluo-Ad-DOPE, biot-CMG2-DOPE, or left unlabeled, at an MOI 0.1 at 37℃ (or at 33ºC for influenza B viruses). After 1-h incubation, the cells were washed and overlaid with infection medium (MEM with 0.3% BSA) containing 1 μg/mL TPCK-treated trypsin. Supernatants were collected 1-, 24-, 48-, and 72-h post-infection and stored at –70℃ for titration by TCID50 assay.
-
The virus yields, sialyl receptor binding, and NA activities of labeled and unlabeled influenza A and B viruses were compared either by analysis of variance (ANOVA) or unpaired t-tests. A probability value of 0.05 was prospectively chosen to indicate that the findings were not the result of chance alone.
Cells and viruses
Synthesis of fluorescent lipid fluo-Ad-DOPE
Labeling of influenza viruses with fluo-Ad-DOPE, biot-CMG2-DOPE, or FITC
Fluorescent imaging
Biot-CMG2-DOPE-labeled virus detection
Interaction of labeled influenza viruses with MDCK cells
Receptor-binding assay
NA enzyme activity assay
Infectivity of labeled and unlabeled influenza A and B viruses
Replication kinetics
Statistical analysis
-
Concentrated A/FPV/Rostock/34 (H7N1) influenza virus was mixed together with fluo-Ad-DOPE to create labeled virus and analyzed by FACScan to determine probe labeling efficiency (Table 1). The intensity of the labeled virus increased proportionally by increasing the concentration of the FSL construct. We observed that fluo-Ad-DOPE fluorescence signal increased ~2.1-fold after 2 h incubation with the virus compared to the fluo-Ad-DOPE initial solution. We further removed an unconjugated dye by gel filtration, which allowed us to determine the real content of the label in the virions and, therefore, to measure the efficiency of the probe insertion (Table 1). In parallel, A/FPV/Rostock/34 (H7N1) influenza virus was labeled with FITC with a conventional direct method (Yoshimura A, et al., 1984), which exhibited 5-fold greater total fluorescence after purification than the same virus labeled with 25 μg/mL fluo-Ad-DOPE and ~2.1-times stronger than labeling with 100 μg/mL fluo-Ad-DOPE (Table 1). In contrast, the number of fluorescent residues incorporated into the virus particle was higher for fluo-Ad-DOPE used at all concentrations compared to FITC labeling, which showed similar results as reported earlier (Yoshimura A, et al., 1984). Notably, identical results were obtained from replicate experiments.
Label
(concentration, μg/mL)Fluorescence intensity of (×103)a Estimated number of Fluo residues per one virion (×103)b Initial labeling solution Labeling solution after 1-2 h incubation with the virus Labeled virus after purification fluo-Ad-DOPE (25) 3.5 ± 1.0 8.0 ± 1.0 3.0 ± 0.1 2.8 ± 0.1 fluo-Ad-DOPE (50) 6.0 ± 1.0 12.0 ± 1.0 5.0 ± 0.1 6.5 ± 0.1 fluo-Ad-DOPE (100) 8.5 ± 1.0 18.0 ± 1.0 7.0 ± 0.1 12.0 ± 0.1 FITC (100) 1500.0 ± 1.0 1500.0 ± 1.0 15.0 ± 0.1 1.0 ± 0.1 a: The value was normalized for equal concentration of virus particles; b: Since the amount of protein in the sample was known, the mass of a single virion was taken as 1×10-12 mg (Ruigrok R, et al., 1984). Table 1. Fluorescent labelling efficiency of A/FPV/Rostock/34 (H7N1) influenza virus
To assess the stability of the fluorescent signal, an aliquot of the concentrated A/FPV/Rostock/34 (H7N1) virus labeled with fluo-Ad-DOPE (25, 50, and 100 μg/mL) was stored for 3 weeks at 4℃, and its fluorescent intensity was measured every week (Figure 2A). Our results showed a gradual increase up to ~6.4-fold in fluorescence over time. Re-purification of the virus using a Sephadex G-50 column after prolonged storage resulted in a considerable (2.5-fold) reduction in signal (data not shown), indicating the release of fluorescent molecules either as a native lipid and/or in a degraded form into the supernatant. Similar results (i.e., increased fluorescent signal over time) were observed after fluo-Ad-DOPE labeling of avian A/mallard/Pennsylvania/10218/84 (H5N2) and A/duck/France/46/82 (H1N1) viruses and human A/Puerto Rico/8/34 (H1N1) strains (data not shown). Conversely, we did not observe any changes in fluorescent signal of FITC-labeled A/FPV/Rostock/34 (H7N1) virus after 3 weeks (Figure 2A).

Figure 2. A: Changes in the fluorescence intensity of A/FPV/Rostock/34 (H7N1) influenza virus, labeled with fluo-Ad-DOPE (25, 50, or 100 μg/mL) or FITC during 3 weeks after infection. B: Changes in the absorbance signal of MDCK cells infected with A/California/07/09 (H1N1) virus labeled with increasing concentrations of biot-CMG2-DOPE (50-200 μg/mL) during 3 weeks after infection. Absorbance of the stained cultures 2 h post-infection is shown.
-
We further assessed whether biotin-labeled biot-CMG2-DOPE probe could be used to label influenza viruses. For this purpose, the human A/California/07/09 (H1N1) strain was modified with increasing concentrations (25-200 μg/mL) of biot-CMG2-DOPE, and the labeled virus aliquots were used to infect MDCK cells (Figure 2B). The cultures were fixed 2-h post-infection and stained with streptavidin-peroxidase. Our results clearly demonstrated concentration-dependent labeling (i.e., the higher concentration of biot-CMG2-DOPE probe was used to label H1N1 virus, the more absorbance intensity observed after MDCK cell infection) (Figure 2B). Similar results were observed for the biot-CMG2-DOPE labeled A/ Perth/16/09 (H3N2) and B/Brisbane/60/08 viruses (data not shown). To assess the stability of the biotin-labeled probe, aliquots of labeled A/California/07/09 (H1N1) and A/Perth/16/09 (H3N2) viruses were stored for 3 weeks at 4℃ and were used to infect MDCK cells every week. No changes in the absorbance signal of infected MDCK cells were observed during 3 weeks compared to the initial signal (Figure 2B, data for the A/Perth/16/09 (H3N2) virus are not shown).
-
We next studied the ability of A/Puerto Rico/8/34 (H1N1) influenza virus labeled with three different concentrations 25, 50, and 100 μg/mL of fluo-Ad-DOPE to react with MDCK cell suspensions. Our results showed that when labeled virus aliquots were incubated with MDCK cells, they retained their ability to bind these cells (Figure 3). Notably, the intensities of the fluorescent signal of MDCK cells were proportional to the initial fluorescence of the viral samples (Table 1, Figure 3). In parallel, FITC-labeled H1N1 virus was also found to efficiently bind MDCK cell line suspensions. We observed that direct FITC-labeled A/Puerto Rico/8/34 (H1N1) virus that had a higher starting fluorescence compared to the fluo-Ad-DOPE-labeled strain (Table 1) resulted in a higher fluorescence of infected MDCK cells (Figure 3). In addition, cells incubated with fluo-Ad-DOPE-labeled avian A/mallard/Pennsylvania/10218/84 (H5N2) and A/ duck/France/46/82 (H1N1) viruses showed fluorescence intensities similar to that of MDCK cells infected with fluo-Ad-DOPE-labeled A/Puerto Rico/8/34 (H1N1) virus (data not shown). In addition, fluorescent spots of fluo-Ad-DOPE-labeled A/Puerto Rico/8/34 (H1N1) virus were observed on fluorescence micrographs when adherent MDCK cells were infected with the virus (Figure 4).
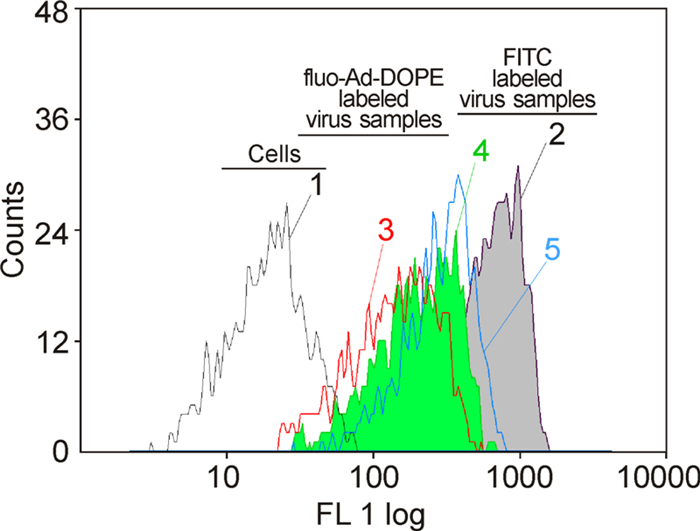
Figure 3. Binding of fluo-Ad-DOPE-labeled A/Puerto Rico/8/34 (H1N1) influenza virus to MDCK cells. FACS histograms of MDCK cells incubated (1) without virus, (2) with FITC-labeled H1N1 virus, and with fluo-Ad-DOPE-labeled virus at concentrations of (3) 25, (4) 50, and (5) 100 μg/mL.
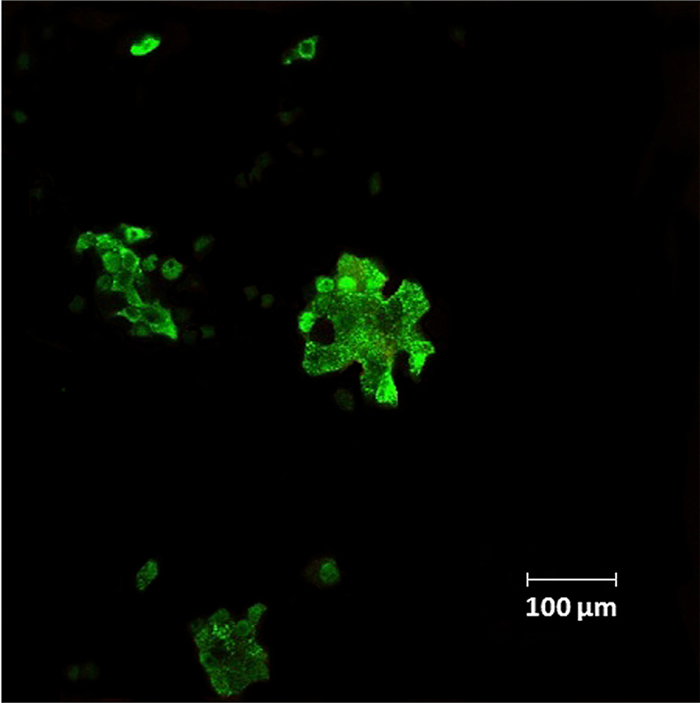
Figure 4. Fluorescence micrograph of MDCK cells adsorbed with fluo-Ad-DOPE-labeled A/Puerto Rico/8/34 (H1N1) influenza virus for 1 h and then incubated for 24 h at 37℃. Scale bar=100 μm.
-
To study the effect of fluo-Ad-DOPE labeling on receptor specificity, we measured the receptor binding of A/FPV/Rostock/34 (H7N1) virus labeled with three different concentrations of the construct (25, 50, and 100 μg/mL) to "avian-type" sialyl receptor in comparison to the unlabeled virus (Figure 5A). FITC-labeled H7N1 virus was also included into the analysis. Our results clearly showed that neither FITC covalent attachment (100 μg/mL) nor fluo-Ad-DOPE insertion significantly affected H7N1 virus receptor affinity toward 3´SLNPAA-biot (PAA, polyacrylamide; P > 0.05, Figure 5A). No changes in receptor binding to the same sialyl receptor were observed for fluo-Ad-DOPE-labeled A/ mallard/Pennsylvania/10218/84 (H5N2) and A/duck/ France/46/82 (H1N1) viruses in comparison with the unlabeled respective strains (data not shown). Furthermore, fluo-Ad-DOPE labeling had no significant effect on receptor binding of A/Puerto Rico/8/34 (H1N1) strain to the "human-type" 6´SLN-PAA-biot receptor (data not shown).
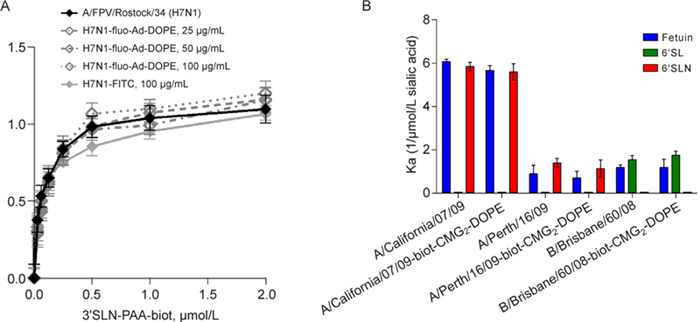
Figure 5. Receptor binding of influenza viruses labeled with fluo-Ad-DOPE or biot-CMG2-DOPE. A: Binding of A/ FPV/Rostock/34 (H7N1) influenza virus labeled with FITC (100 μg/mL), fluo-Ad-DOPE (25, 50, or 100 μg/mL), or unlabeled with 3'SLN-PAA-biot sialyl receptor. B: Receptor binding of human A/California/07/09 (H1N1), A/ Perth/16/09 (H3N2), and B/Brisbane/60/08 viruses labeled with biot-CMG2-DOPE (50 μg/mL) in comparison with the respective unlabeled strains. Association constants (Ka) of virus complexes with synthetic sialylglycopolymers conjugated to 6´SL (N) are shown. Higher Ka values indicate stronger binding. Values are the means ± SD of three independent experiments.
We next studied the effect of biot-CMG2-DOPE labeling on receptor affinity of human influenza viruses to sialic substrates (fetuin and 6´SL/N) (Figure 5B). As shown by the Ka values, A/California/07/09 (H1N1) and A/Perth/16/09 (H3N2) strains labeled with 50 μg/mL biot-CMG2-DOPE exhibited identical affinity toward fetuin and "human-type" 6´SLN polymer as the respective unlabeled viruses. Similarly, receptor binding of biot-CMG2-DOPE-labeled B/Brisbane/60/08 virus to fetuin and 6´SL did not differ significantly (P > 0.05) from that of the unlabeled influenza B virus (Figure 5B).
-
To study the impact of fluo-Ad-DOPE and biot-CMG2-DOPE labeling on NA enzyme activity, we performed conventional fluorometric assay (Potier M, et al., 1979). We compared the fluorescent intensities of methylumbelliferone (MUF, λex/em = 360/445 nm), which is the result of NA cleavage of fluorogenic substrate 2'-(4-methylumbelliferyl)-α-D-N-acetylneuraminic acid (MUNANA) and which fluorescent signal does not overlap with that of fluo-Ad-DOPE (λex/em = 495/521 nm) between labeled and unlabeled viruses (Table 2). FITC-labeled viruses were also included in the analysis for comparison. Our results showed that covalent labeling with 100 μg/ mL FITC significantly decreased NA activities of three out of four influenza viruses tested (P < 0.05). Namely, we observed a reduction in ~44% in N1 NA activity of human A/Puerto Rico/8/34 (H1N1), avian A/duck/ France/46/82 (H1N1), and A/FPV/Rostock/34 (H7N1) viruses (Table 2), which could be partially explained by alkaline deactivation of NA enzyme activity due to labeling conditions, but not by the FITC conjugation itself. In contrast, neither fluo-Ad-DOPE nor biot-CMG2-DOPE labeling significantly affected the NA activities of the tested influenza viruses (P > 0.05), except the A/Puerto Rico/8/34 (H1N1) strain, which exhibited reduced N1 NA activities of ~82% and ~52% after labeling with fluo-Ad-DOPE and biot-CMG2-DOPE, respectively (Table 2).
Influenza virus Label (concentration, μg/mL) % of NA activity compared to the respective unlabeled virusa A/Puerto Rico/8/34 (H1N1) fluo-Ad-DOPE (25) 31.3 ± 4.1* fluo-Ad-DOPE (50) 18.4 ± 3.6* fluo-Ad-DOPE (100) 23.1 ± 3.8* biot-CMG2 -DOPE (25) 41.2 ± 5.9* biot-CMG2 -DOPE (50) 53.1 ± 7.3* biot-CMG2 -DOPE (100) 48.8 ± 4.0* FITC (100) 53.1 ± 4.0* A/duck/France/46/82 (H1N1) fluo-Ad-DOPE (50) 96.4 ± 4.4 FITC (100) 72.3 ± 5.1* A/mallard/Pennsylvania/10218/84 (H5N2) fluo-Ad-DOPE (50) 97.5 ± 3.8 FITC (100) 95.2 ± 4.8 A/FPV/Rostock/34 (H7N1) fluo-Ad-DOPE (25) 92.1 ± 6.1 fluo-Ad-DOPE (50) 95.4 ± 5.0 fluo-Ad-DOPE (100) 98.3 ± 4.5 FITC (100) 43.5 ± 3.7* A/California/07/09 (H1N1) biot-CMG2 -DOPE (50) 92.7 ± 9.9 A/Perth/16/09 (H3N2) biot-CMG2 -DOPE (50) 96.3 ± 5.6 B/Brisbane/60/08 biot-CMG2 -DOPE (50) 94.1 ± 6.4 a Unlabeled viruses were incubated with PBS instead of fluo-Ad-DOPE, biot-CMG2-DOPE, or FITC at the same labeling conditions that were used for labeling with the respective dyes, and their NA activities were taken as 100%.
* P < 0.05 compared to the respective unlabeled virus.Table 2. NA activity of influenza viruses after labeling with fluo-Ad-DOPE, biot-CMG2-DOPE, or FITC
-
We next assessed whether labeling with fluo-Ad-DOPE and biot-CMG2-DOPE constructs affected influenza virus growth in vitro (Table 3, Figure 6). Human A/ California/07/09 (H1N1), A/Puerto Rico/8/34 (H1N1), A/Perth/16/09 (H3N2), and B/Brisbane/60/08 viruses labeled with 50 μg/mL fluo-Ad-DOPE or biot-CMG2-DOPE replicated to the same titers formed homogeneous plaques with similar sizes (diameter, 0.1-2.8 mm) in MDCK cells as their respective unlabeled viruses (Table 3). To further evaluate the replicative ability of the labeled influenza viruses, we assayed their viral yields in comparison with respective unlabeled strains after multiple replication cycles in MDCK cells (Figure 6, data for A/Puerto Rico/8/34 are not shown). We did not observe any significant differences in growth rates between viruses labeled with fluo-Ad-DOPE or biot-CMG2-DOPE and the respective unlabeled strains at any of the post-infection time points, indicating that non-destructive non-covalent modifications of viral membranes with FSL insertions did not affect their replicative fitness in an in vitro system.
Viruses Label
(concentration, μg/mL)Reciprocal HA titer Virus yield Plaque sizec log10 TCID50/mla log10 PFU/mLb A/California/07/09 fluo-Ad-DOPE (50) 640 7.9 ± 0.1 6.7 ± 0.2 0.5 ± 0.1 (H1N1) biot-CMG2 -DOPE (50) 320 7.7 ± 0.1 6.7 ± 0.4 0.6 ± 0.2 – 640 8.1 ± 0.3 6.6 ± 0.4 0.5 ± 0.2 A/Puerto Rico/8/34 fluo-Ad-DOPE (50) 1024 8.4 ± 0.1 8.8 ± 0.4 0.8 ± 0.1 (H1N1) biot-CMG2 -DOPE (50) 1024 8.1 ± 0.3 8.5 ± 0.3 0.9 ± 0.1 – 1024 8.0 ± 0.5 8.7 ± 0.4 0.8 ± 0.2 A/Perth/16/09 fluo-Ad-DOPE (50) 160 8.2 ± 0.2 7.8 ± 0.6 2.5 ± 0.4 (H3N2) biot-CMG2 -DOPE (50) 160 8.5 ± 0.1 8.1 ± 0.9 2.4 ± 0.5 – 160 8.3 ± 0.1 7.9 ± 0.5 2.8 ± 0.5 B/Brisbane/60/08 fluo-Ad-DOPE (50) 320 8.0 ± 0.4 6.8 ± 0.3 0.1 ± 0.1 biot-CMG2 -DOPE (50) 640 8.1 ± 0.2 6.5 ± 0.2 0.2 ± 0.1 – 640 7.8 ± 0.5 6.7 ± 0.2 0.2 ± 0.1 a: Values are the log10 TCID50/ml ± SD from three independent determinations. TCID50 values were determined in MDCK cells with 10-fold serial diluted viruses, incubated for 72h at 37℃ (or at 33℃ for influenza B viruses), and calculated by the Reed-Muench method (Reed LJ, et al., 1938); b: Values are the log10 PFU/mL ± SD from three independent determinations. PFU was determined in MDCK cells by plaque assay after 3days of incubation at 37℃ with 10-fold serial diluted viruses (or at 33℃ for influenza B viruses); c: Values are mean plaque diameter (mm) ± SD as measured by using the Finescale comparator. Table 3. Growth characteristics of human influenza viruses labeled with fluo-Ad-DOPE or biot-CMG2-DOPE in vitro
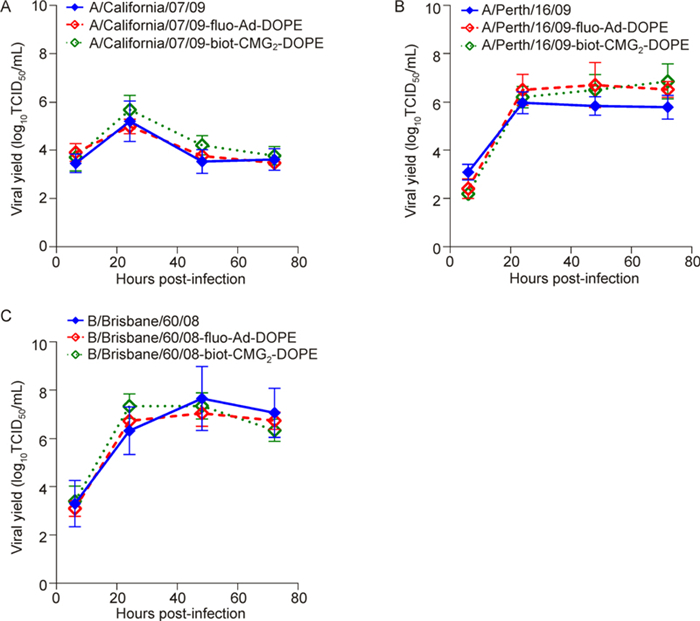
Figure 6. Replication kinetics of human (A) A/ California/07/09 (H1N1), (B) A/Perth/16/09 (H3N2), and (C) B/Brisbane/60/08 influenza viruses labeled with 50 μg/mL fluo-Ad-DOPE or biot-CMG2-DOPE in comparison with respective unlabeled strains in MDCK cells. Confluent cells were infected with viruses at a multiplicity of infection of 0.1 PFU/cell. Virus yield (TCID50/mL) was titrated in MDCK cells 6-, 24-, 48-, and 72-h post-infection. Each data point represents the mean value from two independent experiments.
Fluo-Ad-DOPE labeling of influenza viruses
Biot-CMG2-DOPE labeling of influenza viruses
Effect of fluo-Ad-DOPE labeling on binding of influenza viruses with MDCK cells
Effect of FSL labeling on receptor specificity of influenza viruses
Effect of FSL labeling on NA activity of influenza viruses
Effect of FSL labeling on replicative ability of influenza viruses
-
The goal of this study was to characterize the properties of FSL labeling with either fluorescent fluo-Ad-DOPE or biotinylated biot-CMG2-DOPE constructs and determine their utility for future studies to track influenza viruses in vitro, in vivo, or in the environment. Several recent studies on the insertion of synthetic lipid constructs, including fluo-Ad-DOPE into eukaryotic cells, indicated that these constructs have no significant effect on the physical properties of cellular membrane proteins (Blake D, et al., 2011; Frame T, et al., 2007; Georgakopoulos T, et al., 2012; Henry S, 2009; Hult A K, et al., 2012; Oliver C, et al., 2011). Due to their relatively small size, enveloped viruses, including the influenza viruses studied here, are expected to be more sensitive to disturbances of their components and architecture compared to the eukaryotic cells. Thus, labeling of these viruses should only be carried out in mild conditions to avoid virion curvature as a result of label insertion. In addition, more than half of the influenza viral membrane area is occupied by the surface glycoproteins, HA and NA (Wright P F, et al., 2006). Therefore, membrane disturbance by labeling probes should not affect the interactions between HA and NA proteins, which would dramatically affect target cell recognition and virus infectivity. Indeed, it was reported that the infectivity of FITC-labeled influenza virus decreased either by ~0.5 log10 (Nichols J E, et al., 1992) or 33%(Yoshimura A, et al., 1984) after FITC probe attachment.
In the present study, we assayed whether influenza A and B viruses labeled with the FSL constructs hydrophobic fluo-Ad-DOPE and hydrophilic biot-CMG2-DOPE retain their biological properties in vitro, such as HA receptor specificity, NA activity, and replicative ability. Neither FSL significantly affected influenza virus infectivity or ability to bind sialyl receptors, even at high concentrations, suggesting that the labeled viruses remained biologically active. Moreover, neither fluo-Ad-DOPE nor biot-CMG2-DOPE probes influenced NA activities of the influenza viruses, except the A/Puerto Rico/8/34 (H1N1) strain, which exhibited reduced N1 NA activity after lipid probe incorporation into the viral membrane. It has been shown that the pH stability of influenza NA enzymes can vary between influenza strains (Suzuki T, et al., 2004). We observed that A/Puerto Rico/8/34 (H1N1) virus NA activity was highly sensitive to labeling with both probes as well as pH changes (data not shown). One could speculate that the observed decrease in NA activity was associated with the individual properties of the particular N1 NA protein, which requires further investigation.
In the present study, we also observed an unexpected phenomenon in the dynamics of the labeling process with fluo-Ad-DOPE that was not reported previously when this fluorescent construct was used to label eukaryotic cells (Blake D, et al., 2011; Frame T, et al., 2007; Henry S, 2009; Oliver C, et al., 2011). Namely, our data showed a ~2.1-fold increase in the fluorescence signal when the influenza virus was mixed with fluo-Ad-DOPE solution. This change could be explained by the quenching of neighboring fluorophores of the fluo-Ad-DOPE construct. However, when fluo-Ad-DOPE is mixed with the virus, the fluorescent lipid construct is incorporated into the viral membrane, which decreases the fluorescence quenching and thus results in increased total signal. Furthermore, when the fluo-Ad-DOPE-labeled viruses were stored at 4℃, their fluorescence increased up to ~6.4-fold over time and reached a maximum plateau after 3 weeks. This increase in fluorescence likely occurs due to the partial release of fluo-Ad-DOPE residues into the solution, while maintaining the constant number of fluorescent probes in the viral sample. We can speculate that the fluorescence quenching could be lower in mixedtype micelles generated by released fluo-Ad-DOPE and viral lipids compared to homogeneous micelles comprising solely fluo-Ad-DOPE constructs. In parallel, the remaining fluo-Ad-DOPE lipid constructs disperse more evenly in the viral membrane, which reduces their quenching effect on each other and, as a consequence, increases influenza virion fluorescence.
Furthermore, in the present study we demonstrated that labeling of A/FPV/Rostock/34 (H7N1) influenza virus with a two-fold greater concentration of fluo-Ad-DOPE did not result in two-fold increased fluorescence of the labeled virus. This can be explained by the fact that viral membrane itself is more rigid compared to the cellular membranes and does not allow free "docking" of the incorporated probe. Therefore, labeling of influenza viral membranes with fluo-Ad-DOPE and most likely with biot-CMG2-DOPE probes should require more time for their even distribution compared to eukaryotic cell labeling (Blake D, et al., 2011; Frame T, et al., 2007; Henry S, 2009; Oliver C, et al., 2011). Taken together, our results suggest that stored labeled influenza viruses should be purified from residual probes before experiments. Although this is somewhat inconvenient, the mild conditions, good reproducibility, and lack of effect on viral biological properties (e.g., HA receptor specificity, NA activity, and replicative ability in vitro) makes the labeling approach described here very attractive for studying the early stages of influenza infection, such as virus attachment, endocytosis of the virus into the target cells, and intracellular trafficking of the endocytosed virus. Additionally, it is worth mentioning that the availability of fluorescein-labeled and biotin-labeled probes provides good flexibility in experimental design. Multiple FSL labels can be added to the same viral surface together with FSL-peptide constructs (Hadac E, et al., 2011), providing an advantage over previously described labeling approaches (Lakadamyali M, et al., 2003; Nichols J E, et al., 1992; Rust M J, et al., 2004; Yoshimura A, et al., 1984).
Furthermore, it has been shown that the functional balance between influenza surface glycoproteins HA and NA should be maintained for proper viral fitness (Matrosovich M, et al., 2004; Wagner R, et al., 2002). Because fluo-Ad-DOPE and biot-CMG2-DOPE probes demonstrated minimal effect on NA activity compared to FITC labeling, these FSL constructs are more useful than FITC dye for assessing infectious processes related to the whole influenza virus, as well as for studying mechanisms that only involve the HA protein, such as virus-endosome fusion or viral uncoating. These features of the FSL constructs should make it possible to use labeled influenza viruses to identify cells (e.g., dendritic cells, macrophages, B cells, and cells in the mucosa) that interact with the virus early in infection and assess which subsets of cells internalize/bind the virus. Future studies are underway to determine whether fluo-Ad-DOPE-and biot-CMG2-DOPE-labeled influenza viruses retain their infectivity and elicit characteristic immune responses in vivo.
-
We thank Dr. Peter F. Wright for helpful discussions and reviewing the manuscript. This study was partially (NVB) supported by RAS Presidium Grant "Molecular and Cell Biology."
-
All the authors declare that they have no conflicts of interest. This article does not contain any studies with human or animal subjects performed by the any of the authors.
-
NI, EC, and NB designed the experiments. NI, EC, and EK carried out the experiments. NI, EC, AG, SH, and NB analyzed the data. NI, EC, and NB wrote the paper. All authors read and approved the final manuscript.

 DownLoad: