


HTML
-
Avian infectious bronchitis virus(IBV)is a prototype coronavirus containing a single-str and ed positive-sense RNA genome(Cook et al., 2012) and has been identified as the causative agent of highly contagious respiratory disease in chickens. Since the first description in 1931 as a respiratory disease in chicks, many IBVs, which replicate in the respiratory tract, alimentary tract, kidney, and reproductive system and cause relevant pathological damage, have been reported worldwide(Schalk and Hawn, 1931; Yu et al., 2001; Benyeda et al., 2009; Fan et al., 2012).
In the poultry industry, IBV causes serious economic losses. Direct losses result from mortality, secondary bacterial infections, decreased weight gain, poor production and egg quality, and false layers, whereas indirect losses arise from increasing costs and challenges in IBV prevention(Awad et al., 2014). There are multiple known strains of IBV, and increasing numbers of variants have emerged continuous recombination, resulting in more diversified and complicated genotypes and serotypes(Li et al., 2012; Mo et al., 2013; Chen et al., 2015). With poor vaccine crossprotection between different serotypes, such diversity makes it difficult to prevent and control IBV infection using vaccines. Moreover, IBV is also similar to human coronaviruses, such as severe acute respiratory syndrome coronavirus(SARS-CoV) and Middle East respiratory syndrome coronavirus(Xu et al., 2015).
The innate immune response is the first line of host defense against exogenous pathogens and consists of a network of mechanisms, molecules, and cells, particularly pattern recognition receptors(PRRs), which function to identify various pathogen-associated molecular patterns(PAMPs). Toll-like receptors(TLRs) and RIG-I-like receptors(RLRs)are two primary and important PRRs involved in recognition of viral components. Endosomal TLR3 and TLR7 recognize viral double-str and ed RNA(dsRNA) and single-str and ed RNA(ssRNA), respectively(Mogensen, 2009). Upon binding to their respective lig and s, TLR3 recruits the adaptor TIR domain-containing adaptor inducing interferon(IFN)-β(TRIF), and TLR7 recruits Myeloid differentiation primary response protein 88(MyD88). TRIF associates with tumor necrosis factor(TNF)receptor-associated factor(TRAF)3 and TRAF6, whereas MyD88 only interacts with TRAF6. In the downstream response, TRAF6 phosphorylates the transcription factor IFN regulatory factor(IRF)7 directly or activates the transforming growth factor β-activated kinase 1(TAK1) complex to bind to the inhibitor of kappaB kinase(IKK)complex, composed of IKKα, IKKβ, and IKK , and leads to activation of nuclear factor of kappaB(NF-κB). Active NF-κB translocates into the nucleus from the cytoplasm and induces the expression of inflammatory cytokines and chemokines, including interleukin(IL)-1β, IL-6, IL-12, IL-8, macrophage inflammatory protein(MIP)-1β, and regulated on activation, normal T expressed and secreted(RANTES). On the other h and, TRAF3 recruits the IKK-related kinases TANK-binding kinase 1(TBK1) and IKKԑ, resulting in phosphorylation of IRF7. The phosphorylated IRF7 translocates into the nucleus and then activates the promoters of type I IFNs and IFN-inducible gene expression(Takeuchi and Akira, 2009; Kawasaki and Kawai, 2014). Notably, some downstream signaling molecules are intersectional with other TLRs and RLRs.
RLRs are cytoplasmic RNA helicases that recognize viral RNA in the cytoplasm; RIG-I senses the 5′-triphosphate group and blunt end of short dsRNAs or ssRNA hairpins, and melanoma differentiation-associated protein 5(MDA5) detects long-duplex RNAs or dsRNA replication intermediates of positive-str and viruses(Wu et al., 2013). The activated RLRs interact with the adaptor mitochondrial antiviral signaling protein(MAVS), thereby directly binding to TRAF3 or TRAF6 and TRAF2. The recruitment of TRAF6 and TRAF3, which is responsible for its E3 ubiquitin ligase activity for the assembly of the IKKԑ and TBK1 complex, leads to the activation of NF-κB and IRF7, promotes the production of IL-8 and IL-12, and enhances the induction of type I IFN(Nakhaei et al., 2009). The RIG-I gene has not been identified in chickens, and the MDA5 signaling pathway has been shown to mediate type I IFN induction, with laboratory of genetics and physiology 2(LGP2) function as a positive regulator(Zou et al., 2009; Liniger et al., 2011). The novel stimulator of IFN genes(STING)protein has been found in the endoplasmic reticulum and mitochondrial membrane in DF-1 cells and has been shown to activate both IRF7 and NF-κB transcription pathways to induce IFN-β through interactions with MDA5 and MAVS(Cheng et al., 2015).
Studies on the interaction between coronavirus and the innate immune responses of their hosts have suggested that infection by coronaviruses, such as SARS-CoV, mouse hepatitis viruses(MHVs), and porcine epidemic diarrhea virus(PEDV), could activate the TLR signal through both TRIF-and MyD88-driven pathways(Sheahan et al., 2008; Frieman et al., 2009; Totura et al., 2015), resulting in the upregulation of TLR, cytokine, and chemokine expression and providing effective intrinsic antiviral immune responses(Law et al., 2009; Dosch et al., 2009; Mazaleuskaya et al., 2012; Cao et al., 2015). RIG-I is upregulated during MHV infection, and viral recognition by RIG-I and MDA5 is the driving force for the activation of IRF3 and the ensuing induction of IFN-β(Li et al., 2010). Several coronaviruses, including IBV, have evolved evasive strategies to avoid immunological defense mechanisms from the host by utilizing innate immune signaling molecules(Zhong et al., 2012; Kint et al., 2015). SARS-CoV can negatively regulate the assembly of STING-MAVS-TBK1/IKKε complexes required for activation of IRF3 to disrupt antiviral defenses(Sun et al., 2012).
Transcriptional analysis of the tracheal mucosal and kidneys in IBV-infected chickens have identified abundant differentially expressed genes. Multiple innate immune genes, including TLRs, MDA5, type I IFNs, cytokines, chemokines, and signal transduction molecules, are activated locally, forming a large network(Guo et al., 2008; Cong et al., 2013; Smith et al., 2015). Furthermore, the mRNA expression levels of type I IFNs, inflammatory cytokines, and chemokines are altered in IBV-infected tissues(Jang et al., 2013; Dar et al., 2014; Okino et al., 2014; Nii et al., 2014). However, the relationship between IBV and the host innate immune system is poorly understood, and the specific mechanisms of the innate immune response against IBV infection through the TLR and MDA5 signaling pathways remain unclear.
Although IBV can replicate in various tissues, the natural infection of IBV first occurs in the respiratory tract epithelium and then spreads to other tissue epithelia(Cavanagh, 2005). The tissue tropism and pathogenicity of IBV are varied and dependent on the strain; however, some viruses lead to respiratory distress, nephritis with urate deposits, and enteric or reproductive diseases(Ignjatovic et al., 2002; Chousalkar et al., 2007; Cavanagh, 2007), and the infection mechanism related with tropism of IBV in different epithelial cells has been studied(Wickramasinghe et al., 2011). However, whether the intrinsic immune responses against IBV differ among infected tissues is unknown.
In the present study, we performed a comprehensive analysis of TLR and MDA5 signaling pathways and innate immune cytokine responses to IBV infection in host trachea and kidney tissues at both the mRNA and protein levels. The results showed considerable activation of TLR and MDA5 signaling pathways and induction of innate immune cytokines in the trachea, but downregulation of these components in the kidney. This is the first study to comprehensively address TLR and MDA5 signaling pathway responses to IBV in chicks and provide essential information to further improve our underst and ing of the immune pathogenic mechanism of avian coronaviruses.
-
The pathogenic IBV strain Massachusetts 41(M41) used in this study was purchased from China Institute of Veterinary Drug Control(Beijing, China) and propagated in 10-day-old specific pathogen-free(SPF)chicken embryos(Beijing Merial Vital Laboratory Animal Technology Co., Ltd). The infected allantoic fluid was harvested at 72 h postinoculation, confirmed to lack other pathogens as analyzed by reverse transcription polymerase chain reaction(RT-PCR) and bacterial culture, titrated in 10-day-old SPF chicken embryos, and finally stored at –80 ℃ before animal infection.
-
The SPF white leghorn chicks used in this study were self-hatched. The chicks were raised in a sterile, quiet, comfortable animal room of the Institute of Animal Science and Technology of Guangxi University until reaching 14 days of age. Sterile food and water were provided ad libitum.
-
Forty-eight 2-week-old chicks were r and omly allocated to two groups of 24 chicks each and raised separately in two isolation rooms with individual ventilation. Chicks from group A were inoculated oculonasally with 0.2 mL of 106 EID50 of IBV M41 allantoic fluid per chick. Chicks from group B were inoculated with 0.2 mL sterilized negative allantoic fluid in the same manner. Clinical symptoms were observed and recorded daily. At 1, 3, 5, 8, 11, 14, 21, and 28 days post inoculation(dpi), three birds in each group were bled before euthanasia and necropsy. The trachea and kidney tissues were collected aseptically. Whole blood was collected, and sera were separated enzyme-linked-immunosorbent assay(ELISA). All samples were stored appropriately and immediately.
-
After washing in phosphate-buffered saline(PBS), trachea and kidney tissues were fixed in 4% paraformaldehyde solution for 1 day, embedded in paraffin wax, cut into 3-μm-thick sections(Leica RM4450, Germany), and stained with hematoxylin and eosin using st and ard histological procedure. The slides were examined by light microscopy(Nikon, Japan).
-
Equiponderant trachea and kidney tissues from each chick at various time points were prepared. The tracheal lumen was flushed with RL buffer repeatedly to lyse the mucosal tissue for RNA extraction, and kidney tissue was homogenized with RL buffer on ice. Total RNA was extracted using a MiniBEST Universal RNA Extraction Kit(TaKaRa, Shiga, Japan), including a gDNA Eraser Spin Column for treating DNA contamination according to the manufacturer's instructions. The concentration of RNA and the A260/A280 ratio were measured using an ultralow volume spectrometer(Biodrop, UK), and agarose gel electrophoresis was used to detect the integrity of the extracted RNA. A PrimeScript RT reagent Kit(TaKaRa)was used in cDNA synthesis for real-time PCR. Five hundred nanograms of total extracted RNA was added to 10 μL of reaction reagent including r and om 6 mers, oligo dT primers, PrimeScript RT Enzyme Mix I, and buffer. The mixture was then incubated at 37 ℃ for 15 min and 85 ℃ for 5 s for preparation of cDNA. cDNA was then stored at –20 ℃.
-
Absolute and relative quantification analyses were used to determine the absolute copy numbers of IBV RNA and the levels of mRNA expression of target genes, respectively. All primers pairs used for constructing recombinant plasmids and real-time PCR detection are listed in Table 1. Real-time PCR using SYBR Premix Ex Taq Ⅱ mix(TaKaRa)was performed on an iQ5 instrument(Bio-Rad, Hercules, USA)as previously described(Mo et al., 2011). The annealing temperatures for each gene are listed in Table 1. The IBV RNA copy number was calculated according to the st and ard curve using the cycle threshold(Ct). The relative expression ratios of target genes were calculated using Ct values and amplification efficiencies by the Pfaffl method operated in REST software, as previously described(Pfaffl et al., 2002). Several endogenous reference genes were evaluated to determine their suitability in IBV-infected chickens(data not shown), and glyceraldehyde 3-phosphate dehydrogenase(GAPDH) and TATA-box-binding protein(TBP)were used to normalize fold changes in expression.
Gene Sequences (5′-3′) a Amplicon size (bp) Annealing (℃) Accession no. IBV-N F:CAGAAGAAGGGCTCTGCATTAC
R:AGGTTGAGCATTGCCGTAACAC200 60 FJ548847.1 TLR3 F:GCAACACTTCATTGAATAGCCTTGAT
R:GCCAAACAGATTTCCAATTGCATGT92 62.5 EF137861.1 TLR7 F:AAGTCCCGGTATGTTCAGCT
R:GGACAGGGTATTGTTCATAGC132 58.1 NM_0001011688.2 MyD88 F:CAGCGAGCAATAGCATCCAG
R:CAACAGAGCCACCTTGTATC104 61 NM_001030962.1 TRIF F:TTCAGCCATTCTCCGTCCTC
R:GCCAATGATGCTTCCACAG120 60 NM_001081506.1 MDA5 F:CAGCCAGTTGCCCTCGCCTCA
R:AACAGCTCCCTTGCACCGTCT210 60 NM_001193638 LGP2 F:CCAGAATGAGCAGCAGGAC
R:AATGTTGCACTCAGGGATGT109 60 XM_004948615 MAVS F:CCTGACTCAAACAAGGGAAG
R:AATCAGAGCGATGCCAACAG123 60 NM_001012893 STING F:TGACCGAGAGCTCCAAGAAG
R:CGTGGCAGAACTACTTTCAG82 60 XM_001232170 TBK1 F:AAGAAGGCACACATCCGAGA
R:GGTAGCGTGCAAATACAGC170 58.1 NM_001199558.1 IKKε F:TGGATGGGATGGTGTCTGAAC
R:TGCGGAACTGCTTGTAGATG117 60 XM_428036.4 TRAF3 F:GGACGCACTTGTCGCTGTTT
R:CGGACCCTGATCCATTAGCAT107 60 XM_004936348.1 TRAF6 F:GATGGAGACGCAAAACACTCAC
R:GCATCACAACAGGTCTCTCTTC170 60 XM_004941547.1 IKKα F:GAGGGGTGGAGGCTTAGATC
R:ACTTTCCTCGGGATGCAAGA141 60 NM_001012904.1 IKKβ F:TACAGGCAATCCAGACCTTCG
R:GACTGCCACTAACAGGACCAC234 60 NM_001031397.1 NF-κB p65 F:CATTGCCAGCATGGCTACTAT
R:TTCCAGTTCCCGTTTCTTCAC102 60 NM_205129.1 IRF7 F:ACACTCCCACAGACAGTACTGA
R:TGTGTGTGCCCACAGGGTTG134 58.5 NM_205372.1 IFN-α F:GGACATGGCTCCCACACTAC
R:TCCAGGATGGTGTCGTTGAAG75 61.3 X92476.1 IFN-β F:TTCTCCTGCAACCATCTTC
R:GAGGTGGAGCCGTATTCT82 62.5 AY974089.1 IL-1β F:AACCCGACCAGGTCAACA
R:CGGTACATACGAGATGGAAAC101 61.3 AJ245728.1 IL-6 F:ATCCCTCCTCGCCAATCTG
R:CCTCACGGTCTTCTCCATA103 61.3 HM179640.1 IL-8 F:CACAGCTCCACAAAACCTCA
R:GTCCTACCTTGCGACAGAGC118 60 NM_205498 IL-10 F:ATGCTGCGCTTCTACACA
R:CCATGCTCTGCTGATGACT73 61.3 AY647438.1 IL-12 F:TCTGCTAAGACCCACGAGA
R:TTGACCGTATCATTTGCCCAT82 60 NM_213571 MIP-1β F:TGCTGGTGTTGTGTTCATC
R:GTCCTGTACCCAGTCGTT73 63 L34553.1 GAPDH F:GGTGGTGCTAAGCGTGTTA
R:CCCTCCACAATGCCAA179 60.5 X01578.1 TBP F:TAGCCCGATGATGCCGTAT
R:TTCCCTGTGTCGCTTGC147 62.5 D83127 Note: a Primers for TLR3, IFN-α were previously reported (Karpala et al., 2008), and those for GAPDH and TBP were also previously reported (Li et al., 2005). F indicates forward primer; R indicates reverse primer. Table . Primers used in this study.
-
The concentrations of IFN-α, IFN-β, IL-1β, IL-6, IL-8, IL-10, IL-12, and MIP-1β in the trachea and kidney tissues were measured using a commercially available ELISA kit(Chenglin Biotechnology, Beijing, China)according to the manufacturer's instructions. To determine the exact concentration of target protein, st and ards were added to generate a st and ard curve, which was used to calculate the concentration based on the OD values. Each sample was analyzed in triplicate. The IBV-specific IgG antibody in serum was measured according to methods described in our previous report(Li et al., 2012), and the purified IBV N protein was used as antigen for the reaction. The OD values were read using a microplate reader(iMark; Bio-Rad)at 450 nm absorbance.
-
Data are expressed as the mean ± st and ard error of the mean(SEM). To identify significant differences, mean comparisons were performed using one-way analysis of variance(ANOVA)for viral load and Student's t tests for protein levels in SPSS17.0 software(SPSS Inc., Chicago, IL, USA). The results were considered to be statistically significant when the P value was less than 0.05.
Virus
Chicks
Experimental design
Histopathology analyses
RNA extraction and reverse transcription
Real-time quantitative PCR(qPCR)for gene expression analysis
ELISA for measurement of cytokines in tissues and IBV IgG in serum
Statistical analysis
-
Several chicks in group A showed slight sneezing at 2 and 3 dpi. At 4 dpi, clinical signs became obvious in most chicks and included depression, ruffled feathers, tracheal rales, frequently shaking, mouth breathing, and coughing. The clinical signs were reduced at 11 dpi and almost completely disappeared at 14 dpi. At 3 and 5 dpi, hyperemia catarrhal exudates in tracheal mucosa were observed in group A, but no distinct gross lesions in the kidneys or other organs were observed.
Similar results were observed in analysis of histopathological changes. The tracheal mucosa exhibited severe lesions at 3 and 5 dpi(Figure 1B, 1C), and slight recovery was observed from 8 dpi, with chicks showing a return to normal histopathological features by 14 dpi(Figure 1D, 1F). Lesions in the kidneys were discovered at 8 dpi(Figure 1H) and lasted to 28 dpi; however, the severity of lesions was reduced beginning at 14 dpi. No birds in any group died during the experiment. All chicks in the control group showed no clinical signs, gross lesions, or pathological changes.
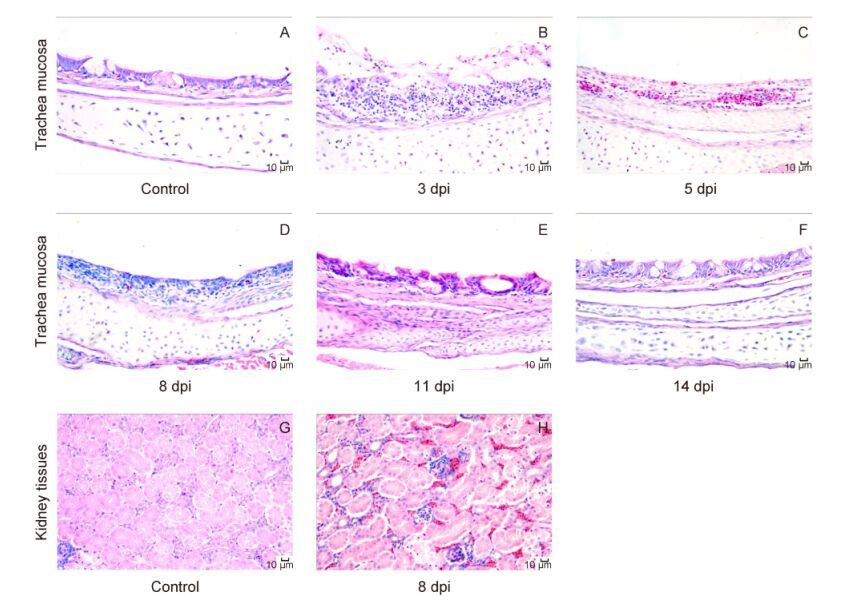
Figure 1. Microscopic changes in the trachea and kidneys of chicks infected with IBV. Hematoxylin and eosin staining is shown. Bar = 10 μm. (A and G) The trachea and kidney from control group, showing no microscopic alterations. (B) Loss of the tracheal cilia, destruction of the structure, acute necrosis of epithelial cells, and infiltration of mononuclear lymphocytes and heterophils were found at 3 dpi. (C) The tracheal mucosa exhibited severe capillary hyperemia and inflammatory cell infiltration at 5 dpi. (D) Slight recovery of epithelial cell proliferation with lymphocyte infiltration at 8 dpi. (E): Epithelial cells were converted to columnar cells, and a few cilia appeared at 11 dpi. (F) The tracheal mucosa reached the normal level at 14 dpi. (H) Hyperemia and degeneration in the kidney at 8 dpi, with nuclear enrichment in renal tubular epithelial cells and lymphocytic infiltration.
-
The kinetics of viral loads in the trachea and kidney are illustrated in Figure 2. In group A, IBV RNA was detected in the trachea at 1 dpi and reached a peak at 5 dpi with a viral copy number of around 4.8 × 10⁵ copies/μL. Additionally, the level remained high at 11 dpi. However, from 14 to 28 dpi, viral load in the trachea was barely detectable. The viral load in the kidney was lower than that in the trachea, with a peak at about 3.53 × 10² copies/μL at 5 dpi. IBV RNA was not found in the trachea or kidney of chicks in control group B. The level of IBV-specific IgG in serum was measured, and specific seropositivity was detected in group A from 5 to 28 dpi. The IgG level increased beginning at 5 dpi and reached a peak at 14 dpi, showing a gradual decrease thereafter, with full degradation by 28 dpi(Figure 3).
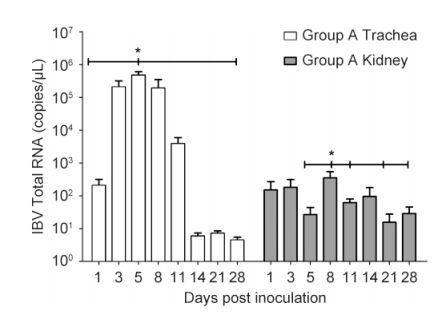
Figure 2. IBV total RNA in the trachea and kidney tissues after IBV M41 infection. Error bars indicate SEMs. Asterisks indicate significant differences among values at different time points (P < 0.05).
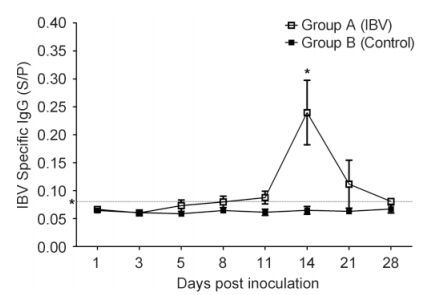
Figure 3. The level of IBV-specific IgG antibodies in the serum after IBV M41 infection. Error bars indicate SEMs. Asterisks indicate significant differences among values at different time points (P < 0.05). The asterisk along the dotted line at 0.08 on the y-axis indicates IgG-positive serum with an S/P value of > 0.08.
-
Changes in the mRNA levels of TLR3, TLR7, and their adaptor molecules in IBV-infected tissues are illustrated in Figure 4A and 4B. The mRNA expression levels of TLR3, TLR7, and MyD88 were significantly upregulated at 1–11 dpi in the trachea and 21 dpi in the kidneys of infected chicks compared with those in control chicks. However, some molecules were downregulated in the kidney. Taken together, these results showed that TLR3, TLR7, and their adaptor molecules were activated during the early stages of infection. However, the significant upregulation of TLR7 and TRIF at 21 dpi suggested that these molecules may be involved in the later stages of infection.
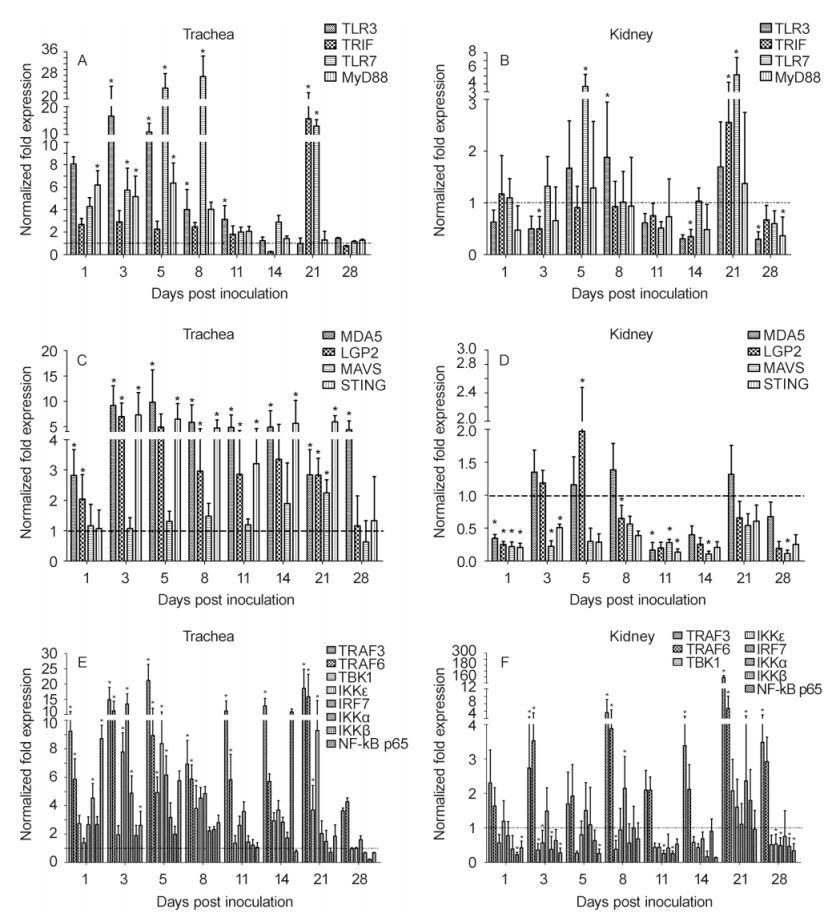
Figure 4. Relative mRNA expression levels of TLR3, TLR7, MDA5, and associated signaling molecules in IBV M41-infected trachea and kidney specimens. Error bars indicate SEMs. Asterisks indicate significant differences among different time points (P < 0.05).
Interestingly, the transcriptional regulation of MDA5 and its adaptor molecules varied in the two tissue types(Figure 4C, 4D). In the trachea, significant upregulation of MDA5 was detected throughout the experiment. Additionally, LGP2 was upregulated from 1 dpi and STING was upregulated from 2 dpi, with significant upregulation until 21 dpi. Moreover, MAVS was only significantly upregulated at 21 dpi. In the kidney, LGP2 was significantly upregulated at 5 dpi; however, some other genes exhibited significant downregulation in the kidney.
Upregulation of TRAF3 and TRAF6 mRNA was observed in the trachea and kidney throughout the experiment(Figure 4E, 4F). As downstream genes, TBK1, IKKԑ, IKKα, IKKβ, IRF7 and NF-κB, which activate to produce type I IFN, pro-inflammatory cytokines and chemokines, exhibited contradictory changes in the two tissues, with significant upregulation at 1–8 dpi and 21 dpi in the trachea and significant downregulation at 1–28 dpi in the kidney.
-
Analysis of the expression levels of two type I IFN mRNAs showed that both molecules were distinctly upregulated in the trachea and downregulated in the kidney(Figure 5). The mRNA expression of IFN-α had two peaks at 3 and 21 dpi, respectively, whereas that of and IFN-β peaked at 5 and 21 dpi in infected trachea tissues. The mean concentrations of IFN-α and IFN-β were significantly increased at 3, 5, and 21 dpi compared with that in the uninfected group(Figure 5B, 5C). However, at 14 and 21 dpi, inconsistent mRNA and protein levels were observed in the kidney(Figure 5A, 5C).

Figure 5. Changes in the gene expression and protein level of type I IFN, inflamatory cytokines, and chemokines in IBV M41-infected trachea and kidney tissues. The expression levels of mRNAs were detected by real-time qPCR (A). The protein levels of the targets were detected in the trachea (B) and kidney (C) using ELISA kits. Error bars indicate SEMs. Asterisks indicate significant differences among time points (P < 0.05).
The expression levels of mRNAs encoding inflammatory cytokines, including IL-1β, IL-6, IL-10, and IL-12, showed similar trends, with significant increases in the infected trachea and peaks at 5 dpi, lasting until 14 dpi(Figure 5A). Significantly higher concentrations of IL-1β, IL-6, and IL-10 at 8 dpi were also observed compared with those in the control group, and IL-12 was also upregulated at 3–21 dpi(Figure 5B, 5C). In contrast, the mRNA expression levels of these cytokines were downregulated in the kidney, except for IL-1β, which was significantly upregulated(Figure 5A).
The mRNA levels of IL-8 and MIP-1β were significantly upregulated in both infected tissues, with a peak at 5 dpi in the trachea(Figure 5A); however, the protein levels of these two chemokines were quite different(Figure 5B, 5C). The mean concentration of IL-8 was significantly increased in the infected trachea at 3–21 dpi and was markedly higher than that in the control group at 14 and 21 dpi in the kidney. However, MIP-1β was only higher than the control group at 11 dpi in the trachea, and no significant changes were observed in the kidneys of chicks from both groups.
Clinical signs and histopathological lesions
The dynamics of IBV viral RNA and changes in IBV-specific IgG in infected chicks
Transcription profiles of TLR and MDA5 signaling pathway responses to IBV infec tion
Expression of innate immune cytokines in tissues after IBV infection
-
In this study, we monitored the infection course of IBV M41-challenged birds. The results showed that more pronounced histopathological lesions and higher of IBV loads were discovered in the trachea during early stages of the infection, consistent with previous studies(Benyeda et al., 2009; Fan et al., 2012; Okino et al., 2014), suggesting that the trachea was the target tissue for infection by the IBV M41 strain. Copy numbers of viral RNA in both the trachea and kidney at 1 dpi were similar because the virus spread throughout the body of the host via viremia(Wickramasinghe et al., 2011). However, IBV RNA was detected in the kidney with a considerable lower copy number, suggesting that IBV M41 infected and replicated somewhat in the kidney. Hyperemia and degeneration in the kidney were found from 8 dpi, which may be associated with tissue tropism of IBV.
Because TLRs, MDA5, and adapter molecules are involved in recognition of IBV RNA(Guo et al., 2008; Cong et al., 2013; Xu et al., 2015), we examined the mRNA dynamics of TLR3, TLR7, MDA5, and downstream signaling molecules at different phases in the trachea and kidneys of IBV-infected chickens. The results showed that in the early phase of infection, both TLR3 and TLR7 transcripts were significantly upregulated in the trachea at 3–8 dpi, but were only upregulated at 5 or 3 dpi in the kidney, respectively. Additionally, MyD88 was significantly upregulated at 1–3 dpi in the trachea. Concurrently, MDA5, LGP2, and STING transcripts were upregulated in the trachea at 1–28 dpi. Since the IBV load was rapidly increased in the trachea during this period, with limited expression in the kidney, the invasion and replication of IBV may result in the generation of massive viral RNA, including ssRNA, dsRNA, and other RNA intermediates, which are recognized by TLR3, TLR7, and MDA5 and lead to activation of various signaling pathways, as previously reported(Kint et al., 2015).
However, contradictory changes in gene expression in the trachea and kidney may be associated with the distinct viral loads at different time points and in different tissues, which depends on the specific IBV strain(Kameka et al., 2014; Xu et al., 2015). Notably, TLR7 and TRIF were significantly upregulated at 21 dpi in both tissues; MAVS was upregulated at 21 dpi; and MDA5, LGP2, and STING were upregulated at 14–28 dpi. Thus, these data provided the first evidence showing that the TLR and MDA5 signaling pathways were involved in the late stage of IBV infection, despite the observation that the viral load was low during this period. Nevertheless, we found that the mRNA and protein levels of type I IFN were upregulated and increased during the same time period; MDA5 is an IFN-stimulated gene(ISG)that can be induced by type I IFN(Sun et al., 2012). Therefore, this mechanism may be involved in the observed changes in gene expression, and further studies are required to elucidate the specific details of such mechanisms.
We found that the downstream genes TRAF6 and TRAF3 were significantly upregulated in both tissues throughout the experiment. This observation could be explained by the fact that these two molecules are common kinases involved in multiple signal pathways(Takeuchi and Akira, 2009). Alternatively, TRAF6 and TRAF3 complexes are inactivated by pathogenic microbes to limit or terminate pro-inflammatory and type I IFN and evade host innate immunity(Shi et al., 2014; Panda et al., 2015). In contrast, the mRNA levels of MAVS, TBK1, IKKԑ, IKKα, IKKβ, IRF7, and NF-κB p65 exhibited more tight regulation in the infected trachea because upregulation of nuclear transcription factors depends on upstream molecules, whereas most genes were significantly downregulated in the kidney. Thus, the different responses and levels of activation of the TLR and MDA5 signal pathways after IBV infection may be related to the threshold of viral loads in the two tissues.
Importantly, changes in type I IFN, inflammatory cytokines, and chemokines in response to IBV infection were observed at both the transcript and protein levels. We observed consistent changes in TLR and MDA5 signaling pathway molecules and these cytokines. Additionally, the mRNA levels of type I IFN, inflammatory cytokines, and chemokines were dramatically elevated during IBV infection in the trachea, similar to the results of previous studies(Jang et al., 2013; Dar et al., 2014; Okino et al., 2014; Kameka et al., 2014). However, further studies are needed to confirm and explain the significant downregulation of these targets, except for IL-1β, IL-8, and MIP-1β, in the kidney. Unexpectedly, we found simultaneous peaks in the expression of all cytokines, the viral load, and the presence of histopathological lesions at 5 dpi in the trachea, suggesting that the antiviral effects of innate immune cytokines may be critical during the early stages of infection. Furthermore, the upregulation of IFN-α, IFN-β, IL-12, and IL-8 also peaked at 21 dpi, despite the clearance of IBV from the trachea at that time point. These results indicated that innate immune cytokines were still under tight regulation during the late stages of IBV infection.
At the protein level, the results in the trachea showed that the kinetics of IFN-α, IFN-β, IL-12, and IL-8 protein were consistent with changes in transcript levels at 3–8 and 14–21 dpi. During the early stages of infection, these cytokines and chemokines were associated with the infiltration of lymphocytes and heterophils in the tracheal tissues. At 8 dpi, increases in IL-1β, IL-6, IL-10, and MIP-1β proteins were delayed with respect to the peaks in mRNA expression and viral replication in the trachea; the most severe damage occurred in the tracheal tissue at this time point, and slight signs of recovery were observed. This observation may be explained by the common induction of cytokines in the former group by the RLR signaling pathway, which primarily contributes to IFN-β induction(Kint et al., 2015). The cytokines in the latter group were only induced by the TLR signaling pathway, indicating that IBV infection may regulate the host inflammatory responses. However, the inconsistent expression levels of mRNAs and proteins in the kidney indicated that complicated regulatory mechanisms may exist; although both mRNA and protein were downregulated during the early stages of infection, and protein levels increased at a later stage of infection, when mRNA was downregulated. This may be explained by systemic regulation in the infected chickens.
In conclusion, we observed considerable activation of the innate immune response in the target tissues after infection with the avian coronavirus IBV M41 strain with respect to the TLR and MDA5 signaling pathways and innate immune cytokines. However, this response differed among tissues, with a general trend toward upregulation in the trachea and downregulation in the kidney. In addition, we found consistent responses for changes in TLR and MDA5 signaling pathway molecules, innate immune cytokines, and histopathology during the early stages of infection; however, complicated regulatory mechanisms may be present, particularly in the kidney. To the best of our knowledge, our results provide the most comprehensive analysis of the interplay between a Gammacoronavirus and the avian TLR and MDA5 signaling pathway response. Since most of these receptors and signal molecules are activated by post-translational modification, such as ubiquitination, phosphorylation, to recognize virus and transmit signal, more research should be done to evaluate the activity and effect of TLR and MDA5 signaling pathway at the protein level.
-
This work was supported by grants from the Natural Science Foundation of China(31360611 and 31160516) and Guangxi Natural Science Foundation(2013GXNSFCA019010 and 2014GXNSFDA118011).
-
The authors declare that they have no conflicts of interest. The research involving animals in this study was approved by the Institute of Animal Science and Technology of Guangxi University Animal Ethics Committee and was performed in accordance with relevant national and international guidelines.
-
YH, MM, and PW designed the experiments and revised the manuscript; YH, ZX, JH, YZ, and YC established the st and ard curve; YH and ZX performed viral infections and all experimental tests and data analyses; JD performed the histopathology analyses; TW performed viral infections; and YH wrote the manuscript. All authors read and approved the final manuscript.

 DownLoad: