


HTML
-
Baculoviruses have been used as biocontrol agents against agricultural and forest insect pests and have also been exploited in therapeutic strategies and protein expression (Miller et al. 1997). They belong to the family Baculoviridae, which is composed of four genera namely, Alphabaculovirus, Betabaculovirus, Gammabaculovirus and Deltabaculovirus (Miele et al. 2011). Lepidopteran baculoviruses produce two morphotypes following infection; the occlusion derived virus (ODV) and the budded virus (BV) (Slack and Arif 2007). ODVs are occluded in a proteinic matrix called the occlusion body (OB), which afford the virions a certain amount of protection against inactivating agents in the environment such as heat and desiccation. Typically, the life cycle of baculoviruses is initiated upon ingestion of OB that dissolve in the alkaline environment of the midgut releasing contained virions. ODVs then bind to and enter the epithelial cells and initiate the virus replication processes. BVs are released from the host cell plasma membrane, penetrate the basal lamina to gain access to the tracheal system and start to spread throughout the larva. They replicate in permissive cells, tissues and organs, thus initiating a systemic infection. ODVs on the other hand, accumulate intracellularly and become embedded in proteinaceous matrix such as polyhedrin or granulin. ODV attachment and binding to midgut columnar epithelial cells is facilitated by ODV membrane resident proteins also knowns as per os infectivity factors (PIFs) that permit subsequent entry of virus nucleocapsid into the cytosol (Slack and Arif 2007).
There are, presently, 10 known PIFs; P74 (also called PIF0) (Kuzio et al. 1989), PIF1 (Kikhno et al. 2002), PIF2 (Pijlman et al. 2003), PIF3 (Ohkawa et al. 2005), PIF4 (Fang et al. 2009), PIF5 (Braunagel et al. 1996), PIF6 (Nie et al. 2012), PIF7 (Jiantao et al. 2016), PIF8 (Javed et al. 2017; Perera et al. 2007) and PIF9 (Simon et al. 2012). Protein interactions using yeast-2-hybrid system identified interactions between PIF2 and PIF3 (Peng et al. 2010a; b). Additionally, PIF1, 2 and 3 have been more recently shown to directly interact with each other using a combination of yeast 2-hybrid screening and bimolecular fluorescence complementation (BiFC) assay (Zheng et al. 2017). At least five PIFs; P74, PIF1, 2, 3, 4 are involved in formation of a 480 kDa complex (Peng et al. 2010a). Three PIFs; P74, PIF1, 2 have binding properties and are possible candidates for defining, at least in part, baculovirus host specificities (Ohkawa et al. 2005). PIF1, and PIF2 have been verified by immunogold electron microscopy to be spatially distributed on the membrane of the virion (Peng et al. 2010a). Deletion of any of these PIF results in the loss of oral infectivity. However, BVs that carry the PIF deletion mutations still maintain their infectivity in insect cell lines and in larvae when injected into the hemolymph.
Previously, our laboratory used Helicoverpa armigera nucleopolyhedrovirus (HearNPV), and its permissive host H. armigera as the virus/host model to study the host specificities of PIFs. HearNPV was pseudotyped with PIF0-3 from Autographa californica multiple nucleoplyhedrovirus (AcMNPV) or Spodoptera litura nucleopolyhedrovirus (SpltNPV) and tested for per oral infectivity to H. armigera. Both AcMNPV and SpltNPV are non-infectious to H. armigera. Out of the eight pseudotyped viruses, all, except SpltNPV pif3 substituted virus, completely lost oral infectivity, suggesting PIFs are host specific (Song et al. 2016). Here we conducted a similar study but using PIFs from Mamestra bracissae multiple nucleopolyhedrovirus virus (MabrNPV), a virus which is naturally infectious to H. armigera (Doyle et al. 1990). Essentially, we constructed three recombinant (HearNPV) viruses pseudotyped either PIF1, PIF2 or PIF3 from MabrNPV. To our surprise, pseudotyped viruses with PIF1 or PIF2 from MabrNPV were not orally infective and only PIF3 substitution partially retained oral infectivity. We further demonstrated that the reason for different oral infectivity is that PIF complex was formed in the pif3 substituted virus but not in the pif1 or pif2 substituted viruses.
-
The H. zea ovarian cell line HzAM1 (McIntosh and Grasela 1994) was maintained at 28 ℃ in Grace's medium (Gibco-BRL) enriched with 10% fetal bovine serum. H. armigera larvae were raised on an artificial diet at 27 ℃. The bacmids, HaBacΔpif1-ph, HaBacΔpif2-ph and HaBacΔpif3-ph (ph stands for polyhedrin gene), constructed previously (Song et al. 2008), were used as the platform to construct pseudotyped viruses. An infectious HearNPV bacmid HaBacHZ8 (Wang et al. 2003), as well as a positive control virus HaBac-egfp-ph, were previously constructed in our laboratory (Song et al. 2008). HearNPVG4 and MabrNPV-CTa strains were maintained as laboratory stocks.
-
A schematic representation of the constructs is depicted in Fig. 1, the promoter regions (~ 200 bp 5' upstream) of Hapif1, Hapif2 or Hapif3 open reading frames were amplified from genomic DNA of HearNPV-G4 by specific primers (Supplementary Table S1). The PCR products were first cloned into the transfer vector pFB-DUAL-ph (Song et al. 2008) and the verified vectors were designated pFB-DUAL-pHapif(s)-ph. The coding sequences of pif1, pif2 or pif3 of MabrNPV were amplified from genomic DNA of MabrNPV-CTa by specific primers (Supplementary Table S1). A FLAG tag coding sequence (GACTACAAGGACGACGATGACAAG) was added to the 30 end of each MabrNPV pifs during amplification to facilitate protein detection. The resulting amplicons were cloned into the transfer vector pFB-DUAL-pHapif(s)-ph and authenticated by restriction enzyme digestion and sequencing. The transfer vectors were designated pFB-DUAL-pHapif(s)-Mbpif(s)-ph. Transposition into the respective pif-deleted HearNPV bacmids was carried out as outlined in the Bacto-Bac manual (Bac-to-Bac®Baculovirus expression System; InvitrogenTM Life Technologies, Carlsbad, USA). The constructed bacmids were examined by PCR and labelled as HaBacΔpif1-Mbpif1, HaBacΔpif2-Mbpif2 and HaBacΔpif3-Mbpif3.

Table Supplementary Table S1. Primers used in this study
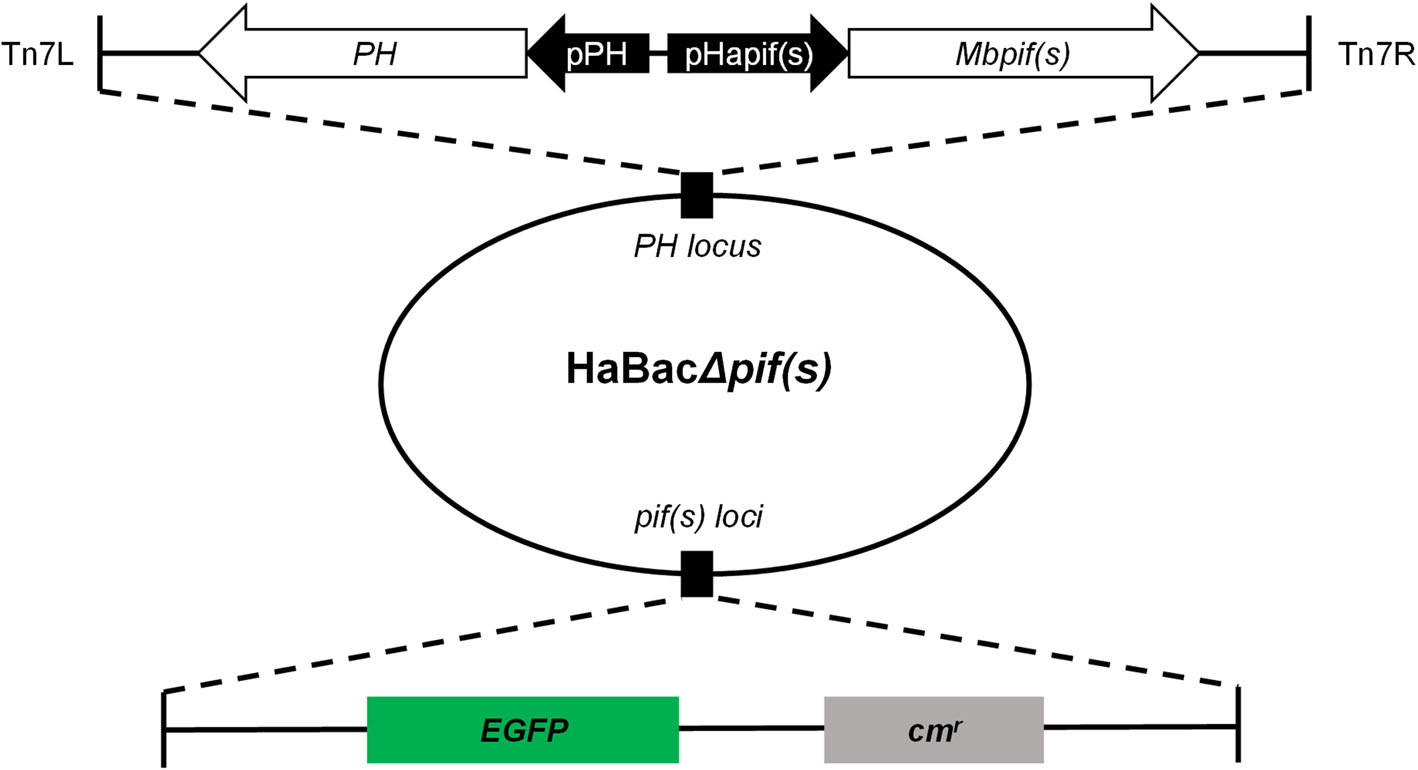
Figure 1. Construction and identification of recombinant pif-replaced HearNPV bacmids. EGFP and chloramphenicol resistance coding sequences were inserted within pif loci. Hapif promoters and mbpif coding regions were respectively sequentially inserted in conjunction with ph coding region into the ph locus within the HaBacΔpifs bacmid. Upon examination and identification of the constructed bacmids, they were labelled as HaBacΔpif1-Mbpif1, HaBacΔpif2-Mbpif2 and HaBacΔpif3-Mbpif3.
-
To produce the recombinant viruses, HzAM1 cells were seeded into tissue culture dishes at a density of 1 × 10⁶ cells per dish. Transfection was performed with 0.3 μg recombinant bacmid DNA using 10 μL lipofectin (Invitrogen). Fluorescent microscopy was used to determine transfection efficiency at 96 h post transfection (h.p.t). Supernatants with progeny viruses were clarified at 860 × g at 4 ℃ and used to infect a fresh batch of HzAM1 cells. The titers of the viruses were determined by end-point dilution assays (EPDAs).
-
Single step growth curves were determined when HzAM1 cells were infected with viruses at 5 multiplicity of infection (MOI, in TCID50 units/cell), and supernatants were collected at 0, 24, 48, 72 and 96 h post infection (h.p.i.) for EPDA. The assays were done in triplicates. Average titers for the time points, 24, 48, 72 and 96 h.p.i., for each virus were plotted in Graphpad Prism 5 and statistically analysed by IBM SSPS version 20. To determine replication in larvae, systemic larval infection was initiated by administering BVs into the haemolymph of late third-instar H. armigera larvae as described previously (Song et al. 2008). A 10 μL aliquot containing BVs adjusted to 5 × 10⁶ TCID50 units/mL was injected intrahaemocoelically. At 96 h.p.i., the hemolymph, tracheal, midgut lumen, fat body and malphigian tubular tissues were extracted by dissection of injected larvae. These larval tissues were then examined by fluorescent microscopy. Grace's medium was used as a negative control and 120 larvae were used for each recombinant virus.
-
Larval cadavers containing recombinant virus OBs were homogenised in 0.5% SDS (1 mL per cadaver) and filtered through a double layer of cotton cheese cloth to remove large debris. The filtrate was centrifuged at 50× g for 5 min at 4 ℃ to remove further debris and the OBs in the supernatant fluid were pelleted at 3000× g for 5 min at 4 ℃. The pellet was washed three times with 0.1% SDS by centrifugation and finally the pellet was resuspended in deionised distilled water (ddH2O) and counted on a haemocytometer. For scanning electron microscopy (SEM), 10 μL OB suspension of recombinant HearNPVs or control virus HaBac-egfp-ph at 1 × 10⁷ OBs/mL were dropped on an aluminium foil, left to dry at room temperature and prepared for imaging by gold spray. SEM micrographs were taken using a 100 kV Hitachi H-7000FA microscope. In transmission electron microscopy (TEM), 1 mL of OB was fixed with formaldehyde and prepared for imaging as described previously (Song et al. 2008) using a 200 kV FEI Tecnai G220 TWIN microscope.
-
HzAM1 cells were infected with HaBac-egfp-ph, HaBacΔpif1-Mbpif1, HaBacΔpif2-Mbpif2 and HaBacD pif3-Mbpif3 viruses at an MOI of 5 then harvested at 72 h post infection (h.p.i.) and centrifuged at 3000× g for 5 min at 4 ℃. To detect HaPIFs, infected cell pellets were resuspended in Laemmli sample buffer, heated in boiling water for 10 min and centrifuged at 10, 000× g for 1 min. To detect FLAG tagged MbPIFs, OBs were extracted from infected cells at 6 days post infection. The OBs were dissolved in DAS solution (0.1 mol/L Na2CO3, 166 mmol/L NaCl and 10 mmol/L EDTA, pH 10.5). An equal volume of 2 9 Laemmli sample buffer was added to the dissolved OB solution and heated in boiling water for 10 min and centrifuged at 10, 000× g for 1 min. Denatured protein samples were separated on 12% SDS-PAGE and analyzed by Western blots. Rabbit anti-HaPIFs-specific polyclonal antiserum (Song et al. 2008) and mouse anti-FLAG monoclonal antibodies (Invitrogen) were used as the primary antibodies to detect HaPIFs and MbPIFs, respectively. Horseradish peroxidase-conjugated goat anti-rabbit and anti-mouse immunoglobulins (Sigma Aldrich, St Louis, USA) were used as secondary antibodies. The final signal was generated by exposure to a chemiluminescent substrate kit (Super SignalTM West Pico Chemiluminescent substrate; Thermo Scientific, Rockford, USA) and detected by DNR Imaging System (Microchemi 2.0).
-
Oral infectivity of the recombinant viruses on third instar larvae was determined by droplet method as previously described (Song et al. 2008) with 10 μL of virus suspended in ddH2O adjusted to 3 × 10⁸ OBs/mL (Sparks et al. 2008). Larvae were examined daily until they either died or pupated. The feeding assay was repeated twice. Since only HaBacΔpif3-Mbpif3 retained a certain level of oral infectivity, OBs of HaBacΔpif3-Mbpif3 were harvested and purified and used to conduct a bioassay at the following virus concentrations: 1 × 10⁶, 3 × 10⁶, 1 × 10⁷, 3 × 10⁷ and 1 × 10⁸ OBs/mL. OBs of HaBac-egfp-ph were also used as a control at concentrations of 1 × 10³, 3 × 10³, 1 × 10⁴, 3 × 10⁴ and 1 × 10⁵ OBs/mL. In all the above assays, individual larvae were added to one well of 24-well plates. At least 48 larvae in both assays were used per virus concentration and only larvae that had consumed all the virus contaminated food were considered for survival or death count.
-
The presence and absence of PIF complex of the recombinant viruses were detected by differentially denaturing SDS-PAGE and Western blot according to (Peng et al. 2010a) with slight modifications. Briefly, HaBac-egfp-ph, HaBacΔpif1-Mbpif1, HaBacΔpif2-Mbpif2 and HaBacD pif3-Mbpif3, were each used to infect 1 × 10⁸ HzAM1 cells at 5 MOI and their OBs were extracted from infected cells at 7 d.p.i.. ODVs were released from the OBs by treatment with DAS solution (0.1 mol/L Na2CO3, 166 mmol/L NaCl and 10 mmol/LEDTA, pH 10.5), and centrifuged at 20, 000× g for 30 min at 4 ℃. The ODV containing pellet was resuspended in Laemmli buffer and heat treated either at 50 or 95 ℃ for 5 min prior to loading to SDS-PAGE gel and Western blot analyses. Total ODVs extracted from 1 × 10⁷ OBs were loaded to each lane of the PAGE gel.
Insects, Cells and Viruses
Construction of Pifs-Replaced HearNPV Bacmids
Transfection and Infection
Virus Growth in Cell Culture and Larvae
Electron Microscopy (EM)
Western Blot Analyses of Recombinant Viruses
Feeding Assays
Detection of PIF Complex
-
HearNPV bacmids with pif deletions and carrying egfp marker (Song et al. 2008) were used as templates to insert MabrNPV pif homologs. In addition, 200 bp promoter regions of HearNPV pifs were inserted to control the expression of the MabrNPV pif homologs (Fig. 1). The recombinant HearNPV bacmids were identified and confirmed by PCR (data not shown) and used to transfect HzAM1 cells. At 96 h.p.t., green fluorescence was observed in transfected cells indicating successful transfection (Fig. 2, upper panel). Progeny virus was harvested from transfected HzAM1 cells and used to infect new batches of cells. Green fluorescence was observed in most infected cells indicating production of infectious progeny viruses from all recombinant HearNPVs (Fig. 2, lower panel).
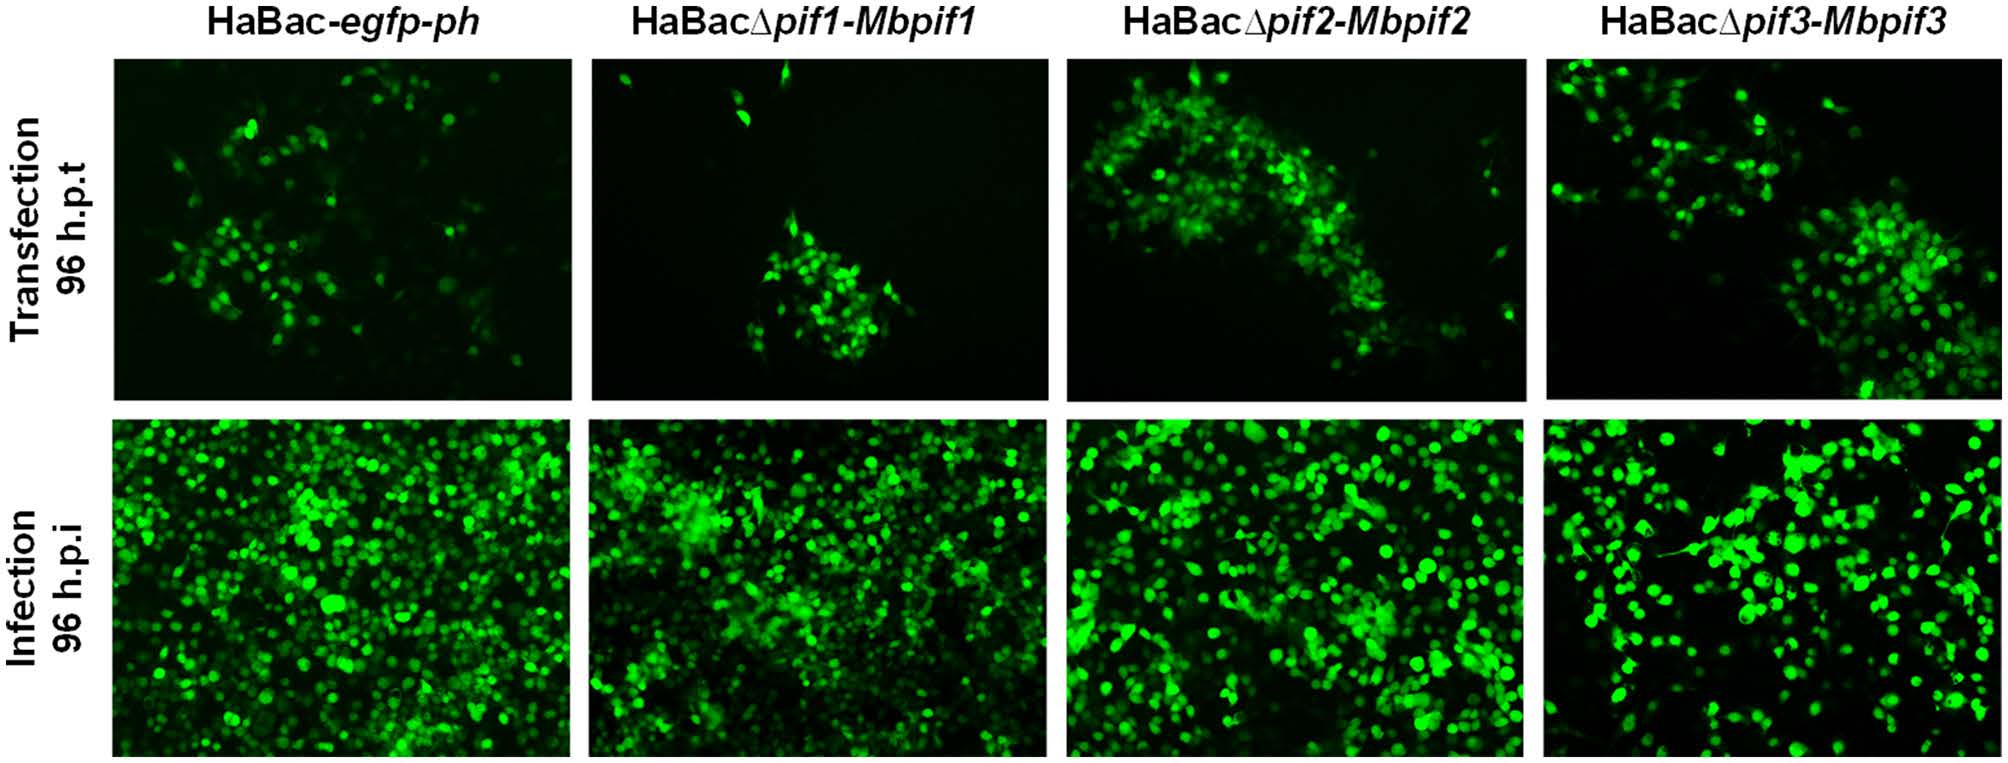
Figure 2. Transfection and infection assay of recombinant viruses. Images with black background are green fluorescent micrographs of infected HzAM1 cells, all at ×10 magnification. Fluorescence detection of virus infected cells was enabled by expression of EGFP from the pif-replaced recombinant HearNPV bacmids. Supernatants with progeny viruses produced from transfected cells (upper panel) were used to infect a fresh batch of HzAM1 cells (lower panel).
To further determine if the substitution of MabrNPV pifs has any impact on BV production, single-step growth curves of the recombinant viruses were conducted. The results showed that all recombinant viruses replicated with similar kinetics to that of the control virus HaBac-egfp-ph (Fig. 3). Statistical analyses showed that the virus titres of HaBacD pif1-Mbpif1, HaBacΔpif2-Mbpif2 and HaBacΔpif3-Mbpif3 were not significantly different from that of HaBac-egfp-ph at most time points. These results indicate that the substitution of MabrNPV PIFs do not affect BV production in vitro.
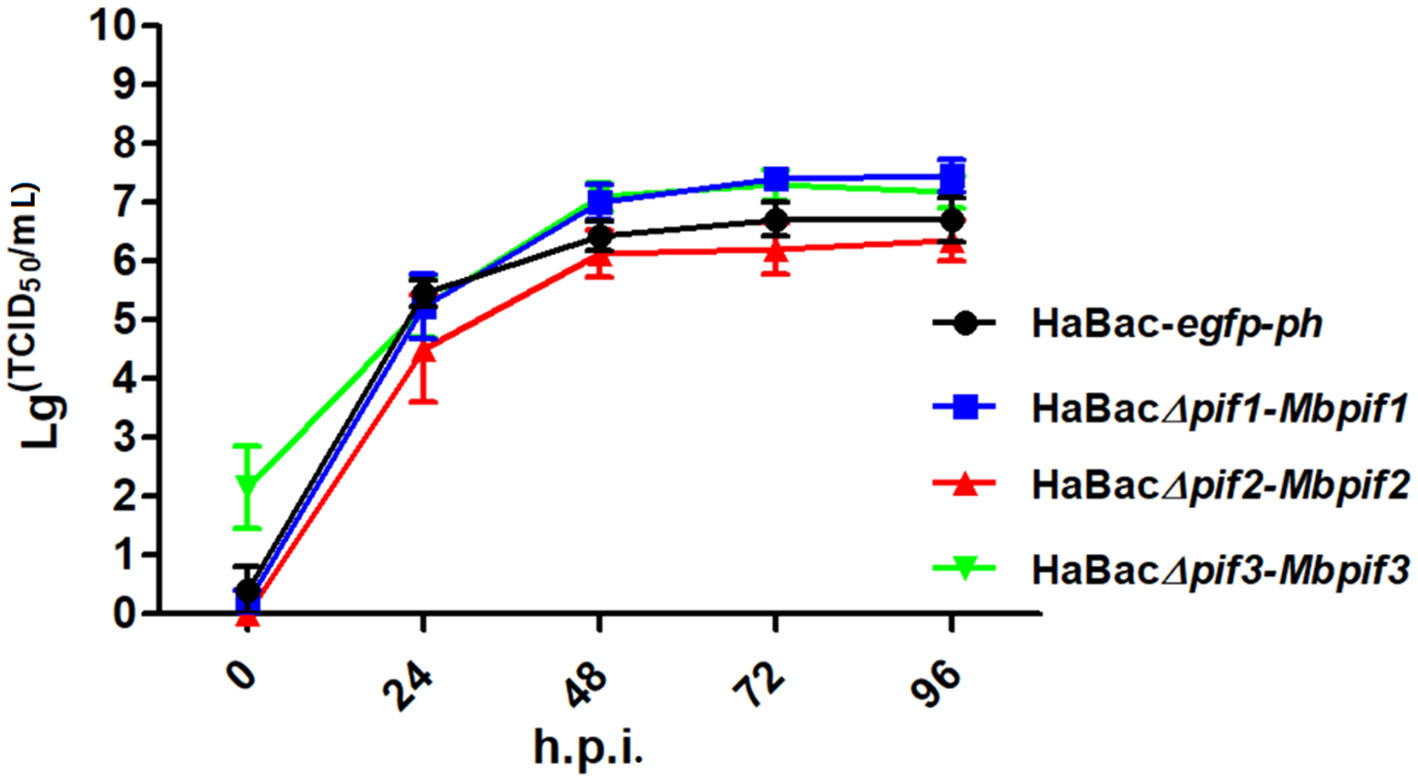
Figure 3. Single-step growth curves of recombinant HearNPVs in HzAM1 cells. HzAM1 cells were infected with recombinant HearNPV BVs at an MOI of 5 TCID50/cell. The supernatants were harvested at different times post infection and the titers (TCID50) were determined by end-point dilution assay. Each data point represents the average from three independent infections, and error bars represent the standard deviations. Statistical analyses were carried out using SPSS 20 statistical software.
-
Cells infected with pseudotyped viruses, HaBacΔpif1-Mbpif1, HaBacΔpif2-Mbpif2andHaBacΔpif3-Mbpif3, were confirmed not to synthesize the replaced HaPIFs (Fig. 4A) by Western blot analyses using antibodies against HaPIFs (Song et al. 2008). Anti-FLAG antiserum was used to detect MbPIFs in OBs from cells infected with the pseudotyped viruses. Bands with sizes corresponding to the respective MabrNPV PIFs were detected: MbPIF1 (~ 61 kDa), MbPIF2(~ 48 kDa) andMbPIF3(~ 23 kDa)(Fig. 4B).In the sample of HaBacΔpif1-Mbpif1, bands of ~ 100, ~ 55 and ~ 50 kDa were also detected, which may due to the cross reaction of the antibody, or the degradation and aggregation of PIF1. The Western blot results confirmed successful construction of the pseudotyped HearNPVs.
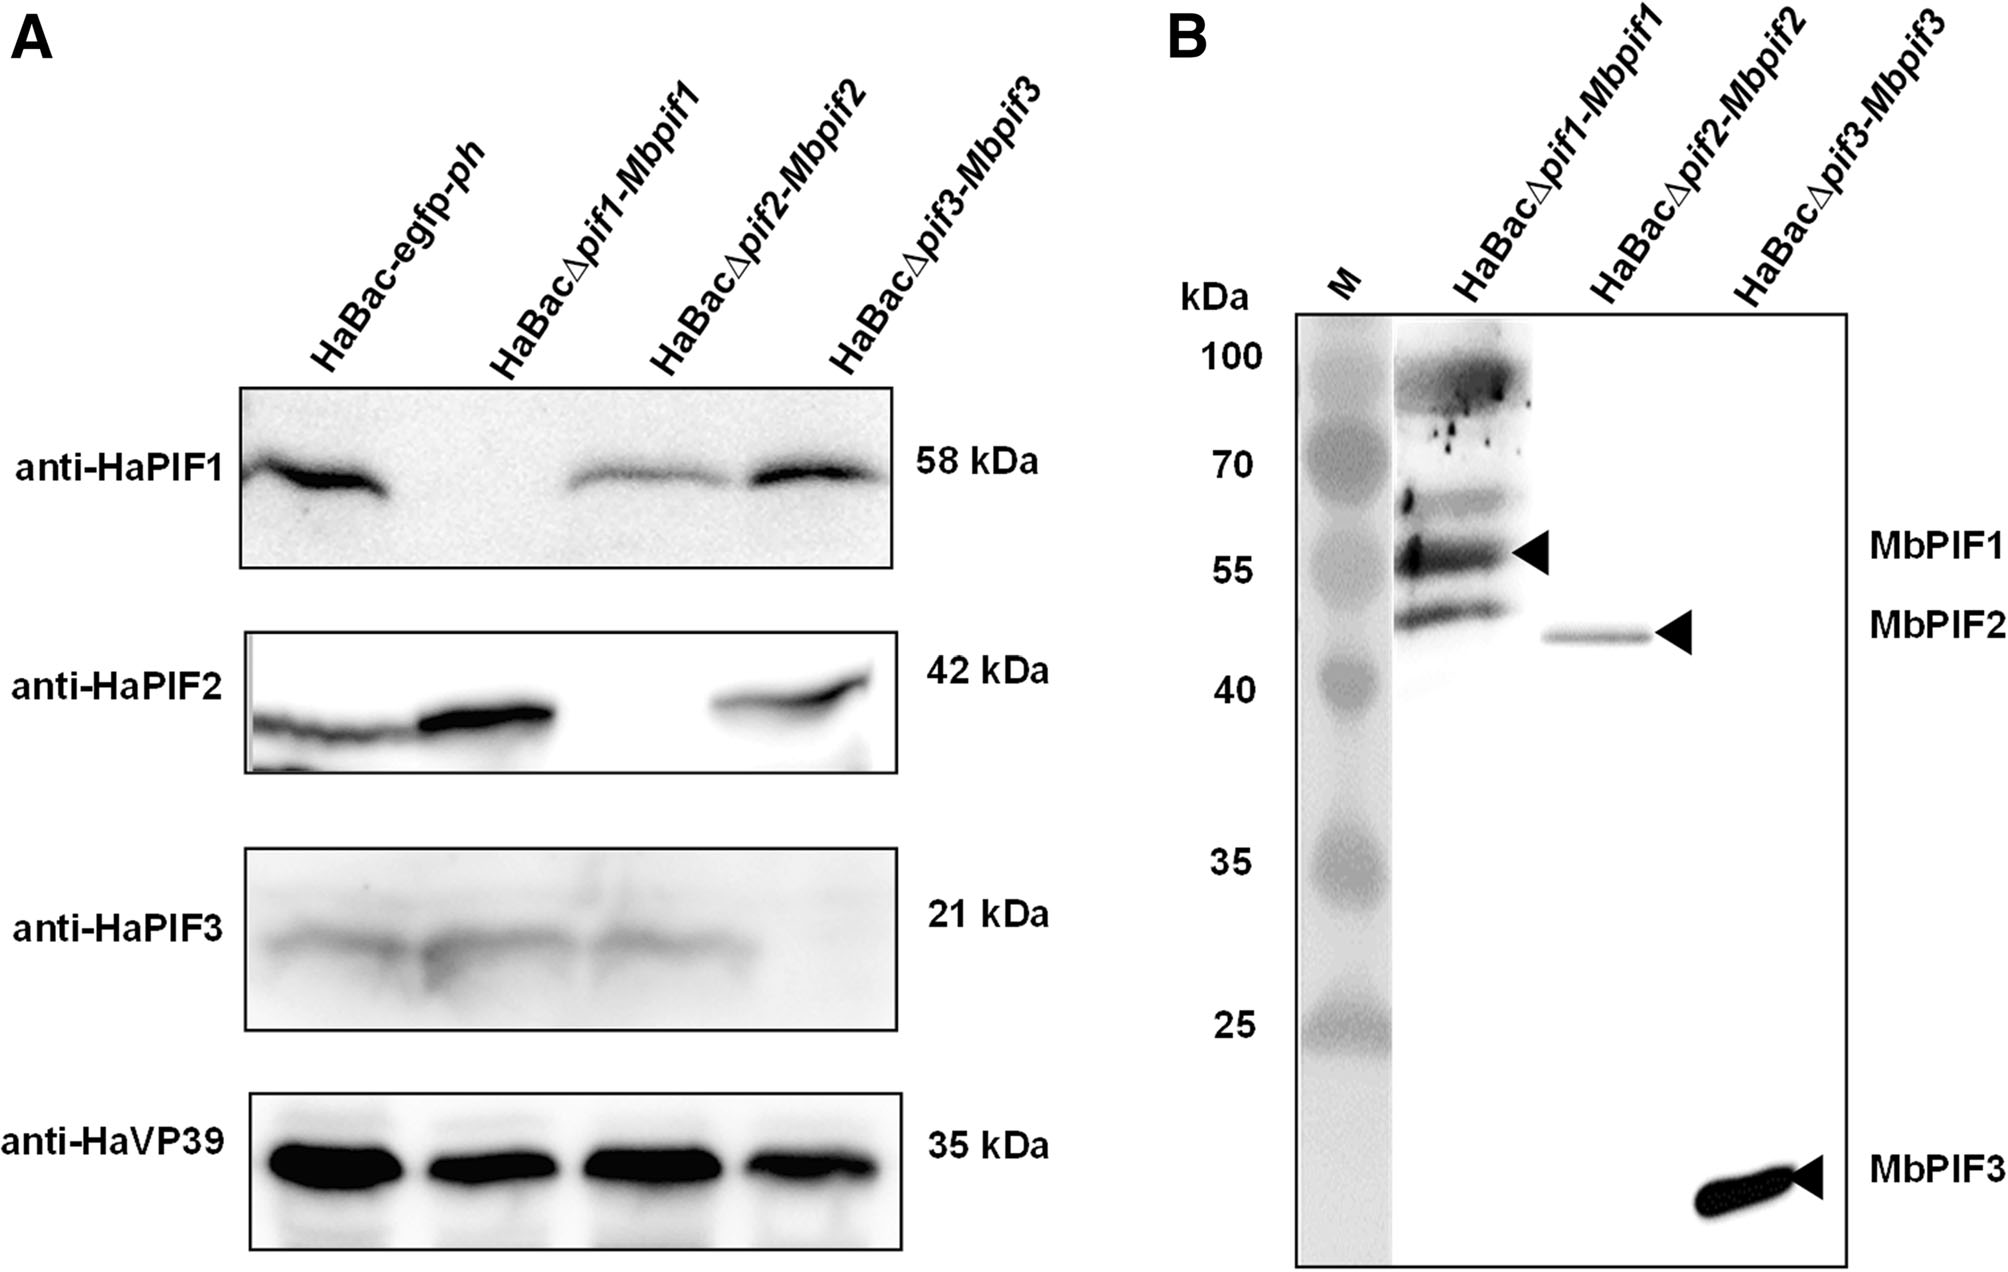
Figure 4. Expression of HaPIFs and MbPIFs in infected cells. Recombinant viruses; vHaBac-WT-egfp-ph, vHaBacΔpif1-Mbpif1, vHaBacΔpif2-Mbpif2 and vHaBacΔpif3-Mbpif3 were used to infect HzAM1 cells, and the cells were collected at 72 h.p.i. for Western blots analysis. A Primary antibodies, anti-HaPIF1, anti-HaPIF2, antiHaPIF3 and anti-HaVP39 polyclonal antibodies were used to verify HearNPV PIFs knock-outs. B Anti-FLAG monoclonal antibody was used to identify the expression of MbPIFs. Black arrow heads indicate bands of MbPIFs at expected sizes.
-
To determine systemic infectivity by pseudotyped viruses, aliquot of 10 μL of 5 × 10⁶ TCID50 units/mL of each pseudotyped viruses was injected into the hemolymph of late third instar H. armigera larvae. At 96 h post infection, green fluorescence was observed in the hemocytes, trachea, fatbody, midgut lumen and malphigian tubular tissues of all the recombinant viruses infected larvae indicating successful systemic infection (Fig. 5). Of all the cells and organs tested, the haemocytes showed the least amount of infection. All test larvae died within 10 days post infection (data not shown).
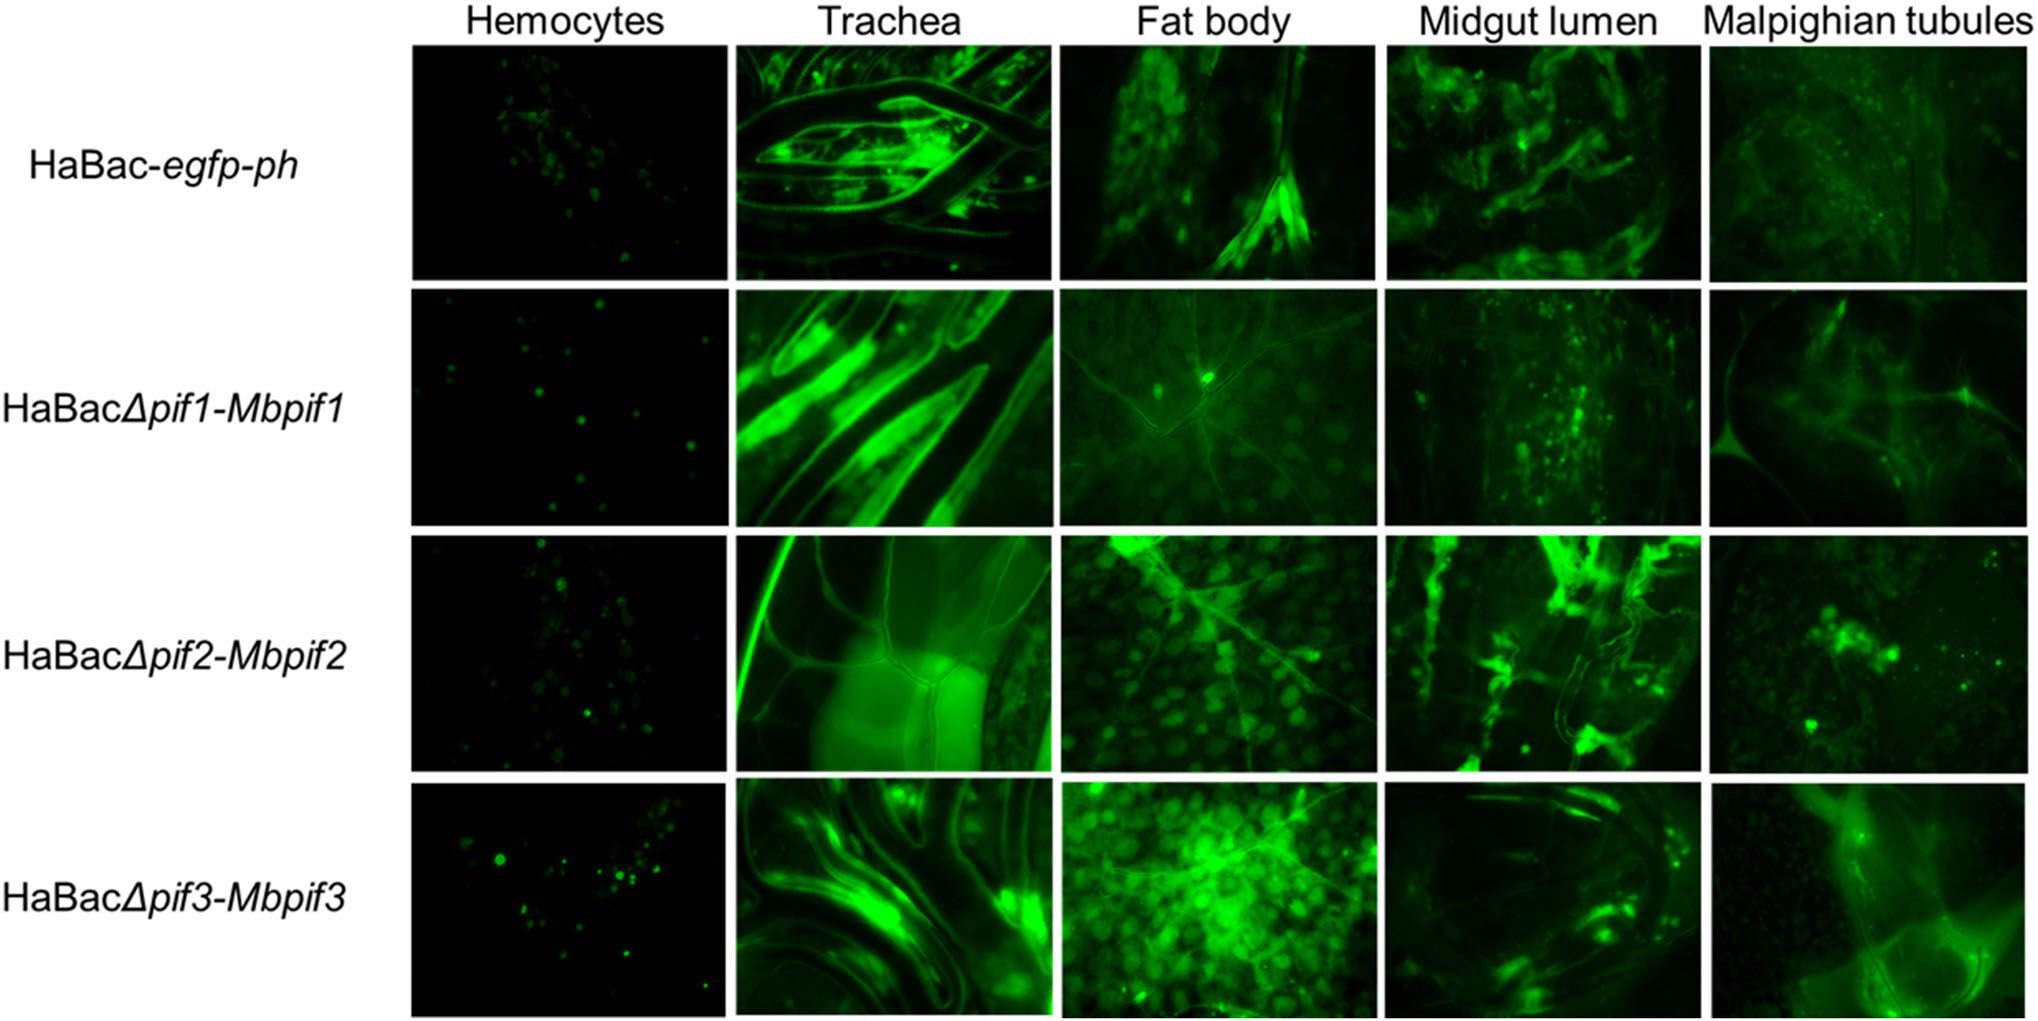
Figure 5. Systemic infection of H. armigera larvae with recombinant HearNPVs. Green fluorescent micrographs of infected larval tissues of 4th instar larvae at 96 h.p.i., were produced under ×200 magnification. The infected larval tissues were dissected out and EGFP from the pif-replaced recombinant HearNPV bacmids was observed by fluorescent microscopy.
-
OBs from dead larvae were extracted, purified, quantified and examined by electron microscopy. SEM showed that the OBs of the pseudotyped viruses were with smooth surface and similar size to those of the control virus (Fig. 6, upper panel). TEM further showed that all the OBs contained an electron dense polyhedron envelope, and contain singly enveloped virions (Fig. 6, lower panel). Therefore, all pseudotyped viruses showed normal OB and ODV morphologies.
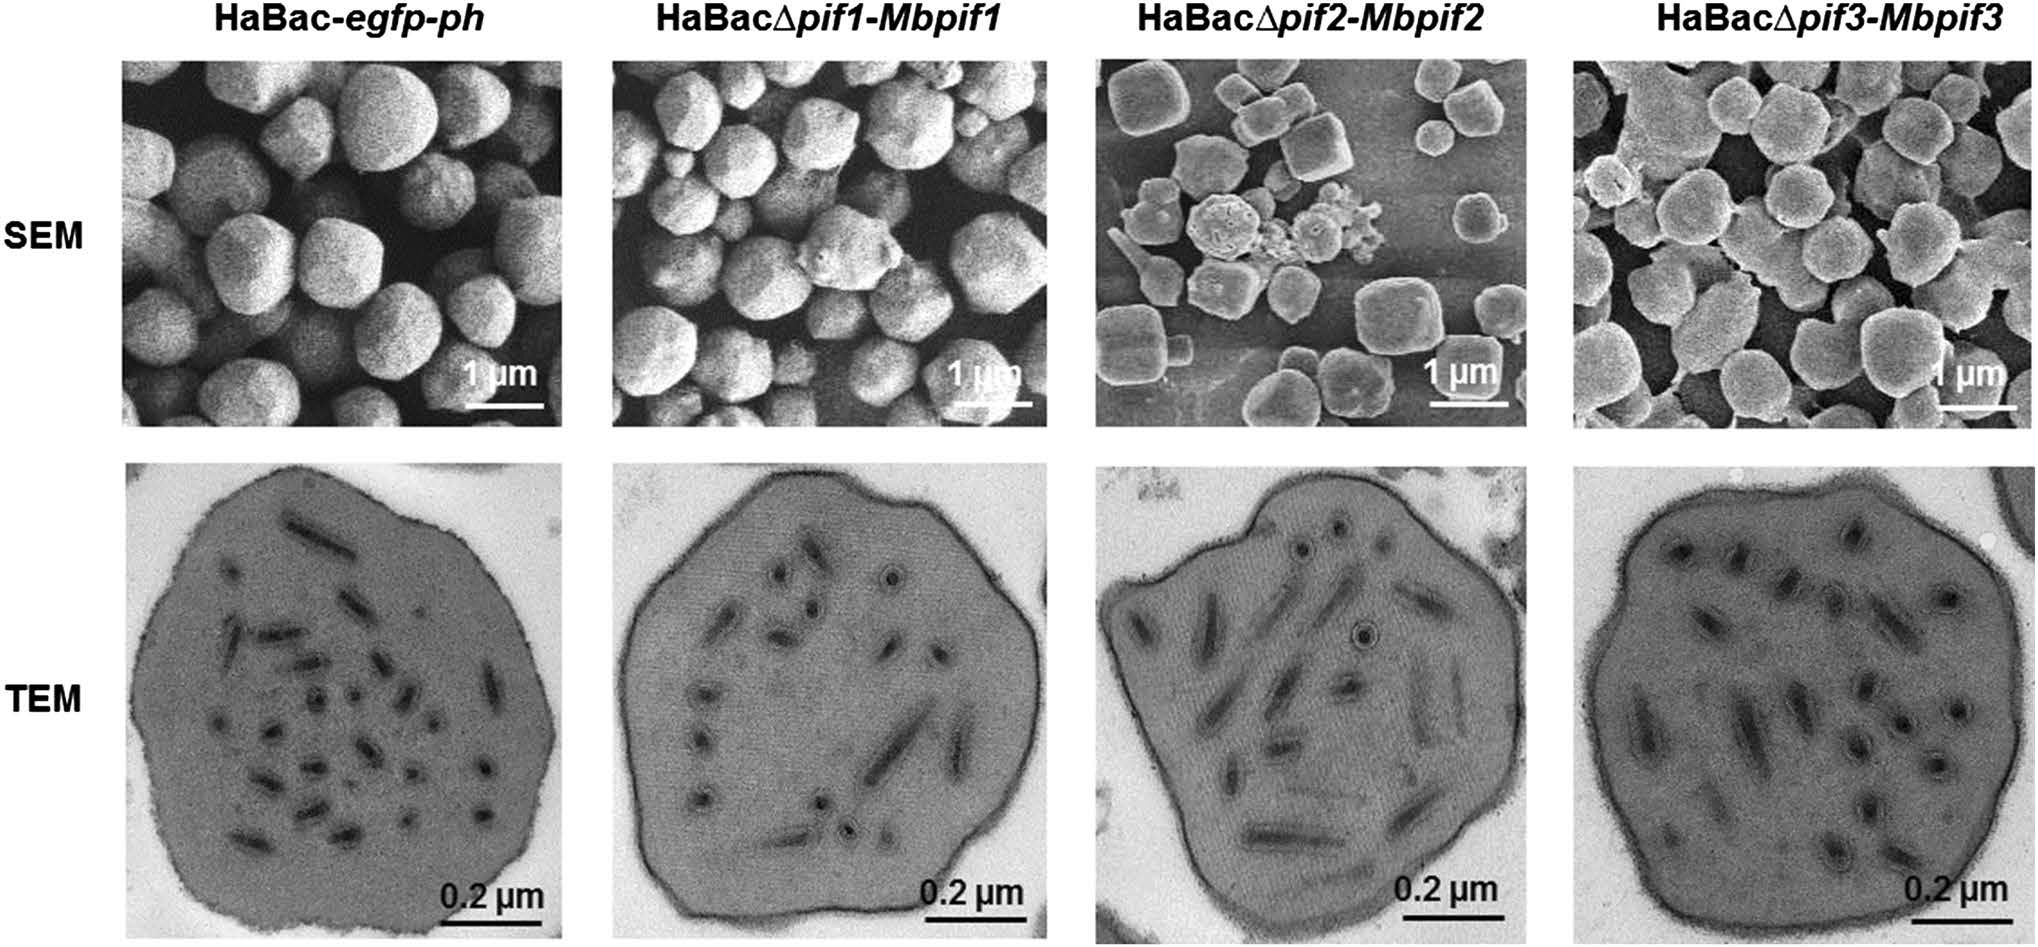
Figure 6. EM analyses of OBs from wild-type and recombinant HearNPVs. OBs from larvae infected with HearNPV-G4 and PIF-replaced recombinant HearNPVs were extracted and purified. SEM was conducted with a Tecnai electron microscope operated at 200 kV and bars stand for 1 μm (upper panel). TEM was conducted with a 200 kV FEI Tecnai G220 TWIN microscope and the bars represent 200 nm (lower panel).
Feeding assays were performed with a very high dose (3 × 10⁸ OBs/mL) of pseudotyped viruses. The results showed that HaBacΔpif1-Mbpif1 and HaBacΔpif2-Mbpif2 completely lost their oral infectivity and the test larvae were not affected by the high viral dose (Table 1). Only HaBacΔpif3-Mbpif3 was partially infective causing mortality in about 50% of the infected larvae. The control virus, HaBac-egfp-ph, caused 100% mortality with the same dose (Table 1).

Table 1. Results of feeding assays with pseudotyped viruses in the 3rd instar H. armigera.
To determine the mean lethal concentration (LC50) of HaBacΔpif3-Mbpif3, bioassay was conducted with concentrations of 1 × 10⁸, 3 × 10⁷, 1 × 10⁷, 3 × 10⁶ and 1 × 10⁶ OBs/mL for HaBacΔpif3-Mbpif3, which were 1000 times higher than those of the control virus (Table 2). HaBacΔpif3-Mbpif3 caused some mortality at the higher doses of 3 × 10⁷ and 1 × 10⁸ OB/mL but the rates were too low to determine an LC50 (Table 2). In contrast, the control virus, HaBac-egfp-ph caused mortality (Table 2) with an LC50 of 5.7 × 10³ OB/mL.

Table 2. Bioassay results of HaBac-egfp-ph and HaBacΔpif3-Mbpif3 in 3rd instar H. armigera.
-
To determine if PIF complex exists in the pseudotyped viruses, ODVs from all three viruses were suspended in Laemmli buffer and heated at either 50 or 95 ℃ and analyzed by PAGE. Western blots with anti-HaPIF1 or antiHaVP91 antibodies showed the control virus, HaBac-egfp-ph had a PIF complex at ~ 170 kDa when heated to 50 ℃ (Fig. 7, red arrow heads). It is interesting that VP91, which is the most recently described member (PIF8, Javed et al. 2017) of the PIF family, appears to be a member of the complex. The band (Fig. 7, white arrow heads), detected with anti-HaPIF1, demonstrates that HaBacΔpif3-Mbpif3 can form a complex, but HaBacΔpif2-Mbpif2 does not (Fig. 7, left panel). Since HaBacΔpif1-Mbpif1 does not contain HaPIF1, anti-HaPIF2 and anti-VP91were used to detect PIF complex. The data showed that HaBacΔpif1-Mbpif1 also did not form a PIF complex (Fig. 7, right panel). ODV tegument protein GP41 was used as a loading control. The results indicated that substitution of MabrNPV PIF1 or PIF2 impaired the assembly of PIF complex, while MbPIF3 interacted with other PIFs of HearNPV to form the complex. These data further corroborate the bioassay results that only HaBacΔpif3-Mbpif3 retained oral infectivity.
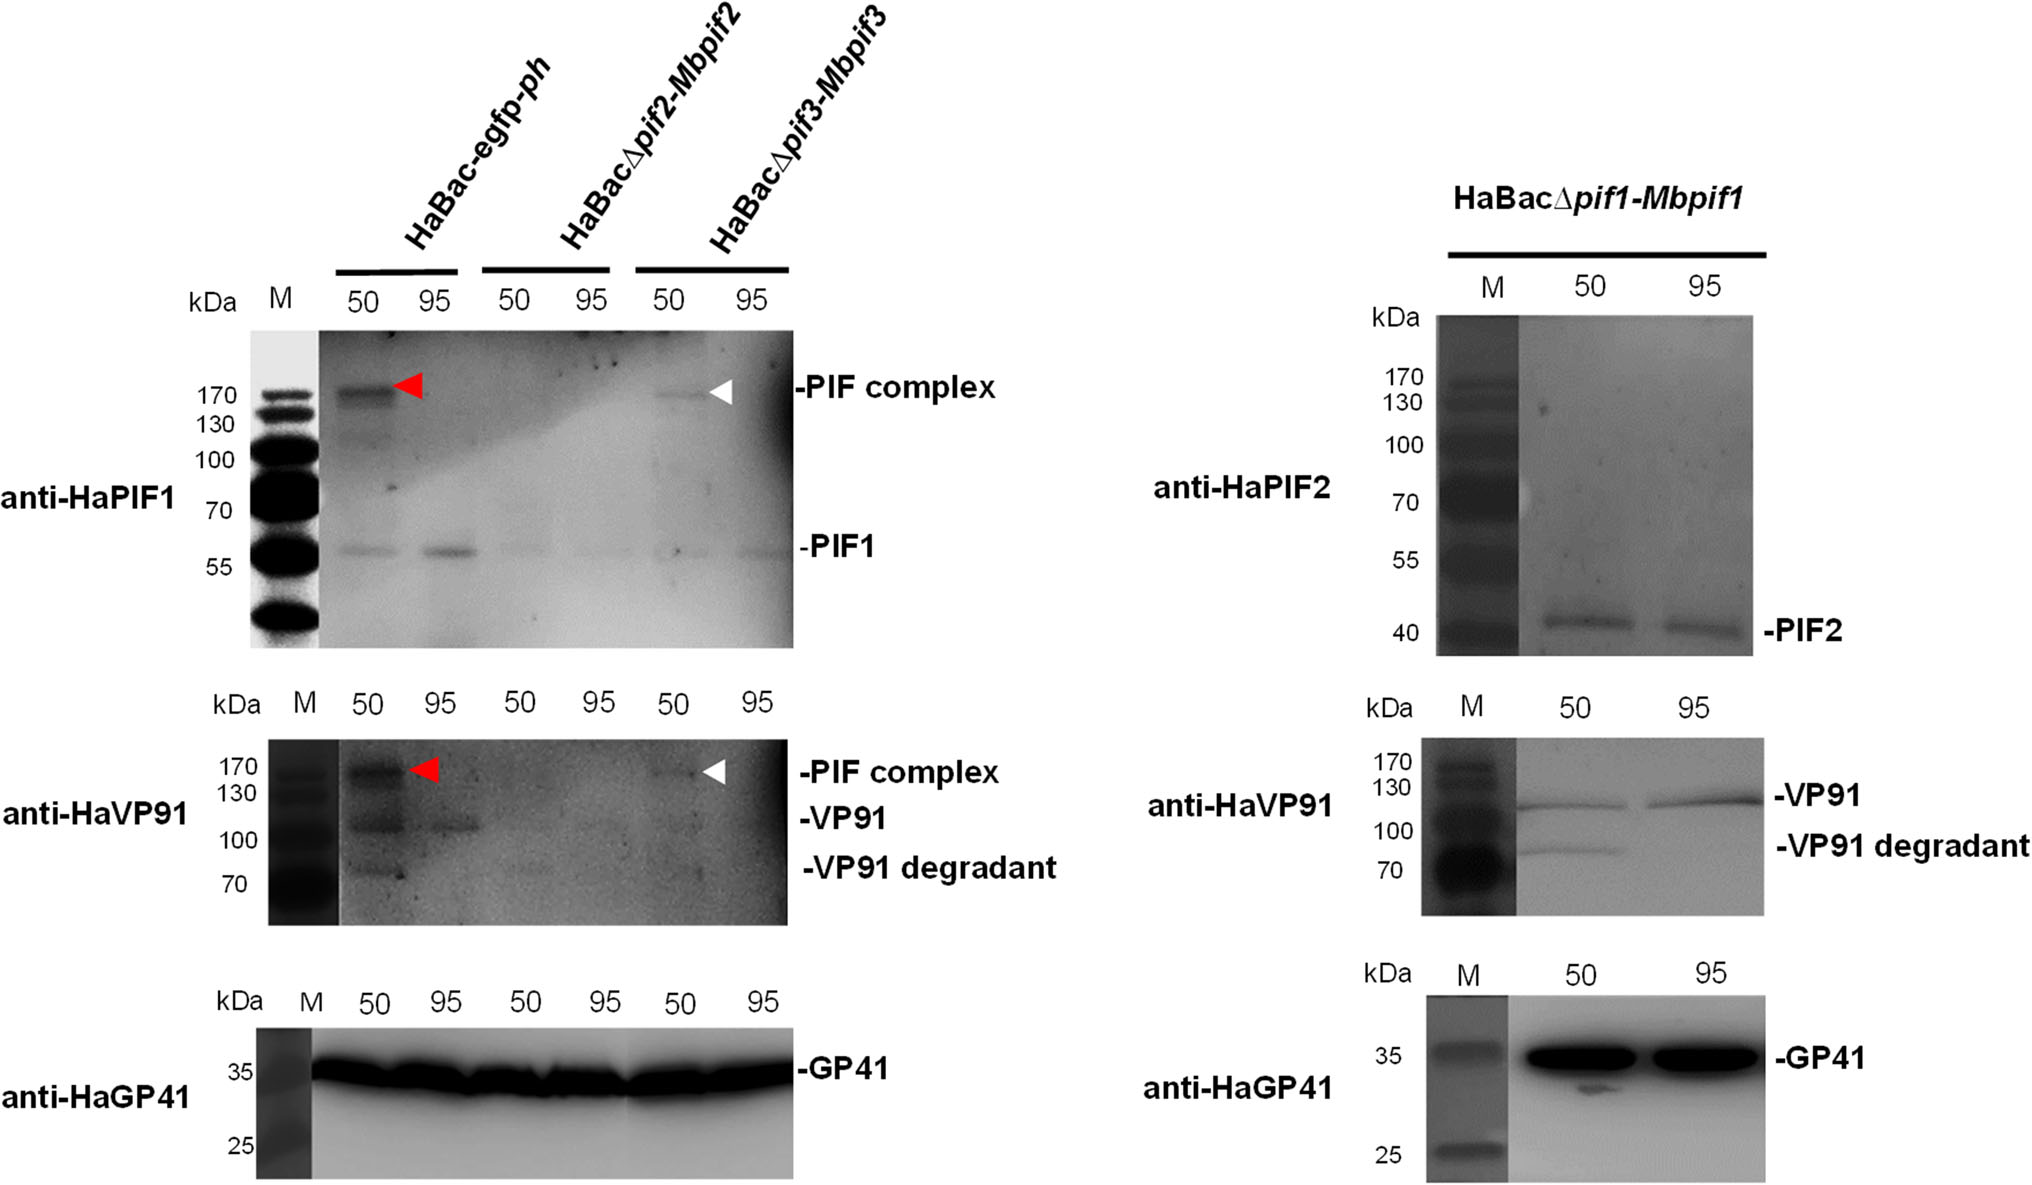
Figure 7. Detection of PIF complex in recombinant HearNPVs. OBs were extracted from infected cells at 7 d.p.i. and ODVs were liberated from the OBs by DAS treatment, concentrated and resuspended in Laemmli buffer. The ODV samples were heat treated at 50 ℃ (50) or 95 ℃ (95) for 5 min prior to SDS-PAGE analysis. ODVs extracted from 1 × 10⁷ OBs were loaded into each well of the PAGE gel. Further protein detection was done using primary polyclonal antibodies anti-HaPIF1, anti-HaPIF2 and anti-HaVP91 for detecting PIF complex, and anti-HaGP41 for detecting ODV tegument protein GP41.
Construction and Identification of Pif-Replaced Recombinant HearNPVs
PIFs Expression in Infected HzAM1 Cells
All Pseudotyped Viruses Caused Systemic Infection in Larvae
All Pseudotyped Viruses Produced OBs with Normal Morphology But Only HaBacΔpif3-Mbpif3 Maintained Partial Oral Infectivity
PIF Complex is Maintained with HaBacΔpif3-Mbpif3 But Not with HaBacΔpif1-Mbpif1 or HaBacΔpif2-Mbpif2
-
In this manuscript, we describe deletion of pif1, 2, and 3 from HearNPV and replacement with their homologs from MabrNPV. The pseudotyped viruses were assessed for their infectivity to H. armigera larvae by intrahaemocoelic injection with BVs and by per os inoculation with OBs. We then assessed the formation of the PIF complex in pseudotyped viruses. The viruses were correctly constructed as evidenced by Western blot results showing the absence of HaPIFs but the presence of the respective MbPIFs (Fig. 4). One-step growth curves showed that the BV production by all the pseudotyped viruses was unaffected (Fig. 3). Intrahaemocoelic injection (Fig. 5) revealed that all pseudotyped viruses infected and replicated in a variety of insect tissues, causing a systemic infection and consequent larval death. Non-extensive replication of HearNPVs in heamocytes but high replication in trachea affirms previous findings that haemocytes are not involved in the dissemination of the virus and that trachea is the conduit to disseminate the virus to various tissues (Clarke and Clem 2002). SEM and TEM observations showed that pseudotyped viruses generated OBs with normal morphology (Fig. 6). By contrast, feeding assays revealed only HaBacΔpif3-Mbpif3 was infective to larvae but at a much lower rate than the control virus (Tables 1, 2). We were unable to determine the LC50 value of HaBacΔpif3-Mbpif3 which is due to the practical difficulty for higher dose infection. But considering the data in Tables 1, 2, we can extrapolate the LC50 of HaBacΔpif3-Mbpif3 to be close 3 × 10⁸ OBs/mL, which 100, 000-fold higher than that of the control virus HaBac-egfp-ph (5.7 × 10³ OBs/mL). Test larvae were totally resistant to OBs from viruses pseudotyped with pif1 or pif2. Similar results were previously reported for HearNPV pseudotyped with pif 0–3 from AcMNPV or SpltNPV (Song et al. 2016).
It is clear that HaBacΔpif1-Mbpif1 and HaBacΔpif2-Mbpif2 could not form PIF complex (Fig. 7), and both virus completely lost their oral infectivity. This result confirmed previous assumption that PIF complex is critical for oral infection (Peng et al. 2010a). The virus HaBacΔpif3-Mbpif3 formed at least a partially functional complex as judged by its limited oral infectivity to larvae. The fact that Western blots demonstrated a complex formation of ~ 170 kDa, this is not sufficient on its own to extrapolate that the complex is the same as that formed by the parental virus. Presently, the generated data cannot reveal why the complex did not allow HaBacΔpif3-Mbpif3 to fully infect larvae similar to the parental virus. However, we cannot discount the fact that the heterologous PIF3 was structurally functional to an extent that caused some infectivity in larvae.
The PIF complex comprises multiple proteins (Peng et al. 2012) and PIF complex components have been shown to interact with each other using crosslinking, partial denaturation and Y2H system (Peng et al. 2010a; Zheng et al. 2017), BiFC (Dong et al. 2014; Zheng et al. 2017), CoIP (Dong et al. 2014) and blue native PAGE (Peng et al. 2012). Here we report that the substitution of either HearNPV PIF1 or PIF2 inhibited the formation of PIF complex and oral infectivity. This could be because the MabrNPV PIF homologs could not interact appropriately with HearNPV PIFs. PIF1 and PIF2 are involved in binding and fusion to facilitate oral infection (Ohkawa et al. 2005). As MabrNPV and HearNPV are both infectious to H. armigera, the inability of MabrNPV PIF1 and PIF2 to efficiently complement their homologs in HearNPV, emphasizes the essentiality of a functional complex in oral infectivity. We cannot rule out that MabrNPV PIF1 and PIF2 may have different binding targets on the same midgut columnar epithelial cell or have different binding affinities attributed to the difference in amino acid sequence. One should be cognizant that other accessory proteins, viral or cellular, may have a functional role in the formation of the complex and/or assist in the binding of the complex to cellular receptors. This underscores the need for further investigations to fully elucidate the steps involved in oral infection by baculoviruses.
It is also essential to remember that once proteins interact with each other, allosteric transition may confer a structure different from the individual proteins. In the case of HaBacΔpif3-Mbpif3, the transition might not have been complete to allow full functionality, meaning proper interactions with cell receptors, hence a much reduced oral infectivity. On the other hand, unlike PIF1 or PIF2 which are involved in the initial binding and fusion process, PIF3 appeared to be not involved in these events but with other unknown function (Ohkawa et al. 2005). It is possible that the function of PIF3 could tolerate certain structure flexibility which allows it to partially function when replaced with MbPIF3.
The oral infection process of baculoviruses remains largely to be deciphered. Previously, substitution of HearNPV PIFs with homologs from AcMNPV or SpltNPV (both are non-infectious to H. armigera) was largely unsuccessful in terms of oral infectivity (Song et al. 2016). MabrNPV has a wide host range including H. armigera (Doyle et al. 1990) and, therefore, we surmised its PIFs might be functional in HearNPV but it appears that, in general, the specificity of per os infectivity factors is quite high. Equally important, is that PIF proteins must have evolved to function in conjunction with each other.
In conclusion, the construction of PIF-replaced viruses enabled the assessment of the presence of PIF complex that is essential for oral infectivity. Only PIF3 replacement showed the formation of PIF complex and retained partial oral infectivity. The results prove that the PIF complex is essential for the oral infectivity by baculoviruses. As baculoviruses are increasingly being used as insect biocontrol agents, further insights into deciphering the intricacies of the PIF complex becomes more pertinent. In response to this, a system permitting substitution of entire PIF complex constituents has been established and investigations utilizing this system are underway (Shang et al. 2017). Further studies will also aim to disclose the molecular structures of the complex to reveal both the interactions within and with host receptor including the binding domains.
-
This work was supported by grants from the Key Research Program of Frontier Sciences of the Chinese Academy of Sciences (grant No. QYZDJ-SSW-SMC021), the National Natural Science Foundation of China (grants No. 31621061 and 31130058), the Virology Key Frontier Science Program of State Key Laboratory of Virology (grant No. klv-2016-03), and the National Key R & D Program of China (2017YFD0200400). This research study was sponsored by CAS-TWAS President's Fellowship for International PhD Students. We acknowledge the technical support and core facility of Wuhan institute of Virology for technical assistance.
-
ZHH and MLW designed the study; GAM performed most of the experiments; XW, HYZ, NZ and CC participated in the experiments; GAM, LJ, FD and HLW analyzed the data; GAM, ZHH and MLW wrote and finalized the manuscript. All authors read and approved the manuscript.
-
The authors declare that they have no conflicts of interest.
-
This article does not contain any studies with human or animal subjects performed by any of the authors.

 DownLoad: