


HTML
-
Zika virus (ZIKV) is a single-stranded RNA virus belonging to the family Flaviviridae and genus Flavivirus. It was first isolated from a forest in Uganda in 1947 (Dick et al. 1952) and is transmitted through mosquito bites, particularly those from Aedes aegypti and Aedes albopictus (Weaver et al. 2016). ZIKV infection is characterized by mild fever (37.8–38.5 ℃), joint pain (particularly in the hands and feet), myalgia, headache, orbital pain, conjunctivitis, and skin rash, and it can also cause microcephaly and Guillain-Barré syndrome (Chouin-Carneiro et al. 2016). The ZIKV genome encodes three structural proteins (capsid protein, C; precursor protein, prM; and envelope protein, E) and seven nonstructural proteins (NS1, NS2A, NS2B, NS3, NS4A, NS4B, and NS5) (Fontes-Garfias et al. 2017).
For the detection of ZIKV, Rossini et al. (2017) showed that the whole blood and urine testing period lasts longer than the plasma. ZIKV can be detected in whole blood approximately 3–26 days after infection and in plasma 3–10 days (Hayes, 2009). In serological tests, ZIKV IgM or IgG antibodies can be detected by enzyme-linked immunosorbent assay (ELISA). However, ELISAs may generate false-positive results owing to the strong crossreactivity among flaviviruses (Hancock et al. 2014; Priyamvada et al. 2016). This causes difficulty in the diagnosis of ZIKV, especially in regions where other flaviviruses are endemic. The standard tool for quantifying viral DNA or RNA is real-time fluorescent quantitative polymerase chain reaction (RT-qPCR). However, for RTqPCR, absolute quantification and the establishment of a standard curve are necessary, increasing the difficulty in detecting the virus (Hindson et al. 2011). Additionally, several factors may decrease the amplification efficiency of RT-qPCR, including the presence of PCR inhibitors in patient serum, leading to quantification failure (Rutsaert et al. 2018). Therefore, the detection sensitivity of RTqPCR is limited when using serum samples with low viral concentrations (Balm et al. 2012).
Micro-droplet digital polymerase chain reaction (ddPCR) is a new molecular method enabling the absolute quantification of DNA targets without the need for a calibration curve as in RT-qPCR (Sykes et al. 1992). The principle of digital PCR was first introduced in the 1990s. The ddPCR method uses the same primers and probes as RT-qPCR but can obtain high sensitivity and precision for detecting target molecules (Sidransky et al. 1992). Although recently developed, ddPCR is used widely in medical research and clinical applications. This technology uses a combination of microfluidics and proprietary surfactant chemistries to randomly distribute target and background nucleic acids into water-in-oil droplets that are uniform in size and volume (Hindson et al. 2011). Every microdroplet is a micro PCR reactor, with each containing zero or at least one copy of the target DNA (Hindson et al. 2011; Nakano et al. 2005; Pinheiro et al. 2012). Using Poisson statistics, digital PCR enables the absolute quantification of nucleic acids, reducing the subjectivity of the analysis by eliminating the need for signal threshold determination and standard curves (Sedlak and Jerome 2013).
As an emerging and versatile molecular biotechnology, ddPCR is a robust and powerful method for the detection and quantification of nucleic acids with unparalleled accuracy and precision without the need for an external calibration curve or reference. In recent years, an increasing number of ddPCR applications has been introduced into the medical, environmental (Cao et al. 2015; Nathan et al. 2014), and food safety control fields (Floren et al. 2014), but the method has not yet been applied to ZIKV. Therefore, in this study, we aimed to establish ddPCR and RT-qPCR protocols for the detection of ZIKV based on the amplification of the NS5 gene. We compared the sensitivity and specificity of these methods, aiming to provide a highly accurate method for the detection of low titers and/ or the early detection of ZIKV.
-
The Asian ZIKV Z16006 strain was provided by the Institute of Microbiology at the Center for Disease Control and Prevention of Guangdong Province, China (GenBank no. KU955589.1). Four serotypes of dengue virus (DV1 Hawaii strain, DV2 NGC strain, DV3 H87 strain, and DV4 H241 strain) were preserved in our laboratory. The above viruses were amplified and cultured in C6/36 cells. After observing cytopathic effects, cells were repeatedly frozen at - 80 ℃, thawed, and centrifuged (Xin et al. 2016). Clinically positive ZIKV blood samples were obtained from the Center for Disease Control and Prevention of Jiangmen, Guangdong Province, China.
-
The micro-ddPCR instrument, amplification premixed reagent, Droplet PCR Supermix, and micro-drop reagent were all from Bio-Rad (Hercules, CA, USA). Reverse transcription was performed using a Takara Prime Script RT Reagent Kit (Perfect Real Time kit; Takara, Shiga, Japan). Bestar qPCR Master Mix (TaqMan Probe) was obtained from DBI Bioscience (Ludwigshafen, Germany), and a QuantStudio 6 Flex Real-Time PCR System was purchased from ThermoFisher Scientific (Waltham, MA, USA).
-
ZIKV sequences were downloaded from GenBank and compared. After identifying conserved sequences, primers and probes were designed using Primer 5.0 (Primier, Canada) with the Z16006 strain as the reference. The primers and probes were evaluated using Oligo 7 (Oligo, USA).
-
Before RNA extraction, we used Solid Phase RNase-begone (Sangon Biotech, Shanghai, China) to remove ribonuclease (RNase) from the operating desktop, pipettes, and gloves. RNase-free filter tips (Sangon Biotech, Shanghai, China) were also used to minimize the effect of RNase. Samples were thawed to room temperature (25 ℃) before use. Viral RNA was extracted using QIAamp® (Qiagen, Hilden, Germany) with a final RNA volume of 50 μL. The RNA was separated into aliquots and preserved at - 80 ℃.
For reverse transcription, the components were prepared on ice as follows: 2 μL 59 Prime Script Buffer; 0.5 μL Primer Script RT Enzyme Mix I; 0.5 μL oligo dT primer, 0.5 μL random 6-mers; 4 μL total RNA; and 2.5 μL RNase-free dH2O. The reaction conditions were as follows: reverse transcription at 37 ℃ for 15 min; reverse transcriptase inactivation at 85 ℃ for 5 s, and a final hold at 4 ℃.
-
For ddPCR, each 20-μL reaction system contained 10 μL ddPCR Supermix (no dUTP), 6 μL primer–probe premix (0.4 μL each of 10 lmol/L upstream and downstream primers, 0.2 μL of 10 lmol/L probe, 5 μL deionized water), and 4 μL nucleic acid extract. After mixing, 20 μL of each sample reaction was added to the middle of a DG8 cartridge. Next, 70 μL oil was added to the bottom row of each lane to avoid bubble formation, and the wells were covered. The reaction system and droplet-forming cartridge were placed in a droplet generator and subjected to microdroplet treatment.
Droplets were generated in the top row of the wells, and the suction volume was adjusted to 40 μL. The samples were then slowly transferred to 96-well plates, and a preheated PX1 heat sealing device was used with a sealing film (with the red line up) at 180 ℃ for 5 s. The PCR conditions were as follows: pre-denaturation at 95 ℃ for 10 min and 40 cycles of 94 ℃ for 30 s and 55 ℃ for 1 min with a temperature change rate of 2 ℃/s. The 96-well plate containing the PCR-amplified products was then placed on a QX200 micro-drop reader and analyzed using QuantaSoft software (Bio-Rad).
-
For RT-qPCR, Bestar qPCR Master Mix (10 μL), upstream and downstream primers (0.4 μL each), probe (0.2 μL), template cDNA (1 μL), and H2O (8 μL) were used. The amplification conditions for RT-qPCR were as follows: 95 ℃ denaturation for 2 min, followed by 40 cycles of 95 ℃ for 10 s and 60 ℃ for 30 s.
Sample Processing
Instruments and Reagents
Design of Primers and Probes
RNA Extraction and Reverse Transcription
ddPCR
RT-qPCR
-
ZIKV sequences were downloaded from GenBank and aligned, and conserved sequences were identified. Primers were designed to amplify the NS5 gene while ensuring that the GC contents and Tm values were similar. The length of the target fragment was about 100 bp without hairpin structures to avoid the formation of stable dimers and mismatches at the 3' terminus. The designed primers are shown in Table 1.

Table 1. Primers and probes for ZIKV detection
-
Tenfold dilutions of ZIKV plasmid standards (100–108 copy/μL) were prepared. The relationship between the RTqPCR cycle threshold (Ct) value and copy number exhibited a good linear relationship as follows: Ct = - 3.524 log10 (copy)+38.04 (R2 = 0.999, amplification efficiency = 92.203%). Based on the standard curve, we found that the range of linearity for RT-qPCR was 101–108 copy/μL, and the lower detection limit for ZIKV was 101 copy/μL. However, at a concentration of 1 copy/μL, ZIKV could not be detected (Fig. 1A).

Figure 1. Sensitivity of RT-qPCR and ddPCR for detection of ZIKV. A Standard curve of the RT-qPCR method; B–E results of fivefold dilution series of ZIKV plasmid standards detected by ddPCR. B Scatter plot of the total number of events (droplets). Z1: plasmid standard, 2000 copy/lL; Z2–Z6: fivefold dilution series of Z1; N: negative control. The threshold is 1000. C Positive (blue) and total (green) number of events (droplets). D Genetic concentration of each diluted sample. E Comparison between ddPCR-detected concentration and theoretical concentration; #P>0.05 (not significant)
In comparison with RT-qPCR, the results from ddPCR showed that the method was not suitable for detecting samples containing more than 104 copy/μL due to poor repeatability (data not shown). Therefore, we prepared a fivefold dilution series of the standard of 104 copy/μL for ddPCR. The signal threshold of event numbers was set at 1000, with a value above 1000 being positive and a value below being negative (Fig. 1B), and the total numbers of droplets in the sample should ideally be above 10, 000. For our samples, the total event numbers were more than 10, 000 (except one sample is 9990) (Fig. 1C). High accuracy was obtained if the copy number of each diluted sample was in line with the theoretical value for the standard sample (Fig. 1D). Compared with RT-qPCR, ddPCR had a lower detection limit of 1 copy/μL (Fig. 1E).
-
To verify the repeatability of the two methods for ZIKV detection, we conducted each experiment three times and compared the results. The results of RT-qPCR showed that there was good repeatability in the dilution range of 101– 108 copy/μL but that the Ct value of 1 copy/μL was significantly different among experiments. This suggests that the RT-qPCR method is unstable for low-copy-number detection (100–101 copy/μL). However, ddPCR showed good repeatability for the detection of low copy numbers (100–101 copy/μL) (Fig. 2A, 2B).
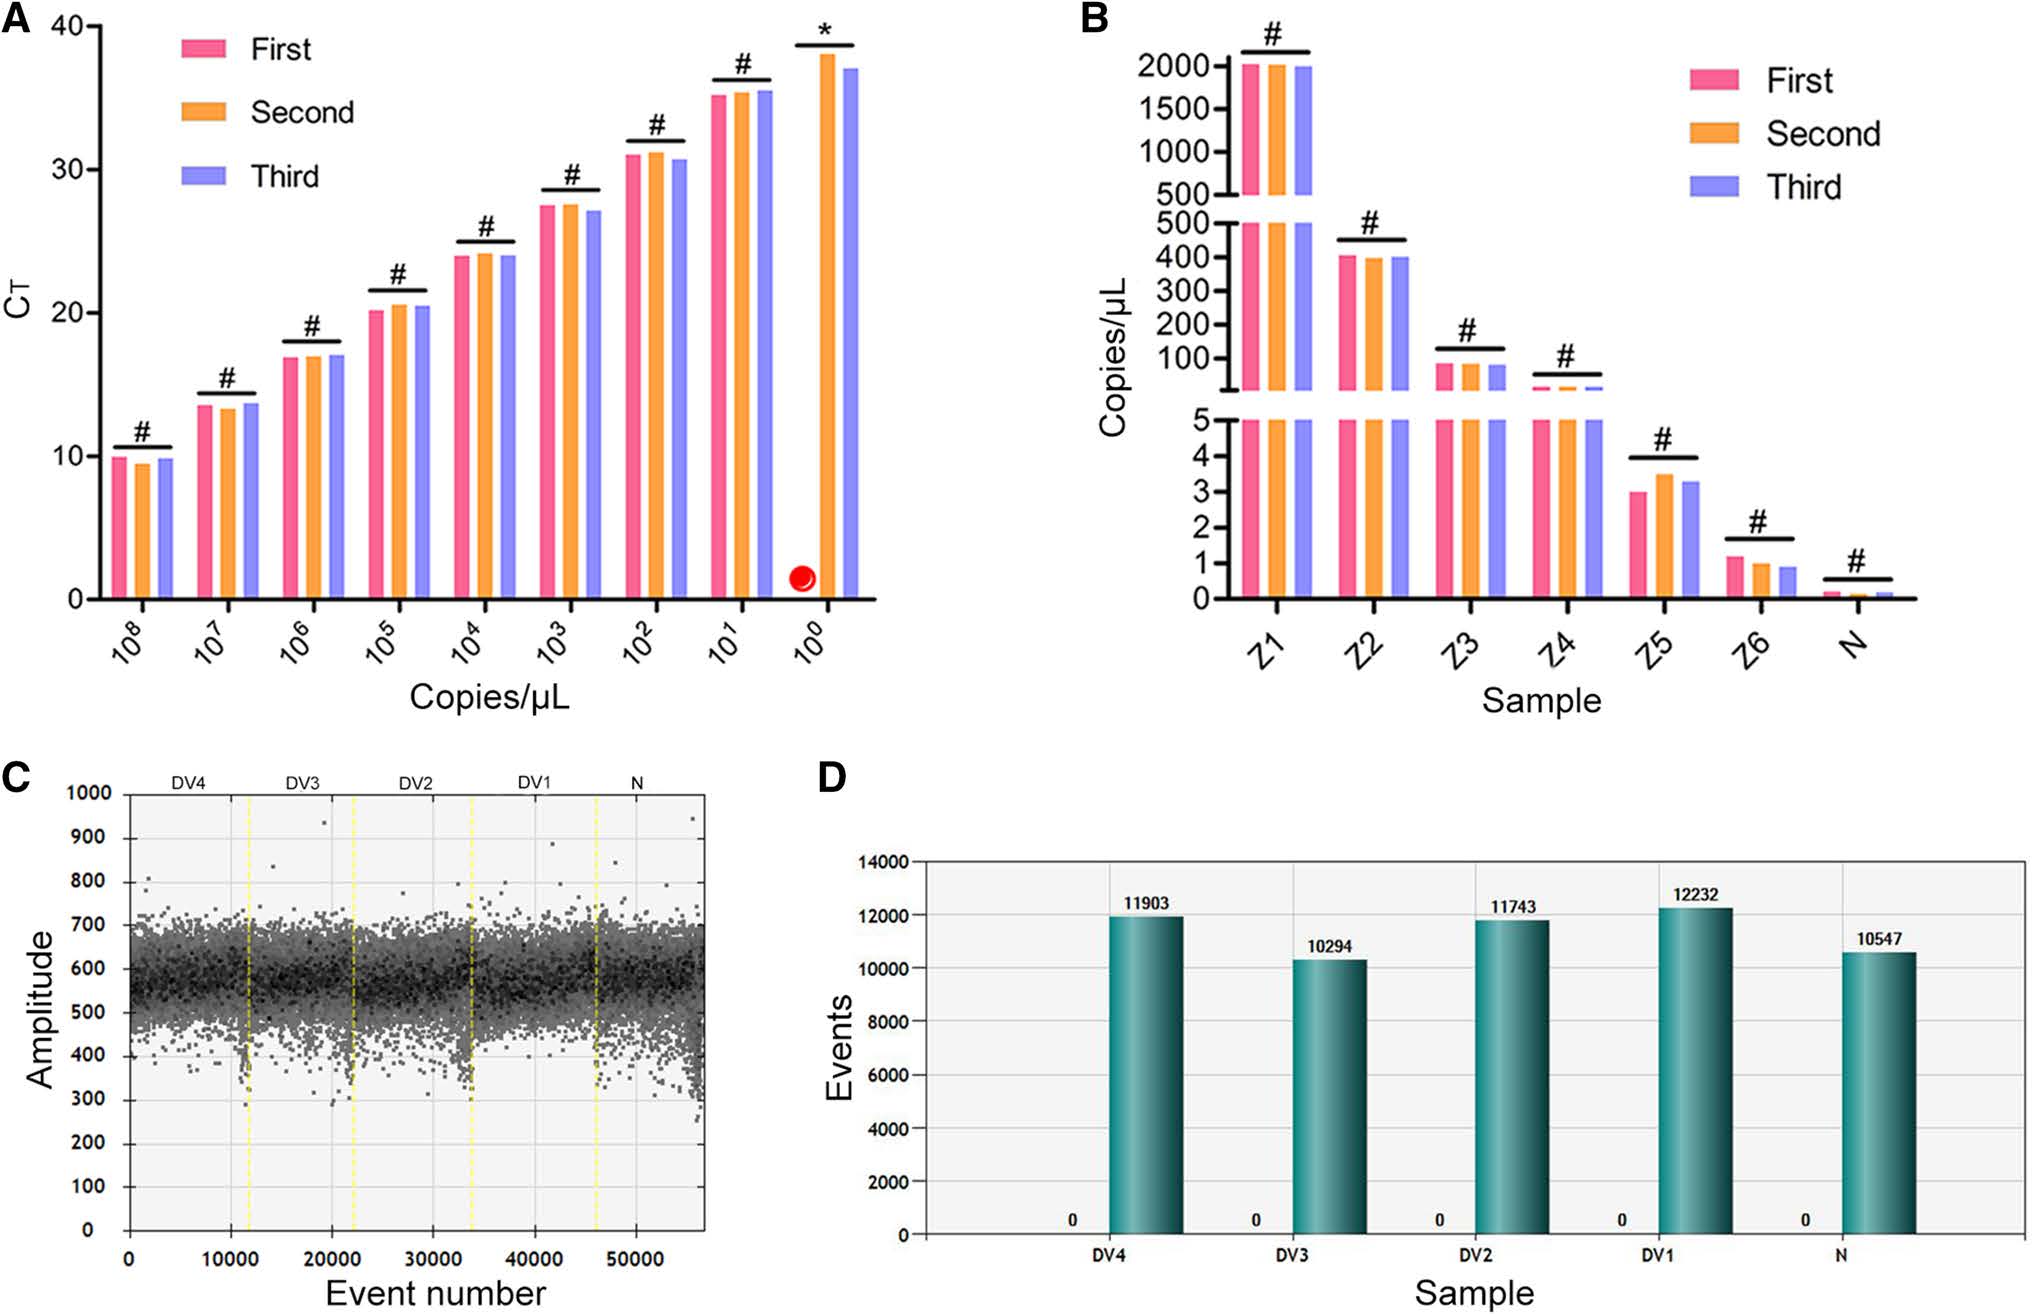
Figure 2. Repeatability and specificity of RT-qPCR and ddPCR methods for ZIKV detection. A Construction of RT-qPCR standard curves using a tenfold dilution series of plasmid standard and repeated three times. Red circle: no Ct value; #P>0.05 (not significant), *P < 0.05 (significant difference). B Results from a fivefold dilution series of plasmid standard detected with ddPCR and repeated three times. #P>0.05 (not significant). C Scatter plot of the total number of events (droplets); the threshold for a positive result was 1000, and there were no positives. D Positive (blue) and total (green) number of events (droplets), with no positive events shown. DV1–4 represents four serotypes of dengue virus. N, negative control
Next, we evaluated the specificity of the assays using four dengue virus (DENV) serotypes. Each experiment was repeated three times, and the results were compared. All RT-qPCR results were negative. As can be seen from Fig. 2C and 2D, negative results were also obtained using ddPCR. The nucleic acid concentrations detected by the absolute quantification method were zero. Moreover, only negative micro-droplets were observed (Fig. 2C), and histogram analysis showed that the total number of droplets was more than 10, 000, among which none were positive (Fig. 2D).
-
Two serum samples from clinically positive patients (Sample A and Sample B) were tested using the two methods with three repeated wells each. According to RTqPCR analysis, the Ct value of sample A was 28.75, and the corresponding concentration of ZIKV was 432.5 copy/μL. There was no significant difference between this result and that obtained via ddPCR (Fig. 3A). For ddPCR, the three replicates of sample A exhibited good consistency (P>0.05) (Fig. 3B, 3C). By contrast, there was a significant difference between the results of the two detection methods for sample B (Fig. 3D). According to RT-qPCR, the Ct value of sample B was 38.868, which exceeded the detection range (range of Ct: 15–35). Comparison with the standard curve showed that no ZIKV was detected (Fig. 3D). However, ddPCR analysis showed that the concentration of sample B was 13.8–14.3 copy/μL (Fig. 3E), with more than 10, 000 total droplets, ensuring the accuracy of the results (Fig. 3F).
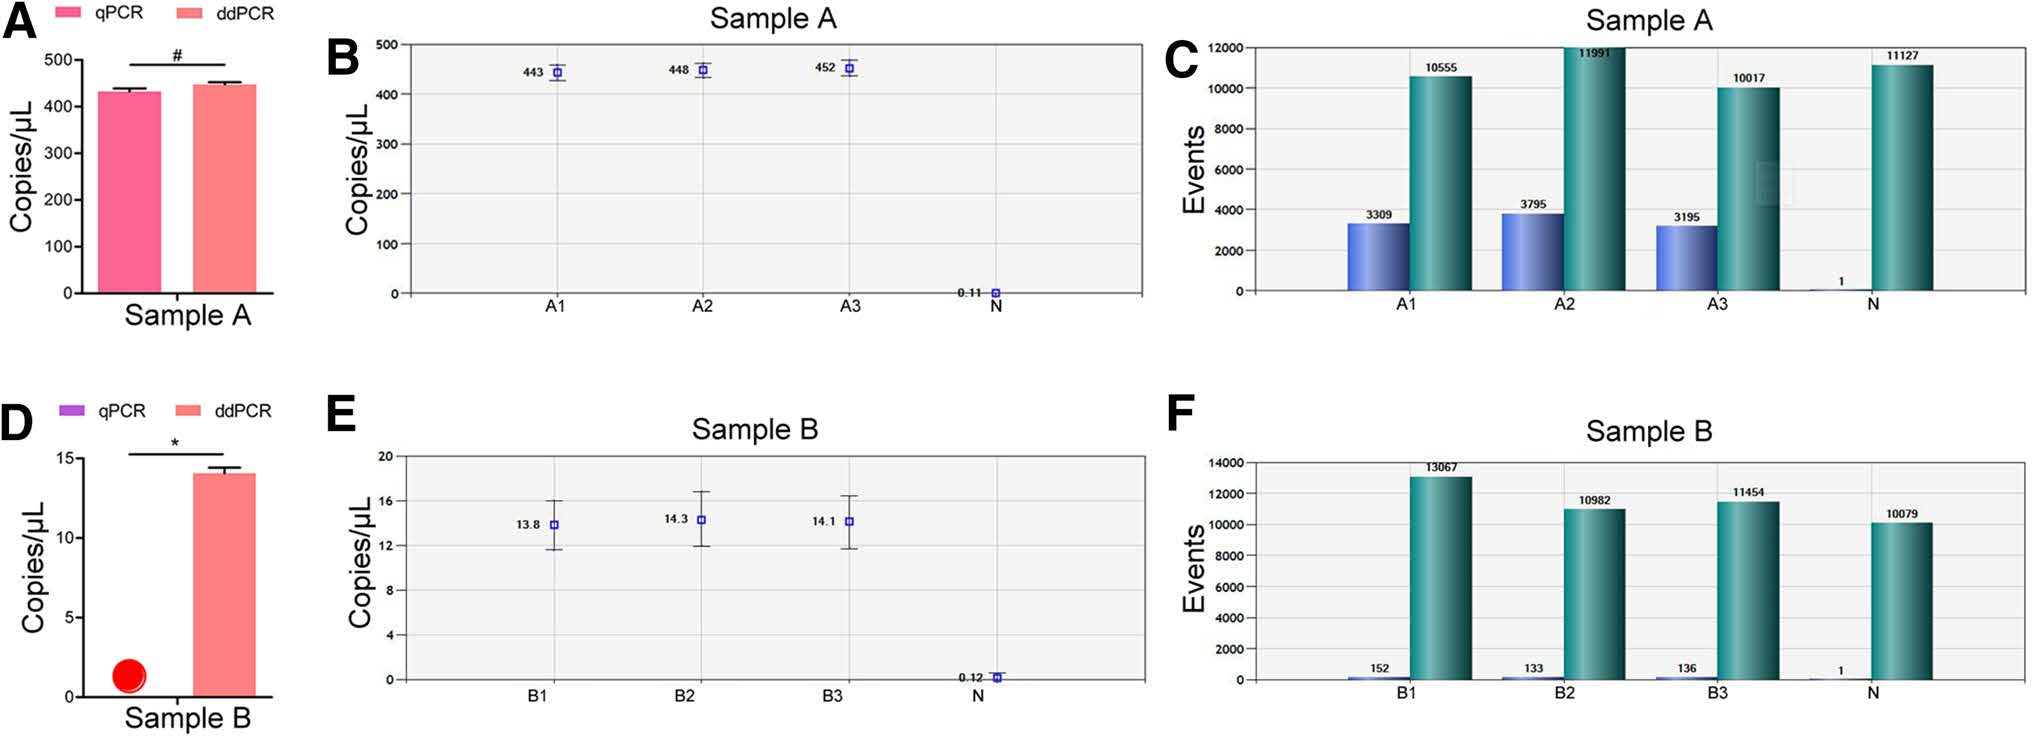
Figure 3. Results of ZIKV detection in positive clinical blood samples using RT-qPCR and ddPCR. A Comparison of Sample A concentration using the two methods; #P>0.05 (not significant); B, C results of ddPCR analysis of sample A in three repeated wells; D comparison of Sample B concentration using the two methods. Red circle: no virus detected; *P < 0.05 (significant difference); E, F results of ddPCR analysis of sample B in three repeated wells
Design and Evaluation of Primers and Probes
Evaluation of Sensitivity of RT-qPCR and ddPCR
Evaluation of Specificity and Repeatability of RTqPCR and ddPCR
RT-qPCR Detection of ZIKV in Clinically Positive Blood Samples
-
Approximately 20% of individuals infected with ZIKV develop symptoms similar to those of other flaviviruses (Duffy et al. 2009), and this presents a considerable challenge to clinical diagnosis. There are two types of clinical diagnostic tests for ZIKV: serological and molecular detection tests. Antibody capture ELISA can be used for the qualitative detection of ZIKV IgM antibodies. However, cross-reactions with other flaviviruses lead to difficulty in interpreting the results (Zanluca et al. 2016). Therefore, nucleic acid detection methods are superior to serological detection owing to their high specificity.
In this study, we designed primers and probes specific for the NS5 gene of ZIKV and established a method for ZIKV nucleic acid detection using ddPCR and RT-qPCR. Our results showed that the designed NS5-targeted primers and probes exhibited high specificity. The NS5 gene is the largest gene in the ZIKV genome and is located at the 3' end of the open reading frame (ORF). It is a nucleic acid detection target commonly used for the detection of Flavivirus (Faye et al. 2014). Currently, several laboratories have established nucleic acid detection technologies for ZIKV, with the main targets being the E and NS5 genes (Gourinat et al. 2015). Therefore, the conserved sequence of NS5 gene may be a reliable detection target.
In molecular biology, amplification levels of traditional PCR can only roughly be detected after the reaction has ended and cannot be used to quantitatively detect nucleic acids in the sample. RT-qPCR technology utilizes changes in the fluorescence intensity of chemical substances in the reaction system for the quantitative detection of nucleic acids. Xu et al. (2016) used one-step SYBR Green realtime PCR for the detection of ZIKV with a detection limit of at least 1.0 PFU/mL (1 PFU is approximately equal to 2×10⁵ RNA genome copy). However, as this method allows the simultaneous detection of both specific and nonspecific PCR products, it produces false positives. Frankel et al. (2017) developed the Abbott Real-Time ZIKA assay, and the detection limit of this assay was shown to be 120 copy/μL in whole blood. Moreover, Balm et al. (2012) developed a sensitive and specific one-step RT-qPCR assay, and the lower limit of detection of this assay was 140 RNA copy/PCR. The results of the above studies are similar to our findings. Our RT-qPCR data showed good linearity between the Ct value and sample concentration at a concentration range of 101–108 copy/μL, and false-negative results were obtained when the sample concentration was below 101 copy/μL, especially in serum samples. Compared with the results of the above researchers, a lower detection limit was obtained in this study, although quantification was unstable at this concentration.
To compensate for the poor stability of RT-qPCR in low-concentration samples, we aimed to develop a more sensitive and specific detection method. Calvert et al. used reverse transcriptase loop-mediated isothermal amplification to detect RNA from ZIKV at concentrations as low as 1.2 copy/μL; however, they observed a very high falsenegative rate (Calvert et al. 2017). ddPCR overcomes the deficiencies of reverse transcriptase loop-mediated isothermal amplification and exhibits better sensitivity and reliability. The quantitative detection of nucleic acids by ddPCR is based on the Poisson distribution principle rather than relying on external standard curves. Owing to the advantage of absolute quantitation, this method permits better accuracy at low concentrations without the need for standard curves (Strain et al. 2013). ddPCR has been used for the development of other applications assessment of human immunodeficiency virus (HIV) and cytomegalovirus viral loads, monitoring of the genetic stability of recombinant protein expression systems, and detection of a known mutation in a live attenuated vaccine virus (Bizouarn 2014; Hayden et al. 2013; Hindson et al. 2011; Pinheiro et al. 2012; Strain et al. 2013; Taylor et al. 2015). Our ddPCR results showed good linearity with sample concentrations of 1–104 copy/μL. Compared to the poor stability of RT-qPCR at the detection limit of 101 - copy/μL, ddPCR showed a detection limit of 1 copy/μL with good specificity and repeatability. Thus, ddPCR showed better performance than RT-qPCR when detecting ZIKV in serum samples with low viral concentrations. However, high concentrations of total DNA can affect the viscosity of the aqueous phase and complicate the formation of droplets. ddPCR is therefore not suitable for quantifying high-concentration samples, especially those in which the target gene concentration is above 105 copy (Pinheiro et al. 2012), these samples should be diluted before quantification (Zhao et al. 2013).
In summary, a good linear relationship was obtained with RT-qPCR when detecting samples with higher concentrations (above 101 copy/μL), but this method is not suitable for detecting low copy numbers (less than 101 - copy/μL). By contrast, ddPCR detection of low-concentration samples, especially serum sample, shows excellent specificity and sensitivity; however, it cannot be applied to high-concentration samples. Therefore, RT-qPCR and ddPCR could be used to complement each other in clinical examination. In clinical samples with low concentrations of ZIKV, for example in samples obtained 1–3 days after infection, ddPCR should be used to achieve the best diagnostic accuracy and sensitivity. For routine laboratory ZIKV detection, including the analysis of clinical samples obtained [ 3 days after infection, RT-qPCR should be used.
-
This study was supported by the National Natural Science Foundation of China (Nos. 31470271 and 81730110) and Guangzhou Science and Technology Program key projects (No. 201803040006). We thank Changwen Ke, De Wu, and Jiufeng Sun from the Guangdong Center for Disease Control and Prevention for providing the Asian ZIKV Z16006 strain. The authors would like to thank anonymous referees for their valuable suggestions, which have improved the paper immensely.
-
ZQ and YH designed the experiments. ZW, LZ, JL, XL, HF, and SF carried out the experiments. JY, XH and WL analyzed the data. WX, and QW wrote the paper. BZ and WZ checked and finalized the manuscript. All authors read and approved the final manuscript.
-
The authors declare that they have no conflict of interest.
-
The study was approved by the Ethics Committees of Southern Medical University. All participants provided written informed consent.

 DownLoad: