


HTML
-
Baculoviruses are an ideal and efficient biological control agent for many insect pests because of their host specificity and ease of manipulation for better efficacy (Grzywacz 2017). Gypsy moth (Lymantria dipar) is an invasive forest pest in many parts of the world and has created serious problems in forest protection (Alalouni et al. 2013). L. dispar multiple nucleopolyhedrovirus (LdMNPV) is widely used as a biological control agent against this pest (Oberemok et al. 2016). They not only effectively compromise the host immune system, but also use a variety of behavioral strategies for better dispersal and persistence of the virus (Oberemok et al. 2016).
Hyperactivity also known as Enhanced Locomotory Activity (ELA) is a peculiar induced behavior by baculoviruses to their host larvae, where larvae tend to walk around more which eventually helps to spread virus particles in a broader surface (Goulson 1997; Kamita et al. 2005). Focused research on the baculovirus' mechanism to trigger hyperactivity in host larvae revealed the ptp gene encoding protein tyrosine phosphatase as a major participant in multiple larva-baculovirus interactions (Kamita et al. 2005; van Houte et al. 2012). Similarly, Hoover et al. (2011) reported the egt gene encoding ecdysteroid uridine 50-diphosphate (UDP)-glucosyltransferase of LdMNPV to be responsible for tree-top disease in L. dispar larvae. The tree-top disease is another altered behavioral response from lepidopteran larvae infected with baculovirus in which larvae climb to an elevated position before death. They found that the L. dispar larvae infected with LdMNPV and having an intact egt gene died at an elevated position, whereas those infected with LdMNPV where the egt gene was deleted died at the lower position. But the hyperactivity and the tree-top disease are two different altered behavioral traits induced in lepidopteran larvae and governed by different mechanisms regulated by the virus (van Houte et al. 2014). There have been no studies at the transcriptomic level during the hyperactive stage of LdMNPV infected L. dispar larvae, hence our studies in this paper.
A study conducted by Wang et al. (2015) on larvae of Bombyx mori revealed the transcriptomic changes in the brain of the BmNPV-infected larvae during the hyperactive stage. However, this study did not address the role of the peripheral nervous system distributed throughout the body of the larvae which plays an important role in regulating different behavioral decisions in insects (Marder and Bucher 2001). This can be observed during hyperactivity and light avoidance behavior of Drosophila melanogaster both being regulated through epithelial sodium channels present in multiple dendritic sensory neurons along the body wall of the insect (Ainsley et al. 2003; Xiang et al. 2010). Similarly, parasitic fungi (Ophiocordyceps unilateralis) were found colonizing the body of the carpenter ant (Camponotus castaneus) but not the brain during host behavior manipulation (Fredericksen et al. 2017). In addition, L. dispar larvae possess marked developmental resistance within an instar stage against multiple pathogenic viruses including LdMNPV (Grove and Hoover 2007; Hoover and Grove 2009). Therefore, the comprehensive report on gene expression analysis from the whole body of the L. dispar larvae in a temporal sequence within an instar at the hyperactive stage could provide better insight regarding the host's transcriptomic response towards the disease progression during the hyperactive stage.
In the present study, time-points for LdMNPV induced hyperactive stage in third instar L. dispar asiatica larvae were determined through a series of bioassays and a genomewide high-throughput transcriptome sequencing was carried out during this stage in a temporal order. Comparative gene expression profiles were analyzed to determine differences between infected versus uninfected larvae at different timepoints. We identified differentially regulated genes and significantly altered pathways in the pairwise comparison of the samples. We believe that our data will provide fundamental and useful information and expand our current knowledge on L. dispar larva's transcriptomic response toward LdMNPV infection during the hyperactive stage.
-
LdMNPV and eggs of L. dispar were kindly provided by Professor Liang-Jian Qu from the Chinese Academy of Forestry, Beijing, China. Eggs were hatched and larvae were reared on the wheat germ rich artificial diet under following conditions: temperature 26 ± 1 ℃, Relative Humidity 60 ± 5% and a photoperiod of 14:10 (Light: Dark).
-
Newly molted third instar larvae were starved for 24 h and fed with 108 occlusion bodies (OBs)/larva of LdMNPV using a modified droplet feeding method. Briefly, 108 OBs/μL of virus suspension were prepared and mixed with an equal volume of 10% sucrose solution with green colored food dye (Shaanxi TOP Pharm Chemical Co., Ltd, China). Two μL of prepared inoculant was placed on the bottom of 1.5 μL centrifuge tubes. Each larva was guided inside those tubes placed upside down. By 5 min, most of the larvae finished drinking the provided virus suspension climbing up in the tube. Those finished drinking the suspension were transferred to an individual mesh wire column of 5 cm diameter and 60 cm height, with a plastic lid on each side with food placed at the bottom (approx. 3 cm3) (Fig. 1). Larvae in the control group were mock treated (no virus) and placed in the column the same way. For each assay, 30–40 larvae were used. Photoperiod and environmental conditions were provided as they were reared upon. 15 W led lights at a distance of 30 cm from the column were used for luminescence during light hours. The distance larva walked in all directions was tracked by hand and recorded for 15 min every day inside the column from 2 days post infection (dpi) till 6 dpi. Death from baculovirus infection was confirmed by screening for liquefaction of the larvae after death, whereas mock infected were observed till pupation. Those larvae that did not die of the polyhedrosis within the infection group and those that died prior to pupation in the control group were excluded from the analysis.
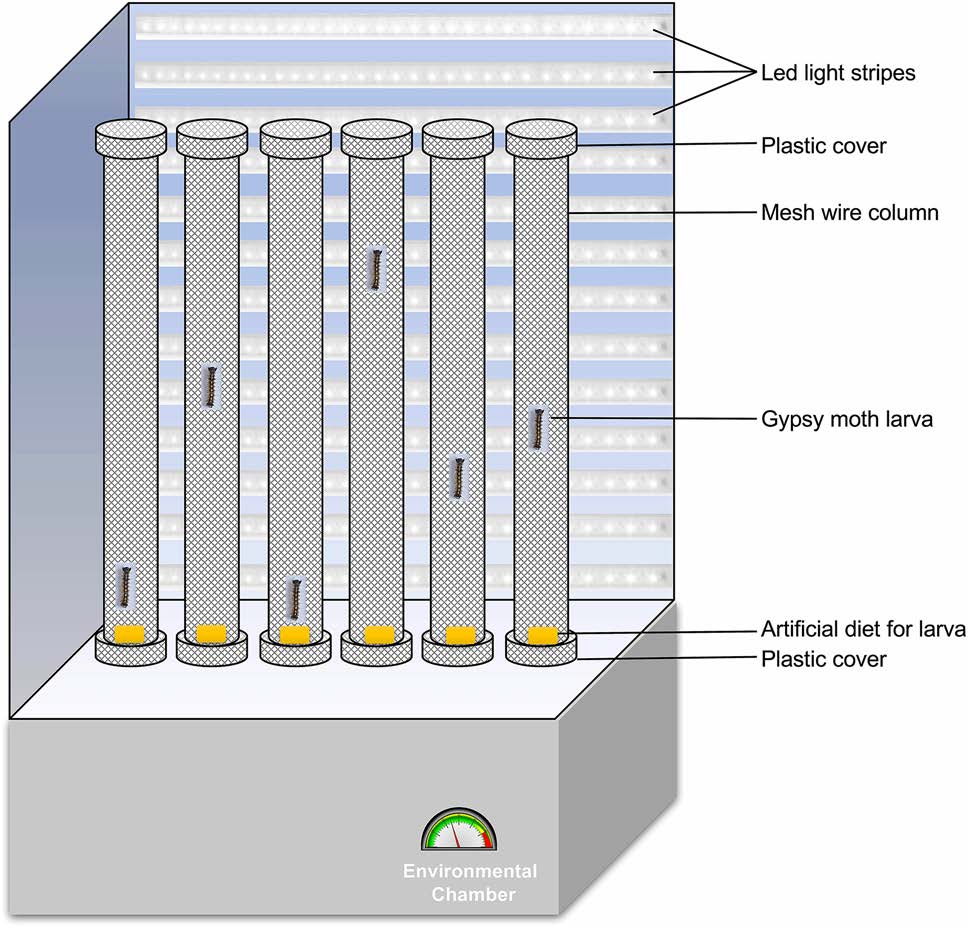
Figure 1. Diagrammatic representation of the experimental setup for the locomotion assay to observe hyperactivity in L. dispar larvae.
Two replicates were performed and data were analyzed using a linear mixed model in SAS JMP pro (v.13) with treatment, dpi, replication, and their two-way interactions as fixed effects, dpi as within-subject repeated measures and an unstructured covariance structure. Multiple comparisons for treatment and dpi was done with the Least Squares Means estimates and student's t test was performed for all pairwise comparisons.
-
Approximately 48 newly molted third instar larvae were starved for 24 h and the virus (108 OBs/larva) was fed thereafter with modified droplet feeding method as described above. Larvae were then transferred to a 24-well insect rearing box (12 × 6 × 2.5 cm3) in an individual well with diet (1 cm3) in it. For the non-infected control, 2 μL of 10% sucrose solution with food dye was provided the same way. Samples for transcriptome and subsequent analysis were obtained at 3 dpi for the control group (CK), for the LdMNPV infected group at 3 dpi (BVT_3dpi) and at 6 dpi (BVT_6dpi). Infected and uninfected larvae were both at third instar at 3 dpi and so were the infected larvae at 6 dpi, whereas mock-treated larvae molted into the next instar before 6 dpi were not included because its direct comparison with others would be biologically unsound (van Houte et al. 2015) because of the developmental variations imposed by the baculovirus infection (O'Reilly and Miller 1989; Cory et al. 2004). Sampled insects were snap frozen in liquid nitrogen and stored at - 80 ℃ until further analysis. All experiments were performed with three independent biological replicates.
-
Total RNA was extracted from the whole body of L. dispar using TRIzol Reagent (Invitrogen) following the manufacturer's protocol. RNA degradation and contamination were monitored on 1% agarose gels, purity was checked using the NanoPhotometer® spectrophotometer (IMPLEN, CA, USA), the concentration was measured using Qubit® RNA Assay Kit in Qubit® 2.0 Fluorometer (Life Technologies, CA, USA). RNA integrity was assessed using the RNA Nano 6000 Assay Kit of Agilent Bioanalyzer 2100 system (Agilent Technologies, CA, USA).
cDNA library construction and RNA sequencing were performed by LC-bio company (Hangzhou, China). Briefly, the mRNAs were purified from total RNA using Poly-T oligo-attached magnetic beads. Enriched mRNAs were used to construct cDNA libraries using NEBNext mRNA library preparation master mix following the manufacturer's instructions. The library fragments were then purified with AMPure XP system (Beckman Coulter, Beverly, USA) following manufacturer's protocol. Then PCR was performed and products were purified using AMPure XP system and library quality was assessed on the Agilent Bioanalyzer 2100 system. After clustering the index-coded samples on a cBot Cluster Generation System using TruSeq PE Cluster Kit v3-cBot-HS (Illumina) according to the manufacturer's instructions, the products were sequenced on an Illumina Hi-seq platform and pairedend reads were generated.
-
Raw data were filtered by removing the adaptor sequences, reads containing ploy-N, low quality, and the viral reads. De novo assembly of the filtered reads was carried out with Trinity (Grabherr et al. 2011) with minimum Kmer coverage set to 25 and all other parameters set to default. Unigene's functional annotation was done by the BLASTx search against the Nr, Nt, Swiss-Prot with an E-value threshold of 1e-5; in KOG, KEGG with an E-value threshold of 1e-10; Pfam database with a threshold of 0.01 and by the Blast2GO search against the GO database with an E-value threshold of 1e-6. Gene expression levels were estimated by RSEM (Li and Dewey 2011). DESeq R package (1.10.1) was used for differential expression analysis with P < 0.05. The P values were adjusted using the Benjamini and Hochberg's approach for controlling the false discovery rate. Genes with an adjusted P value < 0.05 were assigned as differentially expressed between CK, BVT_3dpi, and BVT_6dpi.
-
Gene set enrichment analysis (Subramanian et al. 2005) was performed using differentially expressed genes between samples (Padj < 0.05 as determined by DESeq R) as the list of interesting genes. Rank scores were calculated as - log10 (P value) multiplied by the sign of DESeq fold change such that upregulated genes had positive scores and downregulated has negative scores (Debski et al. 2016). Groups of related treatments comparison were built by using CK, BVT_3dpi, and BVT_6dpi as low, high and continuous high responder respectively. Thus, the comparison groups included the following combination: BVT_3dpi versus CK, BVT_6dpi versus BVT_3dpi and BVT_6dpi versus CK. Enrichment of the interesting genes within all annotated GO and KEGG pathways were used in GSEA pre-ranked method based on 1000 gene set permutations and visualized with enrichment map plugins (Merico et al. 2010) of Cytoscape (v.3.5.1) (Shannon et al. 2003) with automatic clustering and annotation through AutoAnnotate (v.1.2). Cluster labels were manually edited for clarification.
-
To validate the expression of unigenes obtained from RNASeq and to further analyze the reliability of RNA-Seq data, quantitative RT-PCR was conducted for 9 DEGs using SYBR-green (Takara) and Rotor-Gene Q Real-Time thermal cycler (Qiagen) with 95 ℃ for 3 min, followed by 40 cycles of 95 ℃ for 15 s, and 55 ℃ for 30 s. A melting curve was obtained from 60 to 90 ℃ with a 0.5 ℃ rise in temperature each 5 s to test the specificity of the amplified products. The expression data for each gene was normalized by comparing with the geometric mean of two reference genes, GAPDH and Actin. The relative expression was calculated by Livak method (Livak and Schmittgen 2001). The sequence of primers used inthis study is provided in Supplementary Table S2.

Table Table S2. List of Forward and Reverse primers used in quantitative RT-PCR analysis.
-
The datasets analyzed during the current study are available on NCBI's SRA database with the accession number of SRP103715.
Insects and Virus
Locomotion Assay
Virus Infection of Gypsy Moth Larvae and Sample Preparation for RNA-Seq
RNA Isolation, cDNA Library Construction and Illumina Sequencing
De Novo Transcriptome Assembly, Annotation, and Differential Expression Analysis
Gene Set Enrichment Analysis (GSEA) and Visualization
Validation by Quantitative RT-PCR
Data Availability
-
Hyperactivity induced by baculovirus in its host larvae is thought to be the virus's strategy for better dispersal of viruses over a wider geographical range. Understanding the mechanism and the virus ability to manipulate hosts can help to improve their efficacy to better design pest control strategies. Results showed that treatments differed significantly regarding the host mobility (F1, 102.9 = 66.177, P < 0.0001), depending on the dpi (F4, 101.0 = 22.773, P < 0.0001), and a significant interaction was found between treatment and dpi (Treatment*dpi: F4, 101.0 = 24.271, P < 0.0001) and no significant difference was found between replicates. On the 2nd dpi larvae did not show a significant difference in locomotory activity between treatments (P = 0.148). However, at 3rd dpi baculovirus-infected larvae showed a significant higher locomotor activity than the control group (P < 0.0001). The case was similar in 4th (P = 0.0016), 5th (P = 0.0008) and 6th dpi (P < 0.0001) (Fig. 2). So, the time points at 3 and 6 dpi were selected for subsequent RNA-Seq analysis. The onset of hyperactivity at 3rd dpi upon baculovirus infection has also been reported on B. mori neonates (Kamita et al. 2005).
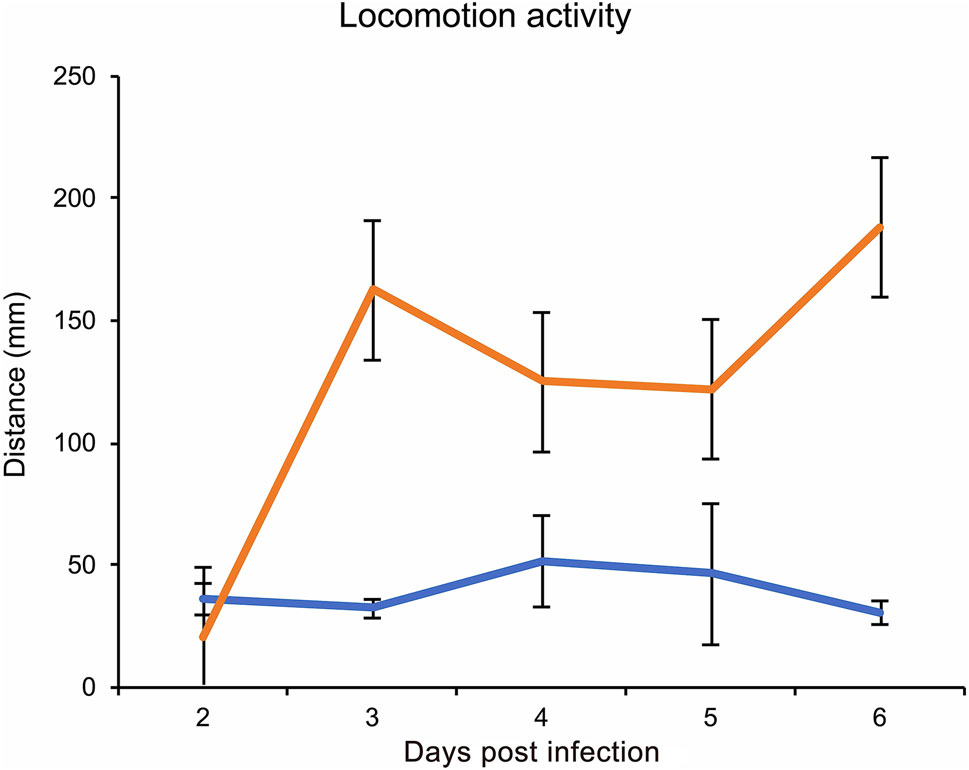
Figure 2. LdMNPV induced hyperactive behavior in L. dispar larvae showing marginal means of distance moved (mm) by mock-infected (orange line) and LdMNPV-infected (yellow line) larvae in 15-min interval at 2 to 6-dpi. LdMNPV: n = 52, Mock: n = 55. At 3-dpi virus infected larvae showed hyperactivity than mock-infected (P < 0.0001) which continued till 6th dpi (4-dpi, P = 0.0016; 5-dpi, P = 0.0008; 6-dpi, P < 0.0001) Error bars represents standard mean error.
-
A comprehensive reference transcriptome of L. dispar larvae was produced with an average insert size of 125 bp. Illumina deep sequencing of the libraries yielded 101, 721, 844 paired-end reads, which were quality filtered and de novo assembled. Assembly was used as a reference where 67.6% of clean reads from CK, 67.7% of clean reads from BVT_3dpi and 68.2% of clean reads from BVT_6dpi were mapped (Table 1). We obtained 37, 457 assembled transcripts with a minimum length of 201 bp and an N50 value of 2352 bp and 26, 388 unigenes with the minimum length of 201 and N50 value of 1745 bp GC content and length distribution of unigenes are presented in Supplementary Figure S1 and S2.

Table 1. Total number of raw, cleaned and mapped reads of different samples.

Figure Supplementary Figure S1. GC content distribution in the unigenes.
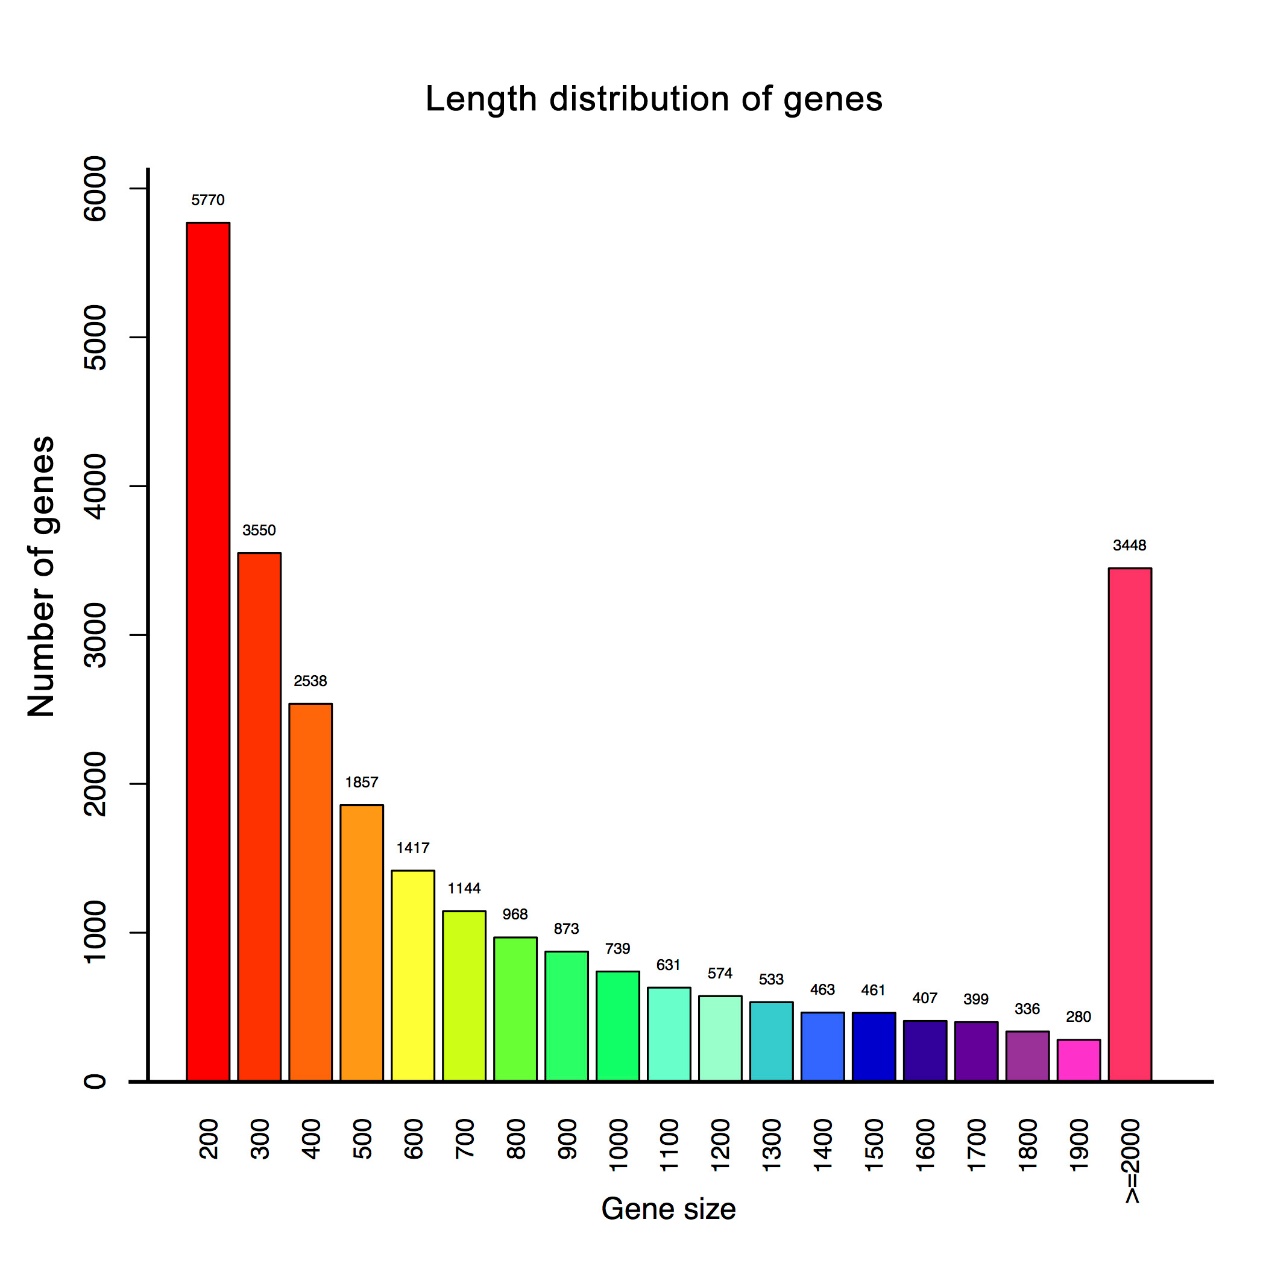
Figure Supplementary Figure S2. Length distribution of the unigenes.
-
Analysis and comparison of mRNA expression profiles revealed 245 up-regulated and 379 down-regulated genes from CK to BVT_3dpi; 161 up and 277 down-regulated for CK to BVT_6dpi and 138 up and 249 down-regulated for BVT_3dpi to BVT_6dpi [FDR < 0.01] (Fig. 3). The maximum gene expression alteration at 3dpi compared to CK was anticipated for two main reasons: firstly, the virus was at its proliferative stage infecting different tissues in the larval body. Secondly, the observed drastic change in the locomotor activity at this time point. The overall trend showed that virus infection caused a higher number of genes to be downregulated than upregulated at the measured time points, A similar expression pattern has also been reported for BmNPV infection in B. mori cells, where a number of host genes were upregulated during early infection period (before 24 h of infection), but reverse trend was seen in the following period implying shattered host immune response and virus taking control over the host system at the later stage (Sagisaka et al. 2010; Xue et al. 2012).
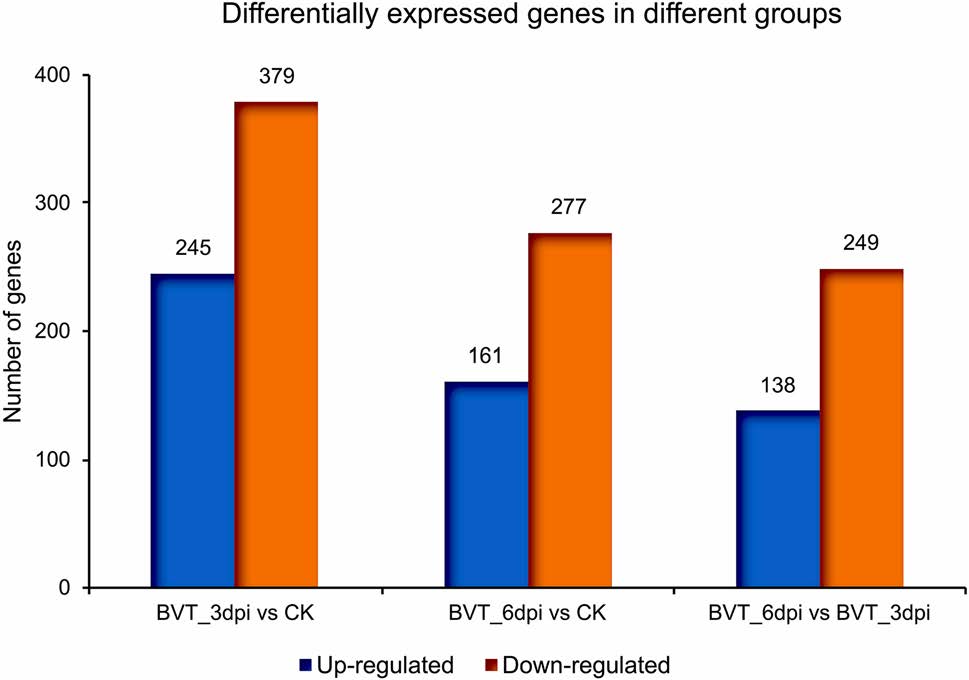
Figure 3. Differential gene expression analysis showing a number of significantly (P value ≤ 0.05 and at least two-fold change) up and down-regulated genes between samples: BVT_3dpi versus CK, BVT_6dpi versus CK, BVT_6dpi versus BVT_3dpi. Y-axis denotes the number of genes.
-
The unigene's functional annotation resulted in maximum (48.86%) annotation in NR database followed by 22.86% in KEGG, 28.95% in SwissProt, 35.66% in PFAM, 26.29% in GO and 31.57% in KOG databases (Fig. 4A). Species distribution of the transcripts showed the highest match of 48.7% with the silkworm (B. mori); 27.8% with Danaus plexippus; 2.7% with Papilio xuthus; 1.7% with Helicoverpa armigera; 0.9% with Tribolium castaneum; 0.8% with P. polytes and 17.4% with others (Fig. 4B).
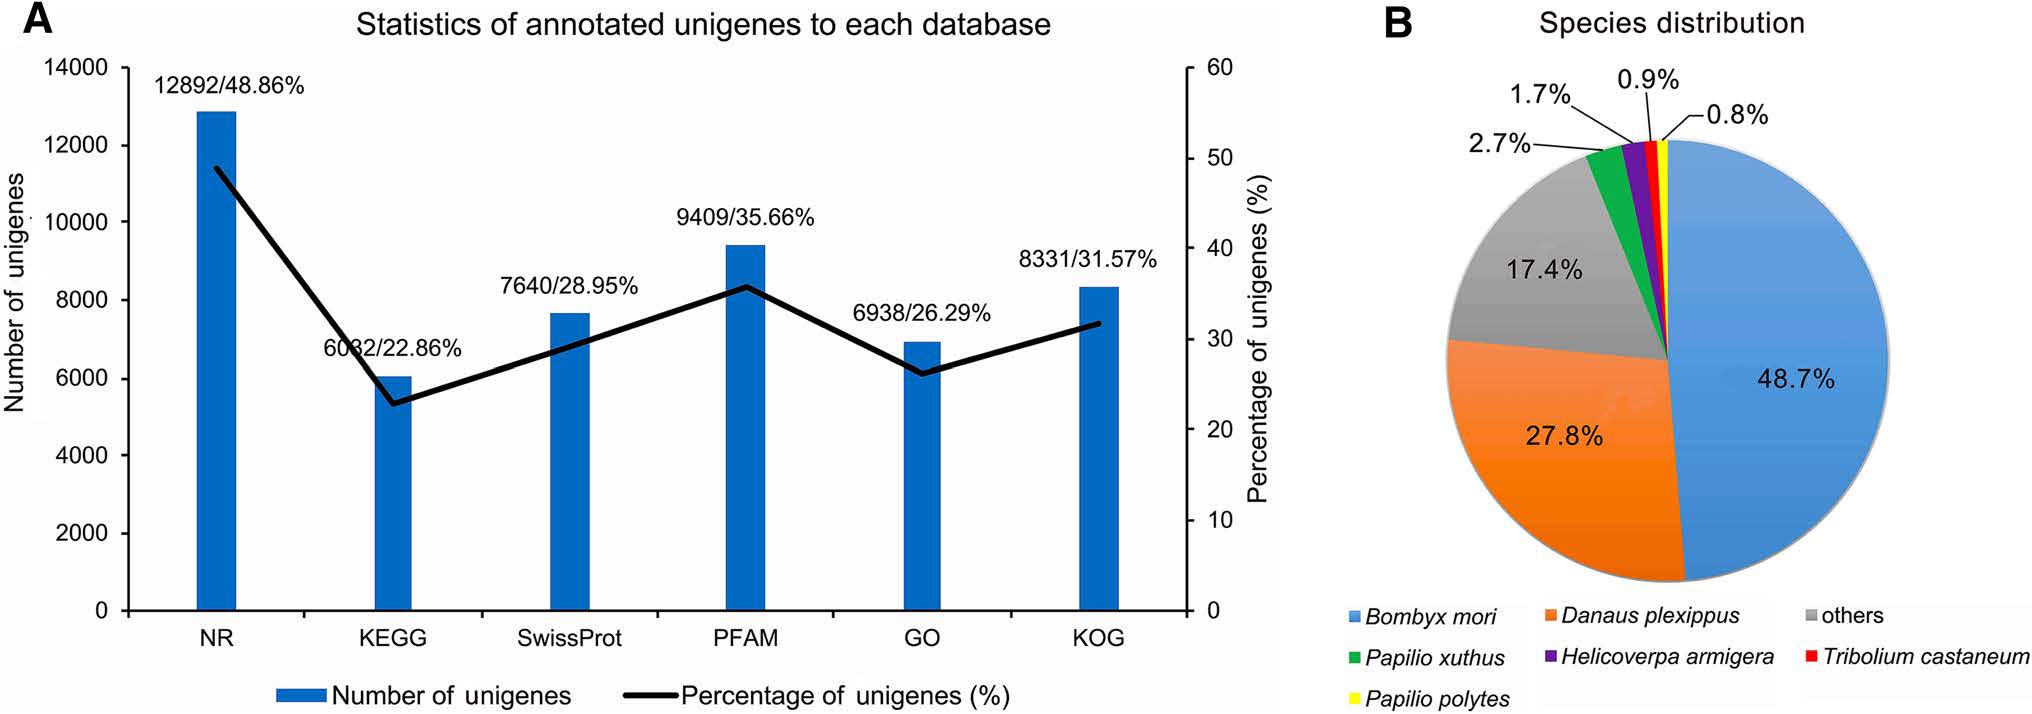
Figure 4. Annotation and species distribution details. A Statistics of annotated unigenes to each of six databases used for annotation; the number of unigenes annotated in each database is shown by the bar and their respective percentage by line graph (left and right Y-axis respectively). Number and percentage of unigenes annotated through each database are also listed on the top of each histogram separated by a slash (/). B Species distribution of the BLASTx results from the transcriptome annotations, numbers showed the similar percentage of genes to that species.
The differentially expressed genes were assigned to three main functional gene ontology categories: biological processes, cellular components and molecular functions. Each of these categories was clustered with 50, 15 and 10 GO terms respectively (Fig. 5A). Pairwise GO enrichment analysis of the DEGs between samples showed that they were mostly related to proteolysis, extracellular region, serine-type endopeptidase activity, and zinc ion/protein binding (Fig. 5B–5D). A similar GO enrichment pattern of differentially expressed host genes upon BmNPV infection in host cells (Shobahah et al. 2017) as well as in Zika virus infected Aedes aegypti (Etebari et al. 2017) had been reported. Maximum distribution of DEGs in the molecular functions category associated with binding activity had also been reported by Wang et al. (2015) on the transcriptome of the brain of B. mori larvae infected with BmNPV, where its significance on mediating neuroactive steroids to activate membrane receptors had been discussed. Further, DEG-enriched binding activity in the GO classification emphasizes the prominent role of the neuroactive ligand–receptor interaction through various neurotransmitters (McEnery and Siegel 2014).
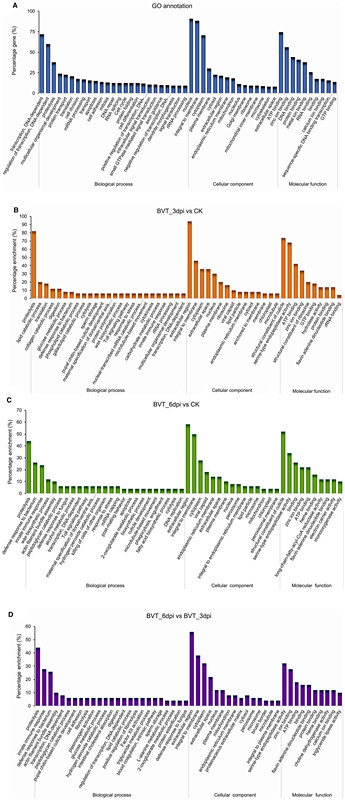
Figure 5. GO annotation and classification details. GO terms are summarized in three main categories of biological process, cellular component, and molecular function. The X-axis represents the percentage of genes involved in each term A GO annotation result of overall transcriptome classification B GO functional enrichment of DEGs between BVT_3dpi versus CK, C BVT_6dpi versus CK, D BVT_6dpi versus BVT_3dpi.
A total of 6032 unigenes were mapped onto 30 different KEGG pathways. Those pathways were categorized into five main categories as organismal systems, metabolism, genetic information processing, environmental information processing, cellular processes. The signal transduction pathway in the environmental information processing category was the most enriched pathway (487 genes) among all (Fig. 6A). Pairwise KEGG enrichment of DEGs showed the neuroactive ligand–receptor interaction pathway as the most enriched pathway in all comparisons, suggesting its active role in signaling process for the events during the process. Besides, ribosome, glycerolipid metabolism and glycerophospholipid metabolism in BVT_3dpi versus CK and PPAR signaling pathway, glycine, serine and threonine metabolism in BVT_6dpi versus BVT_3dpi were other enriched pathways (Fig. 6B–6D).

Figure 6. KEGG annotation and pathway classification A Overall classification of KEGG annotated unigenes, X-axis represents the percentage of genes involved. Y-axis is enlisted with different pathways in relation to the genes expressed. A number of genes associated with each pathway are listed on top of each histogram. B KEGG enrichment analysis of differentially expressed L. dispar transcripts in comparative bar-graph, down-regulated terms are shown in the left and up-regulated in the right side of the graph BVT_3dpi versus CK; C BVT_6dpi versus CK; D BVT_6dpi versus BVT_3dpi.
Furthermore, unigenes were matched with the eukaryotic clusters of orthologous groups (KOG database) resulting in 26 different functional categories. Among these, the largest category was 'General function prediction only' (1471 genes), followed by signal transduction mechanisms (1030 genes) and posttranslational modification, protein turnover, chaperones categories (683 genes). This is consistent with the KEGG analysis report for the active involvement of signal transduction pathways and suggesting stress conditions in the larvae during the period (Supplementary Figure S3).

Figure Supplementary Figure S3. KOG functional classification of L. dispar transcriptome. Y-axis represents a number of unigenes involved and X-axis denotes different categories of KOG functional groups.
-
The enrichment map of functional gene sets and their interactions showed five main clusters: RNA binding transcription, Extracellular space signaling, Starch/Drug/Other metabolisms, Plasma membrane calcium and the Structural constituent ribosome. Structural constituent ribosome cluster constituted of all downregulated pathways from CK to BVT_3dpi and to BVT_6dpi. Among metabolism clusters, all the pathways showed upregulated in BVT_6dpi compared to either CK or BVT_3dpi or both and intriguingly none of them showed upregulation from CK to BVT_3dpi. The extracellular space signaling cluster showed the involvement of the neuroactive ligand–receptor interaction signaling pathway involving glycine, serine, and threonine with serine-type endopeptidase activity in the extracellular space (Fig. 7).
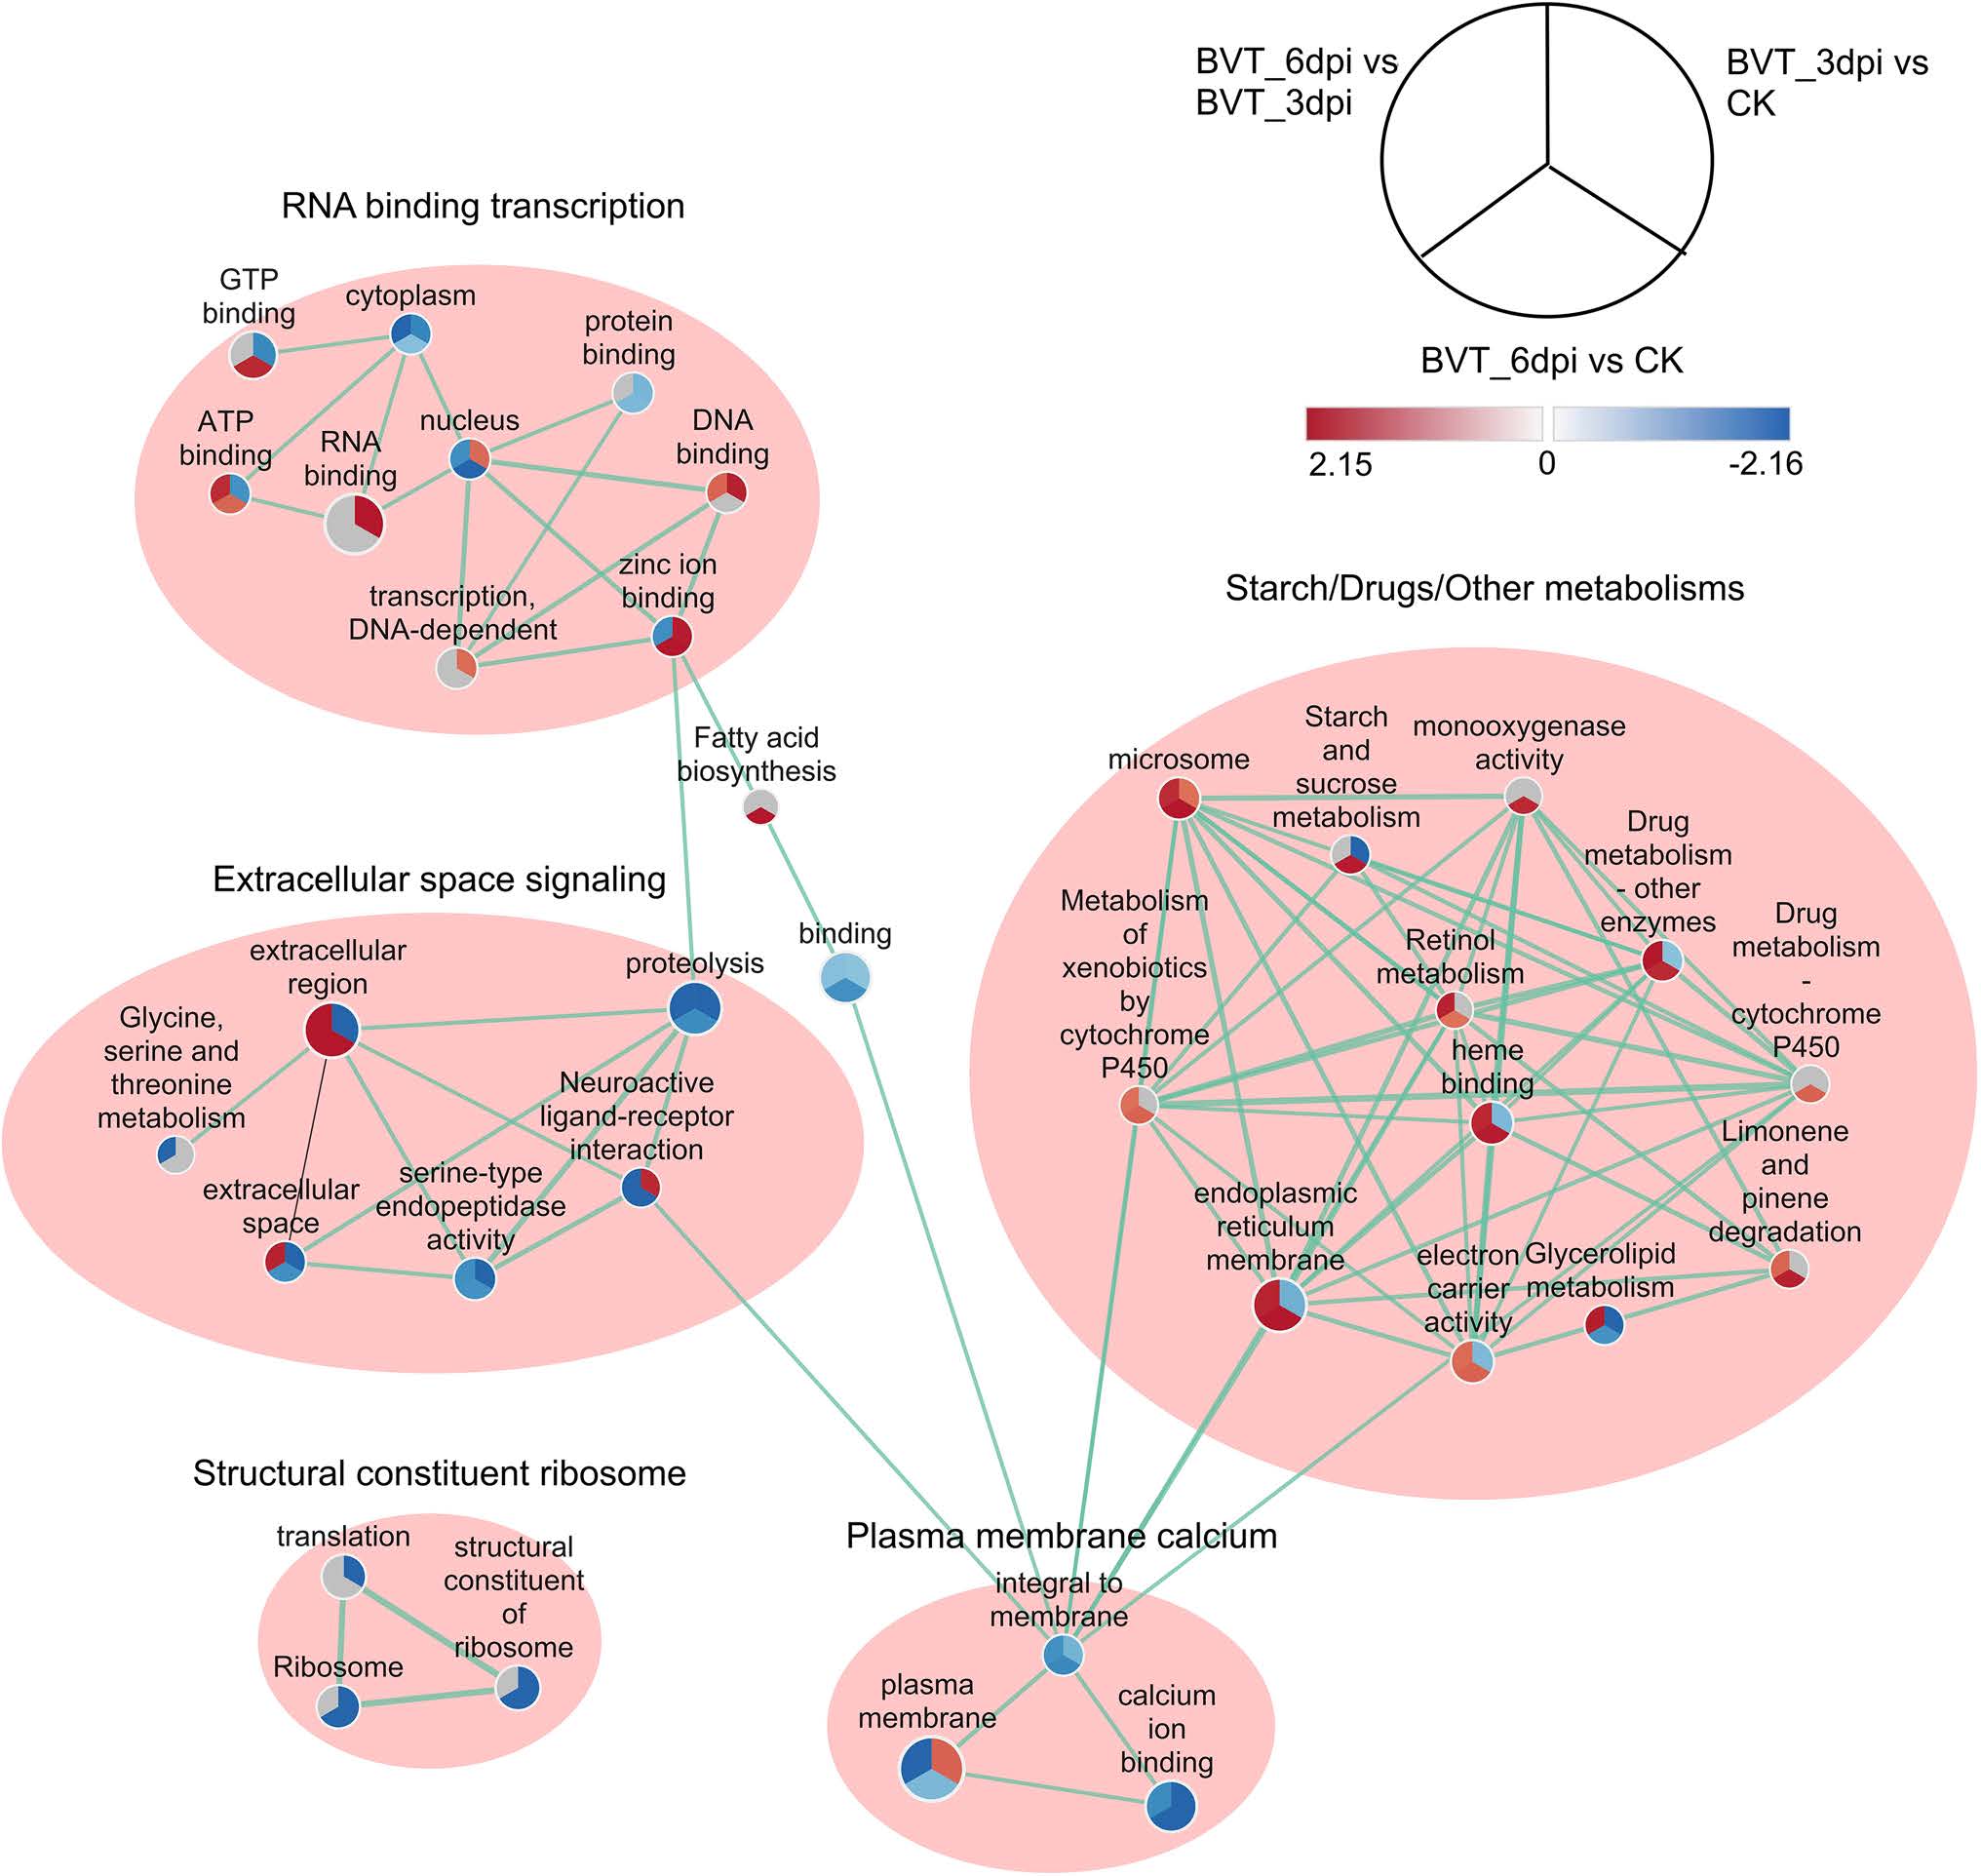
Figure 7. Enrichment Map representation of the ranked GSEA results obtained for comparative analysis between each permutation of CK, BVT_3dpi, and BVT_6dpi. Each node represents enriched GO/KEGG term and is divided into three parts representing each one to one comparison between samples as illustrated in legend their color and shading intensity represents the statistical significance of enrichment. The thickness of edges represents the richness of shared genes between connected nodes. Different clusters represent the biological meaning of involved pathways as depicted by Auto Annotate plugins of Cytoscape.
Signaling mechanisms have been implicated in various biological phenomena and has evolved as a master modulator of behaviors and function (Mobashir et al. 2012). The involvement of neuroactive ligand–receptor interaction is significant in our analysis, as the most DEGs enriched signaling pathway and a most differentially regulated pathway in all pairwise comparisons as well as its central role as a signal transduction mechanism in the extracellular space signaling cluster from the functional enrichment map. Therefore, our further analysis concentrated on the neuroactive ligand–receptor interaction pathway as the most involved signaling mechanism in the L. dispar larvae during this stage of LdMNPV infection.
-
The neuroactive ligand–receptor interaction pathway involves a collection of receptors on the plasma membranes, which transduce the signals from the extracellular environment into cells with various functions. Among eleven annotated signal transduction pathways, the neuroactive ligand–receptor interaction pathway was the most enriched with DEGs (Supplementary Table S1). Enrichment map visualization further supports the involvement of this pathway in interaction with serine-type endopeptidase and proteolysis activities within the extracellular region during the hyperactive stage of baculovirus infection. Indepth study of the significantly differentially regulated genes in this pathway showed us an interesting result in Drosophila, where it is involved in a dual function as a proteolytic extracellular domain to detach imaginal disc cells from extracellular matrices and also as a transmitter for outside to inside signal in its intracellular domain, to modify the cytoskeleton and facilitate cell shape changes underlying morphogenesis (Appel et al. 1993; Lemosy et al. 1999; Bayer et al. 2003). These findings correlate with our result from GO enrichment analysis where the extracellular region category was one of the most DEGs enriched. Furthermore, Sb isoform of trypsin was found to be induced by the molting hormone 20-hydroxyecdysone (20E) (Appel et al. 1993; Mirth 2005). This is the same hormone that was reported by Hoover and colleagues, which upon inactivation by the baculovirus encoded ecdysteroid uridine 50-diphosphate (UDP)-glucosyltransferase (EGT) induce tree-top disease in lepidopteran larvae (Hoover et al. 2011). So here, delay in molting of larvae upon baculovirus infection was apparent and was due to the inactivation of 20E (Buckmann and Tomaschko 1992; Cai et al. 2016). This thus resulted in downregulation of Sb, which further supports our observation from the GO enrichment analysis, where the structural constituent of the cuticle was the most downregulated category for BVT_3dpi and BVT_6dpi versus CK.

Table Table S1. Expression of genes between samples related to different signal transduction pathways.
Another serine protease, snake (snk) was up-regulated from CK to BVT_3dpi and continued with a similar expression level until BVT_6dpi. Its homologs have been found to be involved in extracellular protease cascades for signal transduction in Drosophila embryos (Steen et al. 2010). Along with products of genes easter, gastrulation defective this gene cleaves a cytokine-like protein, Spaetzl as a ligand for Drosophila Toll, which controls the dorsoventral patterning (Hecht and Anderson 1992; Stein and Nüsslein-Volhard 1992; Lemaitre et al. 1996). These serine proteases are venomous (Markland 1991; Rokyta et al. 2012; Danneels et al. 2015) and possess both fibrinogenolytic and fibrinolytic activities as in the case of the snake (Markland 1991).
The Hpn gene was up-regulated from CK to BVT_3dpi but down-regulated from BVT_3dpi to BVT_6dpi. Chymotrypsin-2 gene was highly down-regulated from CK to BVT_3dpi and partially recovered in BVT_6dpi (Table 2). Serine proteases have been found to be involved in activation of epidermal Na channel (ENaC) (Lin ChenYong et al. 1999; Fan et al. 2005) and the same Na channel was found to be responsible for enhanced locomotion in Drosophila (Ainsley et al. 2003; Gorczyca et al. 2014). The role of many other serine protease cascades in the epidermis has been extensively studied in recent years in humans and rodents and it has become clear that they play an important role in epidermal homeostasis and signaling cascades (Hooper et al. 2001; Ovaere et al. 2009). However, the in-depth functional studies of this protease relating to baculovirus infection during hyperactivity has not been done before. Nevertheless, these proteases being highly manipulated by baculovirus infection in our analysis during the course of the hyperactive stage are of significant importance to explore in the future to resolve this conundrum.

Table 2. Genes for neuroactive ligand–receptor interaction pathway from KEGG enrichment analysis of significantly differentially expressed genes among pairs.
-
Randomly selected nine DEGs with different expression patterns among samples were tested for their expression profiles with quantitative real-time PCR to confirm the credibility of the RNA-Seq data. The overall expression values showed consistency between the two methods and had a positive linear correlation (Supplementary Figure S4; Pearson correlation; BVT_3dpi versus CK, R2 = 0.7837, P < 0.01; BVT_6dpi versus CK, R2 = 0.7517, P < 0.01; BVT_6dpi versus BVT_3dpi, R2 = 0.8806, P < 0.001).
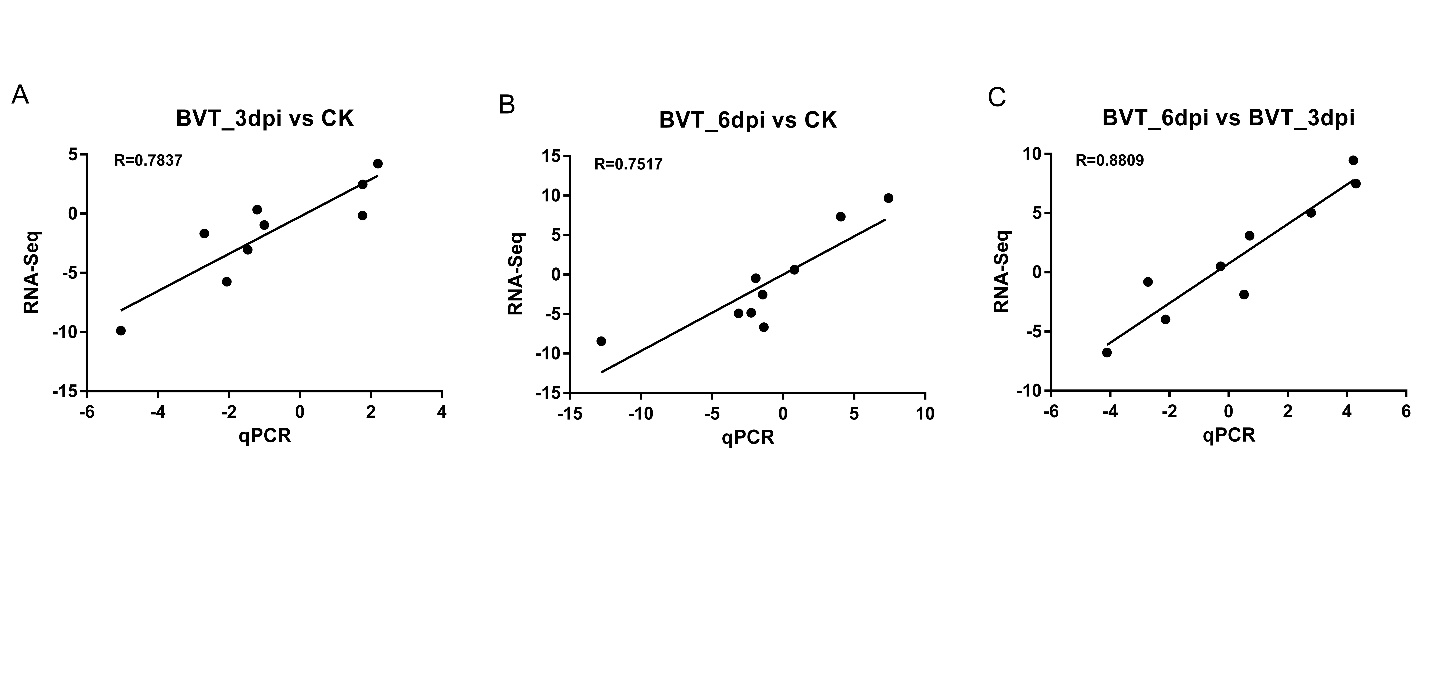
Figure Supplementary Figure S4. Validation of RNA-Seq data analysis by RT-qPCR. The nine genes differentially expressed at all time points were validated for their expression by RT-qPCR for CK, BVT_3dpi and BVT_6dpi. Overall, all time points showed consistency between the two methods in their expression trends.
Locomotion Assay
Sequencing and De Novo Assembly of the L. dispar Transcriptome
Differential Expression Analysis
Functional Annotations and Enrichment Analysis
GSEA and Visualization
Genes Involved in Neuroactive Ligand–Receptor Interaction Pathway
Validation of the Data by Quantitative RT-PCR
-
Overall, our results illustrate a complex response of L. dispar larvae during baculovirus infection and the challenges to identify candidate genes and pathways involved during the infection process. The serine proteases involved in neuroactive ligand–receptor interaction signaling pathway with peculiar expression pattern overtime during hyperactivity showed promising candidacy for the signaling mechanisms during disease progression in LdMNPV infected insects. We anticipate that further investigation of the genes involved and their coordinate response can reveal the complete picture of the host's reaction in response to infection during this stage of infection.
-
We thank Professor Liang-Jian Qu from the Chinese Academy of Forestry, Beijing, China, for generously providing gypsy moth eggs and LdMNPV. We also thank Dr. Huan Yu from Hunan Agricultural University for her inputs during experimental design. We would like to acknowledge Professor Christopher Rensing from Fujian Agriculture & Forestry University and Asst. Professor Dr. Xiangfeng Jing from Northwest A&F University for reviewing the manuscript. This study was supported by NSFC Grant (31670659), Special Fund for Forest Scientific Research in the Public Welfare (201404403-09) and Shaanxi Provincial Science and Technology Innovation Project (2014KTCL02-14).
-
Research design by DW, URB, the experiments were conducted by MKB, URB, LF, data were analyzed by URB, MKB, materials and lab conditions were provided by DW, Manuscript was written by URB, MKB, DW.
Acknowledgements
Author Contributions
-
The authors declare that they have no conflict of interest.
-
All institutional and national guidelines for the care and use of laboratory animals were followed.

 DownLoad: