


HTML
-
Acute gastroenteritis is the leading cause of morbidity worldwide especially among children under five years old and elderly population (Patel and Glass 2009). This is associated with important medical and healthcare costs. Foodborne viruses infect humans via gastrointestinal tracts and are excreted through feces, in a process known as fecal–oral route (Lee et al. 2013). Among these foodborne agents, norovirus (NoV), rotavirus (RV), adenovirus (AdV) and astrovirus (AsV) are considered the most important aetiological agents of acute non-bacterial gastroenteritis, transmitted by contaminated food and water (Phan et al. 2011; Amaral et al. 2015). Although nowadays the knowledge about viral foodborne diseases is extensive, the study of fecal–oral route is relatively recent. The first documented outbreak associated with food was in 1914, and the causative agent was recognized as poliovirus and transmitted through raw milk (Jubb 1915). This viral pathogen was later classified as a member of Picornaviridae family (Fenner 1976).
-
The picornavirus term (pico: small; rna: ribonucleic acid) was first introduced in 1963. This viral family includes virus of small size with single-stranded RNA (ssRNA) as genetic material and contains many important human and animal pathogens (Melnick et al. 1963; Melnick 1996). The family Picornaviridae belongs to the order of Picornavirales and consists in 94 species grouped into 40 recognized genera (Fig. 1) (Adams et al. 2017; King et al. 2018).
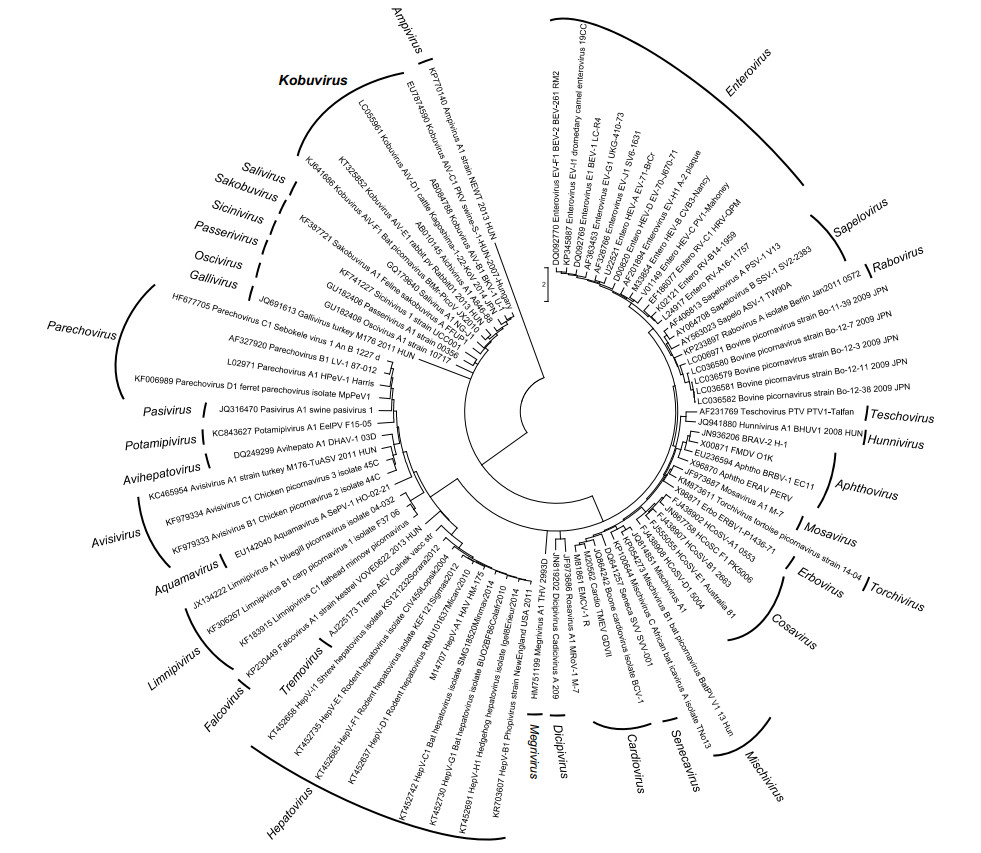
Figure 1. Phylogenetic tree, based on the P1 protein gene, showing the relationships among members of the family Picornaviridae. The maximum likelihood tree was constructed using MEGA 7.6. GenBank accession numbers of the reference strains used are detailed in the tree.
Within all of these recognized genera, this review is focused on Kobuvirus. It was classified as a new genus in 1999 (King et al. 1999). The name comes from the Japanese word 'kobu' that means bump, and it refers to the characteristic morphology of the virion that appears bumpy at the electron microscope (Yamashita et al. 2000). The first three official candidates of Kobuvirus were Aichi virus, Bovine kobuvirus and Porcine kobuvirus which were described on the basis of the host in which the viruses were detected.
Nowadays, the genus Kobuvirus consists in six recently renamed species: Aichivirus A (formerly Aichi virus), Aichivirus B (Bovine kobuvirus), Aichivirus C (Porcine kobuviru), Aichivirus D (kagovirus from black cattles), Aichivirus E (Rabbit picornavirus) and Aichivirus F (Bat kobuvirus) (Adams et al. 2017; Zell 2017). There are three tentative kobuviruses including caprine kobuvirus, Norway rat kobuvirus and a recovered viral genome from metagenomic sequences obtained from bat stool in Texas (USA) (Zell 2017).
Aichivirus A is divided in six types: human Aichi virus (AiV) (Yamashita et al. 1991), canine kobuvirus (Kapoor et al. 2011; Barros et al. 2019), murine kobuvirus (Phan et al. 2011), Kathmandu sewage kobuvirus (Ng et al. 2012), roller kobuvirus (Pankovics et al. 2014) and feline kobuvirus (Chung et al. 2013). The other species also display a certain degree of variability, 3 types having been described in Aichivirus B, and 2 types in the species Aichivirus C, Aichivirus D and Aichivirus F. Finally, three genotypes (Fig. 2) have been described within human Aichi virus (named A to C) (Ambert-Balay et al. 2008).
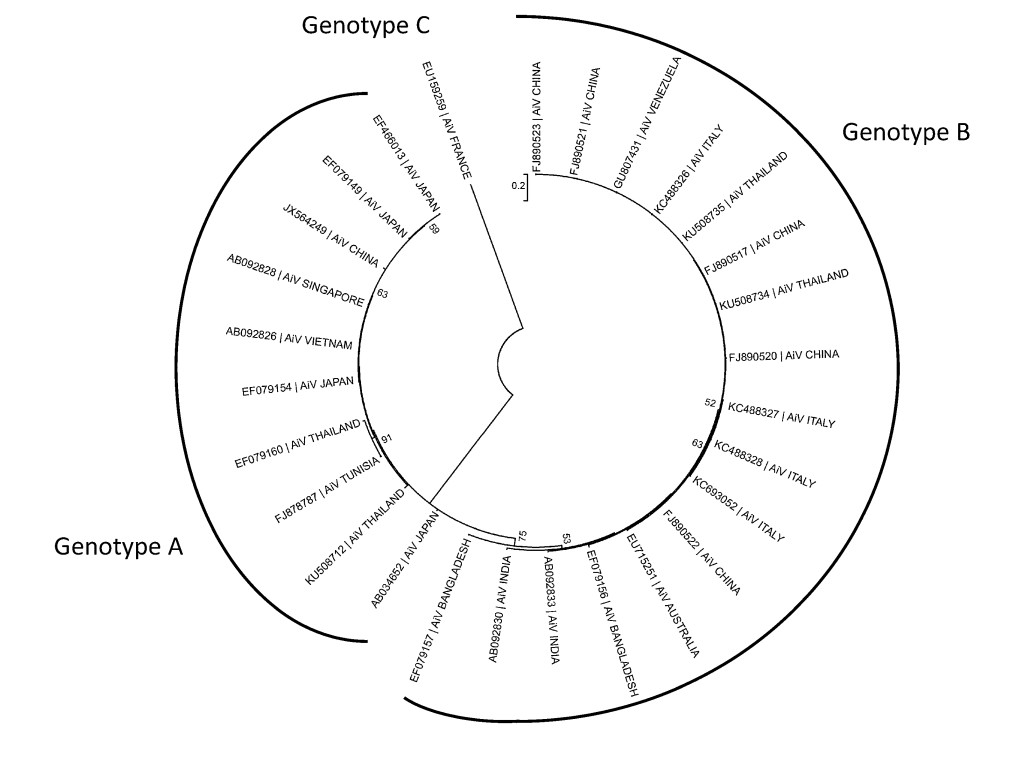
Figure 2. Phylogenetic tree, based on the P1 protein gene, showing the relationships among different genotypes of human AiV. The maximum likelihood tree was constructed using MEGA 7.6. GenBank accession numbers of the reference strains used are detailed in the tree.
AiV was first recognized and isolated in BSC-1 (kidney of normal adult African green monkey) cells in 1989 during the study of a gastroenteritis outbreak associated with oyster consumption in Japan (Yamashita et al. 1991, 1998). Some years later, in 1998, the complete genome sequence of AiV (GenBank accession no. AB040749) was described and classified as a novel picornavirus, at the Aichi Prefectural Institute of Public Health, in Japan (Yamashita et al. 2001). Outside Asia, the first detections of AiV in clinical specimens were reported in Europe (Germany) and South America (Brazil) (Oh et al. 2006).
-
AiV is a small non-enveloped virus with icosahedral morphology. The virions show a rough surface with around 30 nm in diameter at the electron microscopy. The capsid reveals some surface depressions like "canyon" which form the site of receptor binding in many picornaviruses (Tuthill et al. 2010; Dang et al. 2014; Wang et al. 2012). In vitro, AiV shows stability in acid conditions as low as pH 2 and is resistant to conventional methods of inactivation, including alcohols, heat, chlorine, high hydrostatic pressure, chloroform, non-ionic detergents and ether (Yamashita et al. 1998; Cromeans et al. 2014). Even more, AiV retained infectivity after 21 days at 4 ℃ in Cranberry juice and Cranberry juice cocktail (pH 3.0) (Sewlikar and D'Souza 2017).
-
AiV has a ssRNA with positive sense (8280 nucleotides), composed by a 5' untranslated region (UTR) of about 744 nucleotides with an internal ribosomal entry site (IRES) that allows direct translation of the polyprotein and a viral genomic protein (VPg) instead of a methylated nucleotide cap structure; an open reading frame (ORF) followed by 237 nucleotides of a 3' UTR region and a poly (A) tail (Fig. 3). The ORF is about 7.3 kb and encodes a polyprotein precursor of 2432 amino acids with a non-structural leader (L) protein at the N-terminus, followed by viral capsid proteins P1 (VP0, VP3 and VP1) and, non-structural proteins P2 (2A, 2B and 2C) and P3 (3A, 3B, 3C and 3D) that control the replication of AiV in the infected cells (Sabin et al. 2016; Zhu et al. 2016).
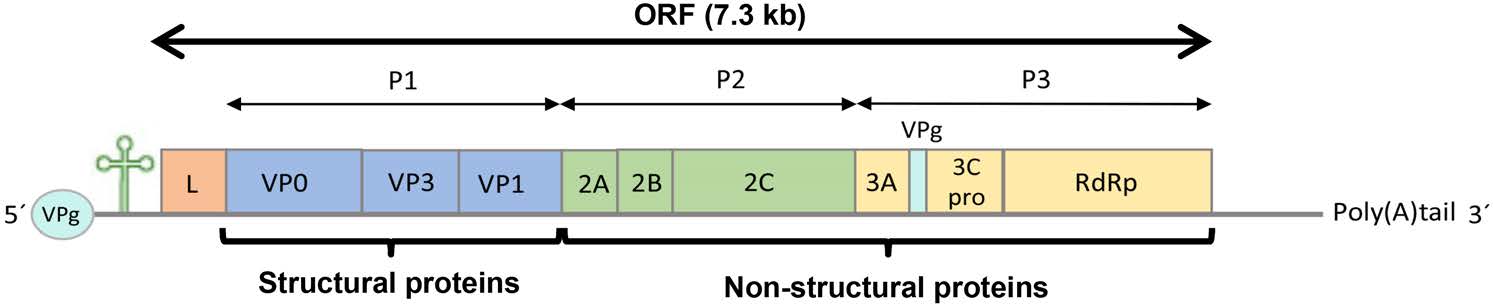
Figure 3. Schematic of the monopartite, linear, ssRNA (+) genome of AiV.
Capsid proteins adopt an eight-stranded antiparallel beta barrel configuration with a pseudo T = 3 symmetry (where T is the triangulation number), where VP0 and VP3 alternate about the two- and three-fold axes and VP1 surrounds the five-fold axes (Zhu et al. 2016). N-termini of the major capsid proteins are located inside of the capsid, and C-termini are at the virion surface. The three capsid proteins were described with weights of 42, 30 and 22 kDa (Yamashita et al. 1998).
VP0 capsid protein remains in the mature particles of AiV, in contrast with other picornaviruses. Also, the non-structural protein 2A and L protein have not shown protease or autocatalytic motifs as are detected in other picornaviruses and their functions remain unclear (Yamashita et al. 1998; Buesa and Rodriguez-Díaz 2016). On the other hand, the 2A protein contains conserved motifs that are charateistic of the H-rev107 family, which are involved in the cellular proliferation (Hughes and Stanway 2000). With regard to the other non-structural proteins, 2C, 3C and 3D regions are well aligned with the corresponding sequences of other picornavirus as Aphthovirus, Cardiovirus and Parechovirus. The 3B protein (VPg) of AiV is longer than other viruses of the same family, the 3C is the protease with conserved motifs characteristic of all picornaviruses, and the 3D region encodes the RNA-dependent RNA polymerase (RdRp) needed for viral replication (Yamashita and Sakae 2003). Furthermore, a complex formed with 2B, 2BC, 2C, 3A, and 3AB proteins, Golgi apparatus protein ACBD3 and phosphatidylinositol 4-kinase Ⅲβ (PI4KB) at viral RNA replication sites, enhancing PI4KB-dependent phosphatidylinositol 4-phosphate (PI4P) production, is crucial for AiV replication (Klima et al. 2017; McPhail et al. 2017; Ishikawa-Sasaki et al. 2018).
-
As other Picornaviridae members, AiV enter their host cells by receptor-mediated endocytosis (Fig. 4). After adsorption, the virus penetrates the cell through little known mechanisms that followed the stripping of virions and the release of viral RNA into the cytoplasm. Using ribosomes and other cellular proteins, the viral RNA (which is already mRNA), forms polyribosomes for the direct synthesis of a polyprotein.
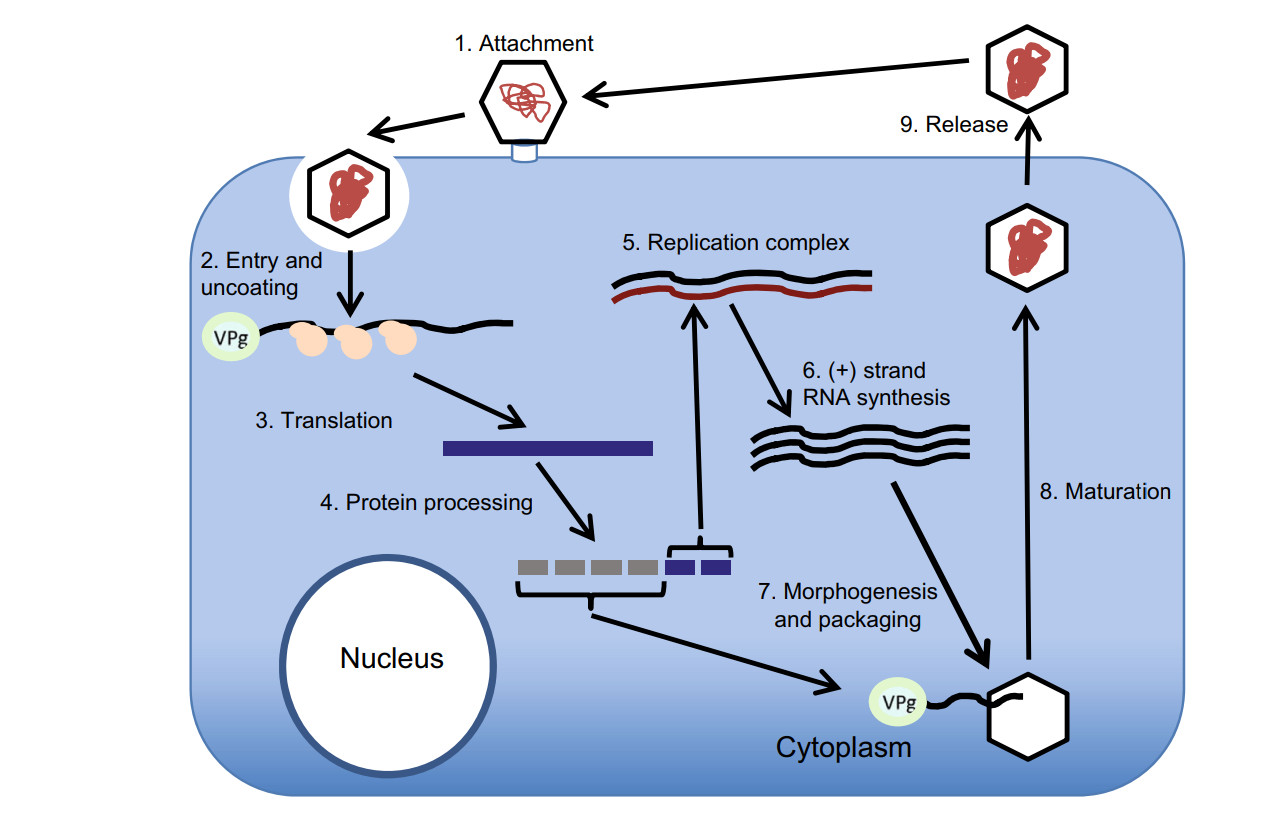
Figure 4. Schematic of the AiV life cycle.
The polyprotein is co- and post-translationally processed into the L protein, capsid proteins, mature nonstructural proteins and stable intermediates. These proteins modify the cellular environment and promote synthesis of RNA (-) required for the complement RNA (+). When the protein combination increases, also increases the number of RNA (+) in the replicative complex that will be encapsidated after joining VPg (Belov 2016; van der Schaar et al. 2016).
As a preliminary step in the assembly, one of the cover precursors (P1) is cut by viral proteinases to form a 5S subunit (immature promoter) composed of three protein aggregates (VP0, VP3 and VP1). The 5S subunit forms pentamers, 12 of which are required to form the 60 protein subunits of the capsid.
Once the maturation process has finished, the complete viral particles has 60 copies of each capsid protein, one copy of the RNA (+) genome and one copy of VPg; these often form crystals in the cytoplasm and are finally expelled to the outside by the lysis of the infected cell (Zell 2017).
-
Typing VP1 sequence is a suitable method for picornavirus classification (Oberste et al. 1999), but 3CD junction region has been also used for that purpose in AiV (Yamashita et al. 2000; Pham et al. 2007). A good correlation between both classifications has been reported for AiV genotypes (Ambert-Balay et al. 2008).
The first genetic differentiation of AiV genotypes was made by Yamashita et al. (2000). In that study the genetic relation among 17 AiV isolates was predicted by the comparison of 519 bases at the putative junction between the C terminus of 3C and the N terminus of 3D, and two groups were proposed: Group 1 or genotype A and group 2 or genotype B. Since then, 3 distinct genotype categories A, B and C were described (Ambert-Balay et al. 2008; Kitajima and Gerba 2015). Furthermore, several studies suggest some geographical distribution of AiV genotypes (Fig. 5).
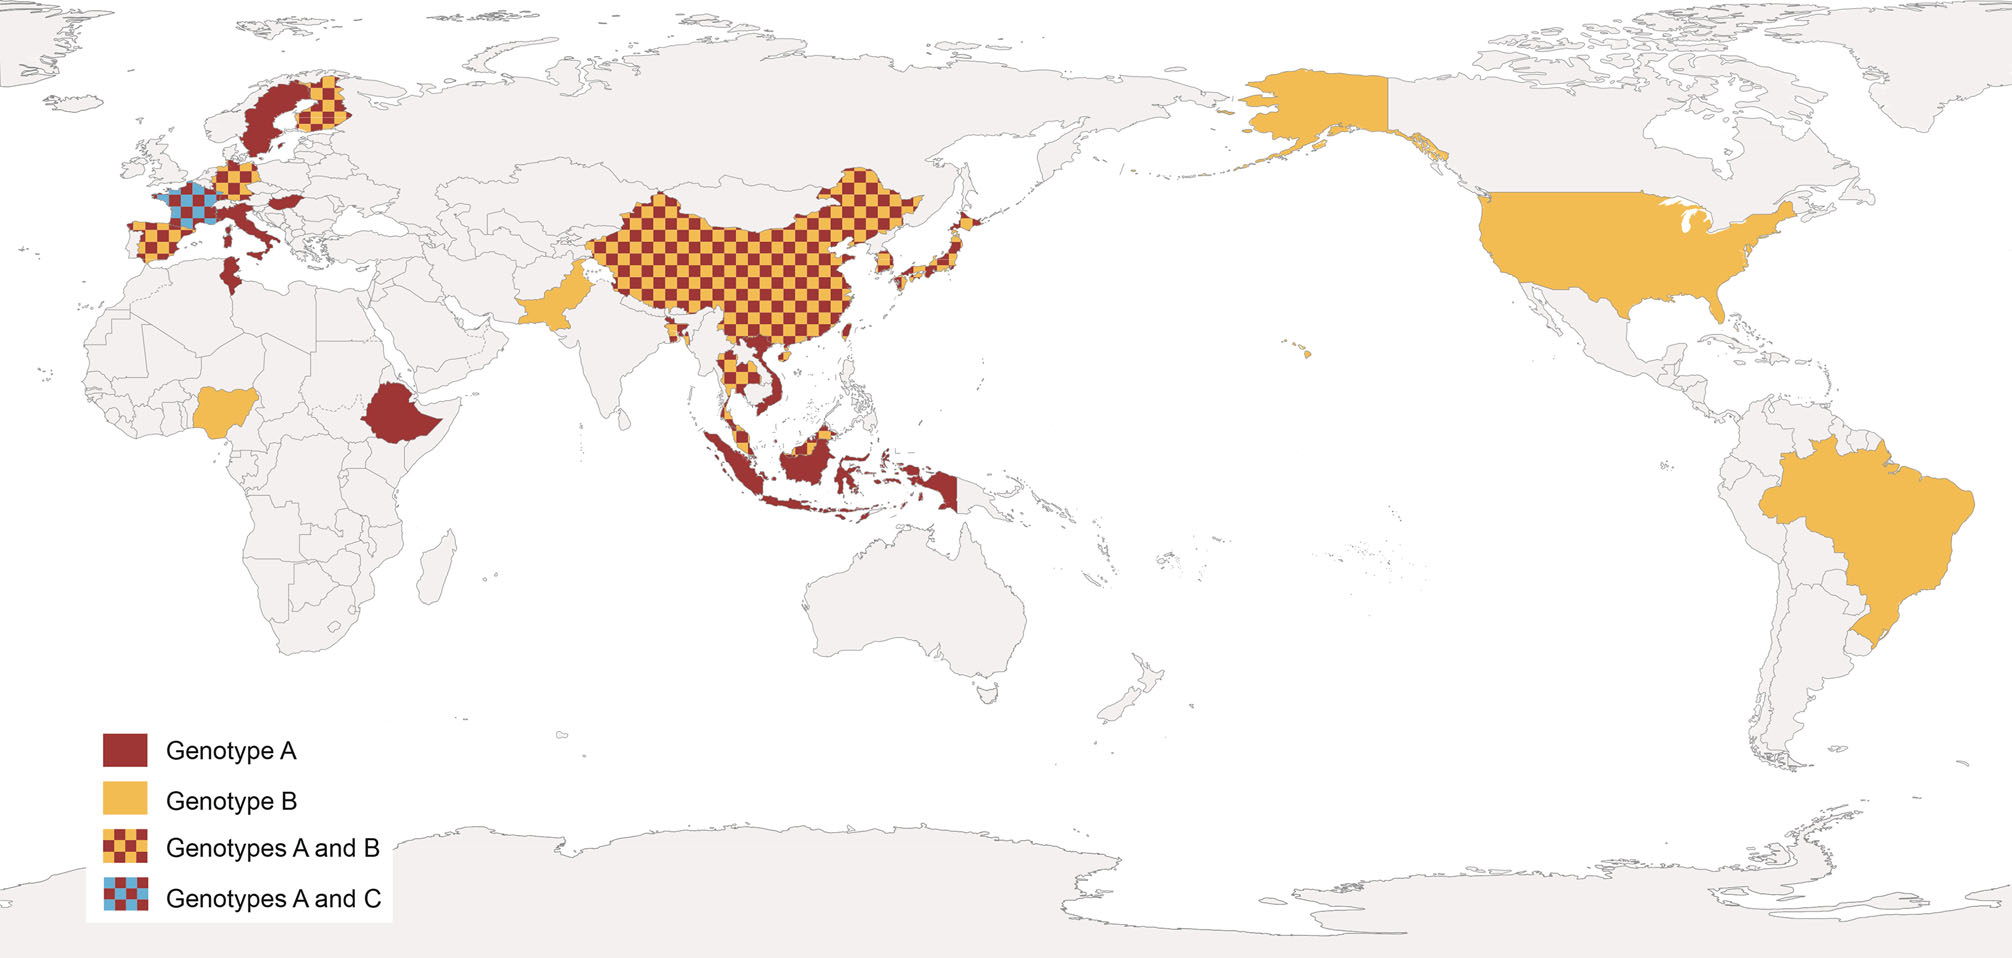
Figure 5. Worldwide distribution of human AiV genotypes. Data from AiV related gastroenteritis outbreaks and environmental samples.
Among human population, the presence of genotype A has essentially been reported in Asian countries. Thus, AiV A was detected in samples connected with 12 out of 37 gastroenteritis outbreaks in Japan (Yamashita et al. 2000), most of them associated with oyster consumption, showing prevalences up to 81% (Table 1). In addition, AiV A was detected in stool samples from travelers with diarrhea returning from India, Nepal, Thailand, Indonesia, Singapore and Vietnam, reaching percentage values of almost 100% of genotyped samples (Yamashita and Sakae 2003). Further investigations also reported the same genotype in fecal samples negative for RV, AdV, NoV, Sapovirus and AsV from patients with acute gastroenteritis from Vietnam, Thailand and Bangladesh (Pham et al. 2007).
Country Outbreak Year Source Positive rate (%)a Genotype References Japan 1 1987 Oysters 55.0 A Yamashita et al. (2000) 2 1988 Oysters 71.4 A 3 Oysters 81.8 A 4 1989 Oysters 80.9 A 5 School meal 64.3 A 6 1990 Oysters 50.0 B 7 Oysters 54.5 A 8 1991 Oysters 50.0 A 9 1994 Oysters 14.3 A 10 1997 Oysters 62.5 A 11 1998 Oysters 50.0 A 12 Oysters 33.0 A Germany 1 2006 NSb NS A Oh et al. (2006) France 1 2006 Oysters 50.0 A Ambert-Balay et al. (2008) 2 2006 Oysters 50.0 A 3 Oysters 17.0 A 4 2007 Oysters 100.0 A 5 Oysters 33.0 A 6 2007 Seafoodc 6.0 A aNumbers of fecal specimens positive/Numbers tested.
bNS, not specified.
cShellfish species not specified.Table 1. Features of the gastroenteritis outbreaks linked to AiV.
In Europe the presence of AiV A was reported for the first time in Germany, from stool samples of patients involved in a gastroenteritis outbreak (Oh et al. 2006). Afterwards the same genotype was found in France, in samples from children and adults involved in gastroenteritis outbreaks and hospitalized for acute illness (Ambert-Balay et al. 2008), in Finland from children under 5 years with gastroenteritis (Kaikkonen et al. 2010) and in a Hungarian sample from a 3 years old girl (Reuter et al. 2009). AiV A was also reported in elderly patients suffering from diarrhea, who were negative for AdV, RV, and calicivirus in Sweden (Jonsson et al. 2012) in Italy (Bergallo et al. 2017) and among different age groups from outpatients in Spain (Rivadulla et al. 2019). AiV A was also reported in Africa. It was detected in stool samples from inpatient and outpatient children collected in Monastir, Tunisia (Sdiri-Loulizi et al. 2009) and, more recently, in young children with watery diarrhea in Ethiopia (Aiemjoy et al. 2019).
AiV B was described at the same time as AiV A in samples from Japan but with less prevalence (about 16% of samples were genotyped as B) (Yamashita et al. 2000). However, places like China, Pakistan, Bangladesh or Malaysia has been reported AiV B from patients with gastroenteritis, in higher percentages than AiV A (reaching percentages of up 100%) (Pham et al. 2007; Yang et al. 2009; Li et al. 2017). On the other hand, in South Korea genotype prevalence is not clearly detected, since both genotypes were detected equally in stool samples from teenagers and adults (Han et al. 2014). In other places as Thailand, alternance of AiV A and AiV B as predominant genotypes along the time was observed (Yamashita et al. 2000; Saikruang et al. 2014; Chuchaona et al. 2017). In Europe, AiV B was also reported. In Finland and Spain AiV B was detected, but at lower prevalence than AiV A (Kaikkonen et al. 2010; Rivadulla et al. 2019). In Germany a genotype drift was detected, and AiV B seems to be more prevalent than in previous surveys (Drexler et al. 2011). AiV B was detected in stool samples from Brazilian children suffering diarrhea (Oh et al. 2006), and in North American children between 15 days and 5 years of age with symptoms of acute gastroenteritis (Chhabra et al. 2013). In Africa, AiV B was detected from one outpatient children in Nigeria (Japhet et al. 2018).
Only one survey reported AiV C from a stool sample of a child, hospitalized for gastroenteritis in France after a trip to Mali (Ambert-Balay 2008; Reuter et al. 2011). Further studies are needed to clarify the real impact of this genotype in human health.
Some investigations of in vivo evolution, based upon nt/aa changes through the complete genome, have been performed for porcine kobuvirus suggesting good adaptation of the virus-host relationship (Reuter et al. 2011). Such research have not been carried out for human AiV yet, but it would be very helpful to understand the virus-species and host-species spectrums.
-
Since AiV was discovered, various methods have been used to identify it (Table 2). Under electron microscopy, the viral particles have a distinct ultrastructure than other gastroenteritis pathogens as Sapovirus (SaV) or NoV, but there are not easy to distinguish from other small round viruses and could be wrongly be classified as an AsV (Yamashita et al. 1993). Although AiV have not shown cytopathic effect (CPE) in human cell lines as HeLa (Human cervix epitheloid carcinoma), HEL (Human Erythroleukemia Cell Line), RD (Human rhabdomyosarcoma Cell Line) cells or in newborn mice, AiV cause CPE on BSC-1 and Vero (both obtained from kidney of African green monkeys) cells (Yamashita et al. 1993). An enzyme-linked immunosorbent assay (ELISA) was also developed for the detection of AiV antigens in clinical samples using monoclonal antibodies (Yamashita et al. 1993).
Laboratory diagnostic method Advantages Disadvantages Electron microscopy Visualization of viral particles Labour and tedious. Useless for environmental samples Cell culture Variety of sensitive cell lines. Determination of infectivity. Quantitative (TCID50) Labour and tedious. Effect of inhibitors/contaminants ELISAa Sensitivity. Especificity Effect of inhibitors. Limited use for environmental samples LAMPb Sensitivity. Especificity. Rapidity. Isothermal conditions Detection of infective and non-infective particles. Effect of inhibitors RT-PCRc Sensitivity. Especificity. Rapidity Detection of infective and non-infective particles. Effect of inhibitors RT-nested PCR Sensitivity. Especificity. Valid for genotyping coupled with sequencing Detection of infective and non-infective particles. Effect of inhibitors RT-qPCRd Sensitivity. Especificity. Rapidity. Quantification Detection of infective and non-infective particles. Need of standard for quantification. Expensive Digital RT-PCR Sensitivity. Especificity. Rapidity. Absolute quantification Detection of infective and non-infective particles. Hard optimization. Expensive Pyrosequencing Sensitivity. Universal detection Complex sample processing and bioinformatic analysis. Expensive aELISA, enzyme-linked immunosorbent assay.
bLAMP, loop-mediated isothermal amplification.
cRT-PCR, reverse transcription-polymerase chain reaction.
dRT-qPCR, real time quantitative RT-PCR.Table 2. Laboratory diagnostic methods for AiV.
Reverse transcription-polymerase chain reaction (RT-PCR) is a widely employed method for AiV research. It is a sensitive method applicable for further genetic analysis as genotyping (Yamashita et al. 2000). As mentioned before, the 3CD junction region and VP1 region are suitable for differentiation of AiV genotypes. Nonetheless, no phylogenetic evidence of recombination has been reported between AiV genotypes A and B, suggesting that both genotyping methods are reliable (Lukashev et al. 2012; Kitajima and Gerba 2015). Nested PCR targeting the 3C, VP1, and VP3 regions, as well as multiplex semi-nested PCR on VP0-VP3 region were also developed for genotyping (Oh et al. 2006; Lodder et al. 2013).
Recently, Oshiki et al. (2018) reported a high-throughput detection and genotyping tool for RNA virus, like AiV, using a microfluidic device and next-generation sequencer. In this study the investigators reported detection limits ranging from 100 to 103 copies/μL in cDNA sample, corresponding to 101–104 copies/mL-sewage, 105–108 copies/g-human feces, and 102–105 copies/g-digestive tissues of oyster. Simultaneous detection and genotyping techniques are powerful tools for source tracking of human pathogenic viruses.
A loop-mediated isothermal amplification procedure was developed by Lee and coworkers (Lee et al. 2019), for rapid and specific detection of AiV from water samples. The whole protocol can be performed in 2–8 h showing equivalent AiV detection than conventional PCR.
-
Although conventional culture methods like 50% Tissue culture Infective Dose (TCID50) are used to quantify AiV, methodological advances in molecular biology lead to the development of better technologies. Reverse transcription- quantitative PCR (RT-qPCR) is nowadays the most employed method for AiV detection and quantification. The highly conserved 5'-UTR sequence is a common RT-qPCR target for picornavirus detection (Drexler et al. 2011; Nielsen et al. 2013). However, a RT-qPCR that amplifies the VP0 region, and could quantify and differentiate between genotypes A and B, was developed for determination of viral RNA load in clinical and environmental samples (Kitajima et al. 2013). This RT-qPCR consists in two amplifications: one that uses a universal primer pair that could amplify both genotypes and a universal probe to detect AiV. The second one uses the same primer pair but two different genotype-specific probes. Both methods, VP0 qPCR and 5'-UTR qPCR showed similar efficiency for AiV detection, with the advantage that VP0 qPCR is able to quantify and also differentiate the AiV genotypes.
Although, these techniques have been helpful to clarify the transmission sources of AiV among population, during the recent years, new detection technologies have been developed. Digital RT-PCR (RT-dPCR) is a precise endpoint-sensitive absolute quantification approach, capable of determine the number of target copies without a standard curve. As an example, AiV and eighteen enteric viruses more were targeted with this method and compared with RT-qPCR (Coudray-Meunier et al. 2016), the conclusions were that the limit of AiV detection for RT-dPCR assay was lower (7.8×10² genome copies/μL) than the limit of detection obtained with conventional RT-qPCR (1.0×10³ genome copies/μL). This new technology presents many advantages and possibilities for detection of enteric pathogens in environmental and clinical samples. The RT-dPCR divides each reaction mix across thousands of individual PCR reactions, making this method more tolerant to inhibitory substances and also reducing the difficulty of virus quantification (Pinheiro et al. 2012; Rački et al. 2014).
Detection Methods
Quantification Methods
-
Gastrointestinal illness is commonly associated with symptoms produced by enteric viruses but usually masked for the presence of other pathogens (Yamashita and Sakae 2003). AiV replicates in the gastrointestinal tract, resulting usually in symptomless infections. Diarrhea, abdominal pain, nausea, vomiting and fever are the clinical symptoms but pathogenesis of AiV releases more in subclinical infections than in clinically manifest diseases (Yamashita et al. 1991, 2001). These subclinical infections do not need healthcare attention and underestimate the real impact of AiV in human health (Bergallo et al. 2017).
Nowadays, the clinical role of AiV as gastrointestinal pathogen stills unclear. Some surveys support the idea that AiV produce the outbreaks in coinfection with other viruses, because its frequent codetection with other enteric pathogens. This idea is also supported for the low incidence rates (0.9%–4.1%) of AiV outbreaks (Kaikkonen et al. 2010; Jonsson et al. 2012; Nielsen et al. 2013). However, other studies showed high proportion of AiV monoinfections (Yang et al. 2009; Rivadulla et al. 2019), supporting the hypothesis that it is a gastrointestinal pathogen virulent enough to cause the need of medical are and hospitalization (Drexler et al. 2011; Chhabra et al. 2013).
When the illness appears is generally mild, lasting 48–72 h as is usual in this kind of enteric viruses (Carter 2005). AiV replicate and destroy the enterocyte layer covering the upper third of intestinal villi. That destruction of functional and mature cells interrupts the reabsorption of water and diarrhea ensues. As a response, villi get retracted and the absorption surface area decreases. Meanwhile, crypt cells undergo rapid division to repopulate the villi with immature cells resistant to the infection, but the younger cells can not replace the function of those that were infected because they require time to mature and diarrhea appears (Carter 2005). AiV is a cause of chronic infection in X-linked agammaglobulinemia and its prevalence in stool samples from patients with human immunodeficiency virus is high, indicating an opportunistic behavior in people with underlaying T cell defects (Oude Munnink et al. 2014; Portes et al. 2015; Bucciol et al. 2018).
The case of a Hungarian 3 years old girl is remarkable. The patient, positive for AiV (genotype A), showed rhinitis, purulent conjunctivitis and diarrhea and, after the first sampling day, she developed bronchopneumonia and fever with an elevated erythrocyte sedimentation rate (Reuter et al. 2009). In addition, the virus has also been associated with lower respiratory tract disease in Japan (Yamashita et al. 1993). These cases indicate the potential of AiV to cause extraintestinal disorders.
-
Human AiV consists in one single serotype. Virological surveys suggest that AiV is responsible for a low percentage (0.5%–1.8%) of gastroenteritis sporadic cases (Kitajima and Gerba 2015; Alcalá et al. 2018). However, high prevalence of antibodies against AiV (anti-AiV) was observed over the world.
The first seroprevalence study was carried out in Japan. In that survey the highest rate of anti-AiV was observed in adults of about 35 years old (Yamashita et al. 1993). Since then, several studies detected high levels of AiV seroprevalence worldwide and its correlation with the age of patients.
Several studies reported high percentages of AiV seroprevalence in Europe. In Germany, the percentages rise from 51%, in children aged from 0 to 3 years, to almost 100%, in patients > 40 years old (Oh et al. 2006). Similar results were achieved in France, where these percentages increased steadily from 25% in infants between 7 months to 9 years old to 85%–90% in patients older than 40 years, with no significant variations among age groups after age 40 (Goyer et al. 2008). In Spain, a significant increase of anti-AiV was observed up to the age of 30 years old, with the absence of a significant increase after that age (Ribes et al. 2010). Also, in the same study the percentage of anti-AiV observed was 100% in individuals over the age of 40 years old.
Serological studies carried out in Tunisia, revealed also a high prevalence of anti-AiV in humans of different age groups (Sdiri-Loulizi et al. 2009). As in the previous studies, the presence of anti-AiV throughout population increased with age raising from 68.8%, in patients between 6 months and 10 years old, to 100% in elderly patients between 71 and 89 years old. This same study showed no significant variations in seroprevalence in patients > 30 years old.
Considering all of these data, it is possible to conclude that the seroconversion to AiV occurs during childhood or adolescence, which may be indicating a role of AiV as a causative agent of pediatric diarrhea (Sdiri-Loulizi et al. 2009). Also, the high level of seroprevalence in adults showed in these surveys suggests a widespread exposure among human population to AiV.
Symptoms and Importance of Disease
Immunity
-
AiV was identified in water in 2010 (Alcalá et al. 2010). Since then, AiV was reported in high percentages in wastewater samples around the world (Table 3). Current treatments applied in wastewater treatment plants (WWTPs), cannot guarantee a total removal of viral pathogens that are continuously discharged to the environment (da Silva et al. 2007).
Countrya Positive Samples Sample type Genotype Copies/L References South Africa 10/12 Raw sewage NS NSb Onosi et al. (2019) Tunisia 10/125 Raw sewage A NS Sdiri-Loulizi et al. (2010) 4/125 Treated sewage A NS 51/102 Raw sewage B NS Ibrahim et al. (2017) US 24/24 Raw sewage A, B 1.2×10⁴–4.0×10⁶ Kitajima et al.(2014, 2018) 24/24 Treated sewage A, B 2.0×10³–4.0×10⁵ 1/1 Raw sewage NS NS Cantalupo et al. (2011) Iran 7/10 Raw sewage NS 2.1×10⁴–1.9×10⁶ Azhdar et al. (2019) 7/12 Treated sewage NS 4.2×10³–6.7×10⁵ Japan 137/207 Raw sewage A NS Yamashita et al. (2014) 12/12 Raw sewage A, B NS Kitajima et al. (2011) 11/12 Treated sewage A NS 12/12 Raw sewage A 1.4×10⁵–2.2×10⁷ Kitajima et al. (2013) 11/12 Treated sewage A Up to 1.8×10⁴ 11/12 Raw sewage NS NS Thongprachum et al. (2018) Nepal 1/1 Raw sewage NS NS Ng et al. (2012) 1/1 Raw sewage B NS Haramoto and Kitajima (2017) Thailand 1/1 Raw sewage NS NS Ng et al. (2012) France 61/100 Treated sewage NS Up to 103 Prevost et al. (2015) Italy 6/48 Raw sewage B NS Di Martino et al. (2013) Netherlands 16/16 Raw sewage A, B NS Lodder et al. (2013) Spain 1/1 Raw sewage NS NS Cantalupo et al. (2011) aCountries were ordered by continent and alphabetically within each continent.
bNS, not specified.Table 3. Worldwide detection of AiV in wastewater.
In Japan AiV was detected in high percentages (from 66.2% to 100%) in raw sewage samples, with viral concentrations ranging from 1.4×10⁵ to 2.2×10⁷ copies/L (Yamashita et al. 2014; Kitajima et al. 2011, 2013). Samples of treated sewage also analyzed showed an AiV prevalence of 91.7% (Kitajima et al. 2011). AiV detection in sewage showed no seasonality, being detected throughout the year (Thongprachum et al. 2018). In other Asian countries, as Nepal, Thailand or Iran, AiV was also reported from untreated sewage samples (Ng et al. 2012; Haramoto and Kitajima 2017; Azhdar et al. 2019). These studies supported the idea of use AiV as a human faecal pollution indicator, due its stability in wastewater and his lower removal percentages during wastewater treatments.
Other surveys detected AiV in Africa, America and Europe. In Africa, AiV was detected in Tunisia but at low prevalences. Thus, Sdiri-Loulizi et al. (2010) detected AiV in 10 out of 125 (8%) samples of influent water samples and 4 out of 125 (3.2%) treated sewage samples. On the other hand, Ibrahim et al. (2017) reported the virus in 51 out of 102 (50%) samples. Moreover, a recent study carried out in South Africa detected AiV in 10 out of 12 pooled sewage samples (Onosi et al. 2019).
In USA, AiV was detected in a sample of untreated wastewater collected from Pennsylvania (Cantalupo et al. 2011). Furthermore, another study carried out in two WWTPs of southern Arizona, detected AiV in all influent and effluent samples, with viral levels of 1.2×10⁴ to 4.0×10⁶ copies/L in influent samples and 2.0×10³–4.0×10⁵ copies/L in effluent samples (Kitajima et al. 2014). A clear predominance of AiV B was revelaed in these positive samples (Kitajima et al. 2018).
Finally, in Europe the percentages of detection vary. AiV was observed in sewage samples from France, the Netherlands and Spain with detection rates between 61 and 100% (Cantalupo et al. 2011; Lodder et al. 2013; Prevost et al. 2015). However, other analysis of untreated influent sewage samples collected from four WWTPs in Italy detected AiV in only 12.5% of the samples (Di Martino et al. 2013).
-
Surface water is infiltrated via spreading basins into aquifers and wells but, due to their small size and their survival capacity, viral pathogens like AiV are not totally removed during this natural filtration (Weiss 2005; Sharma and Amy 2010). Therefore, river water and groundwater are also possible reservoirs for AiV (Table 4).
Countrya Positive Samples Sample type Genotype Copies/L References US 1/2 Reclaimed water NSb NS Rosario et al. (2009) 7/12 Ground waterb NS 1.0×10²–1.5×10⁴ Betancourt et al. (2014) Venezuela 5/11 River water B NS Alcalá et al. (2010) Iran 15/28 River water NS 3.4×10²–5.9×10⁶ Azhdar et al. (2019) Japan 36/60 River water A + B NS Kitajima et al. (2011) 29/29 River water NS 8.6×10²–2.0×10⁴ Hata et al. (2014) 20/52 Surface water NS Up to 104 Hata et al. (2018) Nepal 14/14 River water B 1.2×10⁶–8.3×10⁸ Haramoto and Kitajima (2017) 11/37 Ground water B 5.6×10⁴–2.0×10⁶ 1/1 Tap water B 109 France 20/175 River water NS Up to 102 Prevost et al. (2015) Netherlands 12/14 River water A + B NS Lodder et al. (2013) aCountries were ordered by continent and alphabetically within each continent.
bNS, not specified.Table 4. Worldwide detection of AiV in river, surface and ground waters.
Although AiV had been previously detected in tap water in USA (Rosario et al. 2009), the first study conducted to determine the occurrence and circulation of AiV in river water was carried out in Venezuela. In this study, AiV was detected in 5 out of 11 samples (45%) (Alcalá et al. 2010). Other survey carried out in Japan for a longer period detected AiV in 36 out of 60 samples (60%), demonstrating a higher detection frequency for AiV than for other enteric virus, like NoV or SaV is the same set of river samples (Kitajima et al. 2011). Hata et al. (2014), investigating the effects of rainfall events and water quality on viral occurrence, detected AiV in all the tested samples with relatively higher frequency of detection and concentration (ranging from 1.2×10⁶ to 8.3×10⁸ copies/L) than other enteric viruses. More recently, the same authors detected AiV in 20 out of 50 surface water samples in Japan (Hata et al. 2018).
In Nepal, AiV was detected from river water, groundwater, tap water in a house supplied by tanker water, and from a sewage pipe (Haramoto and Kitajima, 2017). In this study, differences in AiV detection were observed, and a high prevalence of AiV B was reported. The frequence of AiV detection was significantly higher in shallow dug wells, where AiV was found in 10 out of 22 samples (45%) than in shallow tube wells, in which AiV was found in 1 out of 15 samples (7%). In accordance with the study, this could be happened due to the vulnerable structure of dug wells, which are usually made of brick or stone, than tube wells. On the other hand, a recent study from Iran reported the detection of AiV in 50% of the river water samples analyzed (Azhdar et al. 2019).
The first study for AiV detection in groundwater was performed in USA for the assessment of the occurrence and elimination of virus at a full-scale managed aquifer recharge system (Betancourt et al. 2014). In this study, the concentration of AiV was up to 1.52×10⁴ copies/L. Recent environmental studies have demonstrated a high prevalence of AiV in different types of water samples, such as river and groundwater (Kitajima and Gerba 2015).
There are also some surveys that reported AiV from river samples in Europe. In France, 20 out of 175 river water samples were positive for AiV with up to 102 copies/L concentration levels (Prevost et al. 2015). In the Netherlands, AiV was also detected in 12 out of 14 river water samples (Lodder et al. 2013). The importance of that pathogen in this kind of samples is not well understood and more investigation will be needed to evaluate the real impact of AiV. Recently, Bonadonna et al. (2019) reported for the first time the presence and abundance of AiV in marine bathing waters in the Adriatic and Tyrrhenian Seas (Italy).
-
Bivalve molluscs are associated with viral foodborne disease (Vossen 2001) as they obtain their food filtering small particles suspended in water. Often in these processes, molluscs concentrate and retain pathogens including enteric viruses (Romalde et al. 1994). These viruses are underestimated in molluscan safety controls that are based only on bacterial indicators, becoming this kind of food as a vector for enteric viruses transmission (Polo et al. 2015).
From its first detection, AiV has been suggested as an important etiological agent of gastroenteritis especially in outbreaks associated with contaminated seafood (Table 5) (Yamashita et al. 1991). In Japan, a one-year study carried out between 2005 and 2006, reported AiV A from clam samples, with a prevalence of 73% (Hansman et al. 2008).
Countrya Positive Samples Sample type Genotype Copies/L Reference South Africa 8/12 Mussels NSb NS Onosi et al. (2019) Tunisia 4/60 Shellfish (NS) A NS Sdiri-Loulizi et al. (2010) Japan 19/26 Clams A NS Hansman et al. (2008) France 6/66 Oysters NS NS Le Guyader et al. (2008) Italy 13/108 Mussels NS Up to 102 Fusco et al. (2017) 3/170 Mussels, Oysters, Clams A, B NS Terio et al. (2018) Spain 15/249 Mussels, Clams, Cockles NS NQc— 6.9×10³ Rivadulla et al. (2017) aCountries were ordered by continent and alphabetically within each continent.
bNS, not specified.
cNQ, non quantifiable (under the limit of quantification of the method).Table 5. Worldwide detection of AiV in shellfish.
Other studies reported AiV from shellfish samples worldwide. In Tunisia, Sdiri-Loulizi et al. (2010) reported an AiV prevalence of 4% in shellfish. Aditionally, the phylogenetic analysis revealed several clusters that occurred sequentially in time, pointing out some parallelism in the temporal shifts among environmental and human strains. On the other hand, Onosi et al. (2019) observed prevalence up to 66.6% in mussels from South Africa.
In France, other study detected AiV in oysters that were linked to a gastroenteritis outbreak and the AiV sequences obtained where similar to those from stool samples analyzed in parallel (Le Guyader et al. 2008). More recently, AiV has been detected from shellfish in Spain and Italy (Fusco et al. 2017; Rivadulla et al. 2017; Terio et al. 2018), with prevalence ranging from 1.7 to 12%.
Wastewater
River Water and Groundwater
AIV in Shellfish
-
As mentioned above, non-human Aichivirus have been described from different animal species, including some types of Aichivirus A, and those included in species Aichivirus B to Aichivirus F. All of them had a standard picornavirus genome organization and sequence homology to human Aichivirus A (Otomaru et al. 2016), with the exception of Aichivirus C, which possesses a type Ⅳ IRES instead of the typical type Ⅴ IRES present in the other Kobuvirus species.
Animal Kobuvirus can be transmitted directly by physical contact, or indirectly through water and food by the faecal-oral route (Reuter et al. 2011). Using Bayesian phylogenetic methods, evidences has been obtained for transmission between different host taxa along Kobuvirus evolution, including host jumps from artiodactyla (sheep) to carnivora (ferret), from bats to rabbits, or from carnivora to birds and humans (Lu et al. 2018). In addition, evidences of zoonotic infection or interspecies transmission of bovine kouvirus to pig was documented (Kharim et al. 2010), suggesting that close contact among different animal species may increase the possibilities of interspecies transmission. However, further investigations over larger geographical scales and in other host species will be needed to clarify the evolutionary connections and host jumps.
-
Since the first documented outbreak associated with food, it has become evident the importance of viruses as pathogens that cause alimentary illness. Also, the ineffectiveness of the current mechanisms of microbiological control in seafood, from a virological point of view, as well as the current vulnerability of our global food market are key factors in the appearance of outbreaks (Polo et al. 2010).
Our awareness of the risk associated to AiV as an etiological agent of gastroenteritis is increasing in the last years. As for other viruses, AiV stability allows its persistence stay in the environment for long periods, as well as its transmission to humans by ingestion of contaminated water and molluscs.
Although until now AiV is responsible for a low percentage of reported gastroenteritis outbreaks, the high seroprevalence shown by human populations indicates an evident role as an enteric agent. The low percentage of AiV detection could be explained by the lack of a routinary method for AiV screening, although the fact that the pathogen may be more associated to asymptomatic infections could not be ruled out. However, the methodological advances in molecular biology lead to the development of new technologies that improve the detection of these pathogens. Furthermore, these new methodologies are also lighting the investigation to clarify the transmission routes of AiV infection, solving the limitations of the classical detection methods.
In summary, further studies are needed in order to know the full spectrum of clinical symptoms of AiV, as well as the burden of AiV disease in humans not only to improve our understanding of their clinical significance but also to determine the necessity of preventive measures, including specific vaccine development.
-
Prof. Jesús L. Romalde acknowledges the support of Consellería de Educación, Universidade e Formación Profesional, Xunta de Galicia, Spain (Grant 2014-PG110), that funded the research that generated part of the results presented here.
-
The authors declare that they have no conflict of interest.
-
This article does not contain any studies with human or animal subjects performed by any of the authors.

 DownLoad: