


HTML
-
Coronavirus Disease 2019 (COVID-19), which is caused by the severe acute respiratory syndrome coronavirus 2 (SARS-CoV-2), has become a great threat to global health since its first outbreak in December, 2019 (Velavan and Meyer 2020). Along with the fast spread of SARS-CoV-2, researchers found that pediatric patients seemed to display milder symptoms as well as better prognosis than adult patients (Ludvigsson 2020; Su et al. 2020), which prompted us to wonder whether the immunological features of children with COVID-19 were different from adults.
In this paper, we collected the clinical features and laboratory findings of children with COVID-19, and then detected the cytokine/chemokine levels, T cell immune responses and antibodies specific for SARS-CoV-2 receptor-binding domain of spike glycoprotein (S-RBD) or nucleocapsid protein (N) in different phases after disease onset, displaying a detailed description of the immunological profile of children with COVID-19.
-
This study enrolled 19 children with COVID-19 which were admitted to the Children's Hospital of Fudan University from January 19th, 2020 to April 8th, 2020. All 19 patients were confirmed to be infected with SARS-CoV-2 by using real-time quantitative reverse transcription PCR performed by local centers for disease control and prevention (CDC). The clinical information of the patients were all collected from the electronic medical records in the hospital. None of them had respiratory distress, organ failure, shock or other severe manifestations, and none of them required mechanical ventilation or supplemental oxygen. Age- and gender-matched healthy controls (n = 18) with no exposure to SARS-CoV-2 were also included.
-
Cytometric bead array (CBA) kits were used to detect 14 cytokines/chemokines, among which 7 analytes including IL-5 (BD#558278), IL-3 (BD#558355), IL-7 (BD#558334), IL-8 (BD#558277), IL-13 (BD#558450), MCP1 (BD#558287) and IP10 (BD#558280) were detected using ordinary BD CBA kits, 4 analytes including IL-1β (BD#561509), IL-4 (BD#561510), TNF (BD#561516) and IFN-γ (BD#561515) were detected using enhanced sensitivity (ES) BD CBA kits, 3 cytokines including IL-2, IL-6 and IL-10 were detected using human Th1/Th2 assay kit purchased from Cell-gene Bio-Engineering Co., Ltd (Hangzhou, China). Serum IL-16 was tested by ELISA (R&D#D 1600). All cytokine/chemokine detection was performed according to the manufacturer's instructions.
-
PBMCs were isolated from whole blood cells using Ficoll media purchased from Haoyang Bio-Manufacture CO., LTD (Tianjin, China). Staining fixable viability stain 780 (BD#565388) was added into the cell suspension at 1:1000, followed by an incubation with human Fcblock (BD#564220). Surface markers were stained using CD3-PerCP-Cy5.5 (BD#560835), CD4-PE-Cy7 (BD#560649), CD8-BV510 (BD#563256), CD25-PE (BD#557138), CD127-AF647 (BD#558598), CD45RA-APC (BD#550855) and CCR7-FITC (BD#560548). For intracellular staining, cells were fixed and permeablized using BD CytoFix/CytoPerm Kit (BD#554715) and then the cytokines were stained using IL-4-APC (BD#560671), IFN-γ-FITC (BD#554700), TNF-α-BV421 (BD#562783), and IL-17-PE (BD#560487), before the final flow cytometry assay using BD CantoII. Raw data of flow cytometry was analyzed by FlowJo software.
-
SARS-CoV-2 S-RBD or N protein-specific total antibody, IgG, IgM and IgA in sera were detected by a chemiluminescent immunoassay performed by Shanghai Kehua Bio-Engineering Co., Ltd. The actual volume of serum used in antibody detection was 50 μL for total antibody, 10 μL for IgM, and 1 μL for IgG and IgA. The cut-off values were set at triple means of the RLU values of uninfected controls.
COVID-19 Patients
Serum Cytokine/Chemokine Detection
T Cell Immune Response Assay
SARS-CoV-2-Specific Antibody Detection
-
GraphPad Prism 6 software was used to present the graphs and analyze the statistical meaning of the data. Cytokines/chemokines and antibodies were statistically analyzed using Mann–Whitney U test, while T cell subsets were analyzed using students' t test. A P value < 0.05 was considered to be significant.
-
All of the patients recovered and were discharged from the hospital. The median age of the enrolled patients was 9 years and nine (47%) of them were male. As shown in Table 1, the initial clinical signs were cough (47%), fever (37%) and pneumonia (58%). Laboratory tests of the patients were performed within 2 days after admission. The counts of white blood cells (WBC), neutrophils and lymphocytes were relatively normal, with only one patient having lymphopenia and three having neutropenia. As for inflammatory indicators, two patients (11%) had increased erythrocyte sedimentation rate (ESR) and three (16%) had increased procalcitonin (PCT), C-reactive protein (CRP) and interleukin (IL)-6 respectively. Notably, there was only one patient who had all higher ESR (34 mm/h), PCT (0.07 ng/dL), CRP (15 mg/L) and IL-6 (24.77 pg/mL). Total globulin was higher in 8 patients (42%) and 6 of 13 patients showed higher total IgE. Besides, 8 of 12 patients had increased D-dimer levels.
Value Local normal range Age-Median(range) 9 year (7 m–13 year) – Sex-Male/Female 9/10 – Clinical features-No. (%) Fever 7 (37%) – Cough 9 (47%) – Sore throat 5 (26%) – Rhinorrhea 7 (37%) – Pneumonia (by X-ray or CT) 11 (58%) – Laboratory findings-Median(range) WBCs × 109/L 5.5 (3.2–16) – 29 d–3 y 7.95 (6.4–8.7) 6–12 > 3 y 4.8 (3.2–16) 4–10 Hemoglobin (g/dL) 134 (4.7–168) 110–160 Platelets × 109/L 265 (128–404) 100–400 Neutrophils × 109/L 2.9 (1.15–11.2) – 29 d–3 y 2.22 (1.67–2.90) 2.4–4.8 > 3 y 3.51 (1.15–11.2) 2.0–7.0 Neutrophils (%) 47.1 (25.3–75) – 29 d–3 y 28.2 (25.2–43.4) 30–40 > 3 y 50.2 (27.3–75) 50–70 Lymphocytes × 109/L 2.34 (1.17–5.9) – 29 d–3 y 5.05 (4.5–5.9) 4.0–8.4 > 3 y 2 (1.17–4) 1.2–4.0 Lymphocytes (%) 42 (17.5–69.8) – 29 d–3 y 63.25 (48.5–69.8) 50–70 > 3 y 41 (17.5–66.9) 30–40 Procalcitonin (ng/dL) 0.04 (0.02–0.12) < 0.05 C-reactive protein (mg/L) 5.11 (0.5–35) < 8 IL-6 (pg/mL) 4.465 (0.91–24.77) < 7 Erythrocyte sedimentation rate (mm/h) 14 (4–39) 0–26 Alanine transaminase (U/L) 16.5 (6.9–100) 7–50 Aspartate aminotransferase (U/L) 28.9 (15.4–142) 13–40 Urea (mmol/L) 3.6 (1.97–5.7) 2.8–7.6 Creatine kinase-MB (U/L) 21.4 (12.3–51.9) < 25 Lactate dehydrogenase (U/L) 220 (156–383) 110–430 Myohemoglobin (μg/L) 9 (6–11) 10–46 Total protein (g/L) 74.3 (59–85.6) 60–80 Albumin (g/L) 44.9 (38.8–51.1) 40–55 Globulin (g/L) 28.6 (17.9–35.1) 20–30 IgG (g/L) 11.8 (9.9–14.5) 3.5–14.26 IgA (g/L) 1.4 (0.44–2.56) 0.06–2.5 IgM (g/L) 1.28 (0.76–2.35) 0.36–2.16 Total-IgE (IU/ml) 73.12 (7.91–1134.01) < 100 D-dimer (mg/L) 0.58 (0.33–1.02) 0–0.5 COVID-19, Coronavirus Disease 2019; CT, computed tomography Table 1. Clinical features and laboratory findings of children with COVID-19.
-
Considering that most of children recovered within 2 weeks after disease onset, we divided the disease course into acute phase (0–3 days after onset), middle phase (4–10 days after onset) and convalescent phase (11–27 days after onset). As shown in Fig. 1, the IFN-γ-induced protein 10 (IP10) was increased markedly at the onset of the disease and mostly went back to normal as early as in middle phase (Fig. 1A). The other three chemokines, monocyte chemoattractant protein 1 (MCP1), IL-7 and IL-8, didn't show significant increase in patients (Fig. 1B–1D). A peculiar chemokine, IL-16, which was found to be related with virus infection (Sampson et al. 2017), was strikingly increased in patients during acute phase and didn't show a downward trend even in convalescent phase (Fig. 1E).

Figure 1. Serum cytokine/chemokine levels of children with COVID-19. Serum cytokine/chemokine expression of children with COVID-19 during acute phase (n = 19), middle phase (n = 10) and convalescent phase (n = 14) were detected by CBA assay or ELISA. The horizontal line represented medians with interquartile range. Results were analyzed by Mann–Whitney U test. P < 0.05 was considered of significant difference.
Pro-inflammatory cytokines including TNF, IFN-γ, IL-6 and IL-1β didn't change prominently in all three phases (Fig. 1F–1I). But IL-10, which is an anti-inflammatory cytokine, was obviously elevated in acute phase and remained higher than the healthy controls in convalescent phase (Fig. 1J). No significant changes were observed in another Th2 cytokine, IL-4, and the T cell growth factor, IL-2 (Fig. 1K, 1L). Other cytokines (IL-3, IL-5 and IL-13) in sera were lower than the detection limit (data not shown).
-
Although no remarkable changes were observed in the surface markers of T cells (CD3, CD4, CD8) in acute phase (Fig. 2A, 2B), we found a statistically significant increase in T helper (Th) 2, as well as mild elevations in Th1 and Th17 (no statistical meaning), suggesting a Th2-dominant immune response shortly after disease onset (Fig. 2C). Additionally, regulatory T cell (Treg), which confers immunosuppressive role, was apparently suppressed in patients during acute phase (Fig. 2C). In convalescent phase, we observed a diminished percentage of CD8+ T cells and CD3+ T cells (Fig. 2E). Moreover, after the major elevation of Th2 in acute phase, the Th subsets tended to be on a downward trend with Th1 being reduced mostly (Fig. 2F). Besides, Both Th2 and Treg returned to normal in convalescent phase (Fig. 2F). Unexpectedly, the cytotoxic lymphocytes (CTL) response didn't seem to be activated since the TNF-α-producing and IFN-γ-producing CD8+ T cells in acute (Fig. 2D) and convalescent phases (Fig. 2G) were both comparable to the healthy controls.
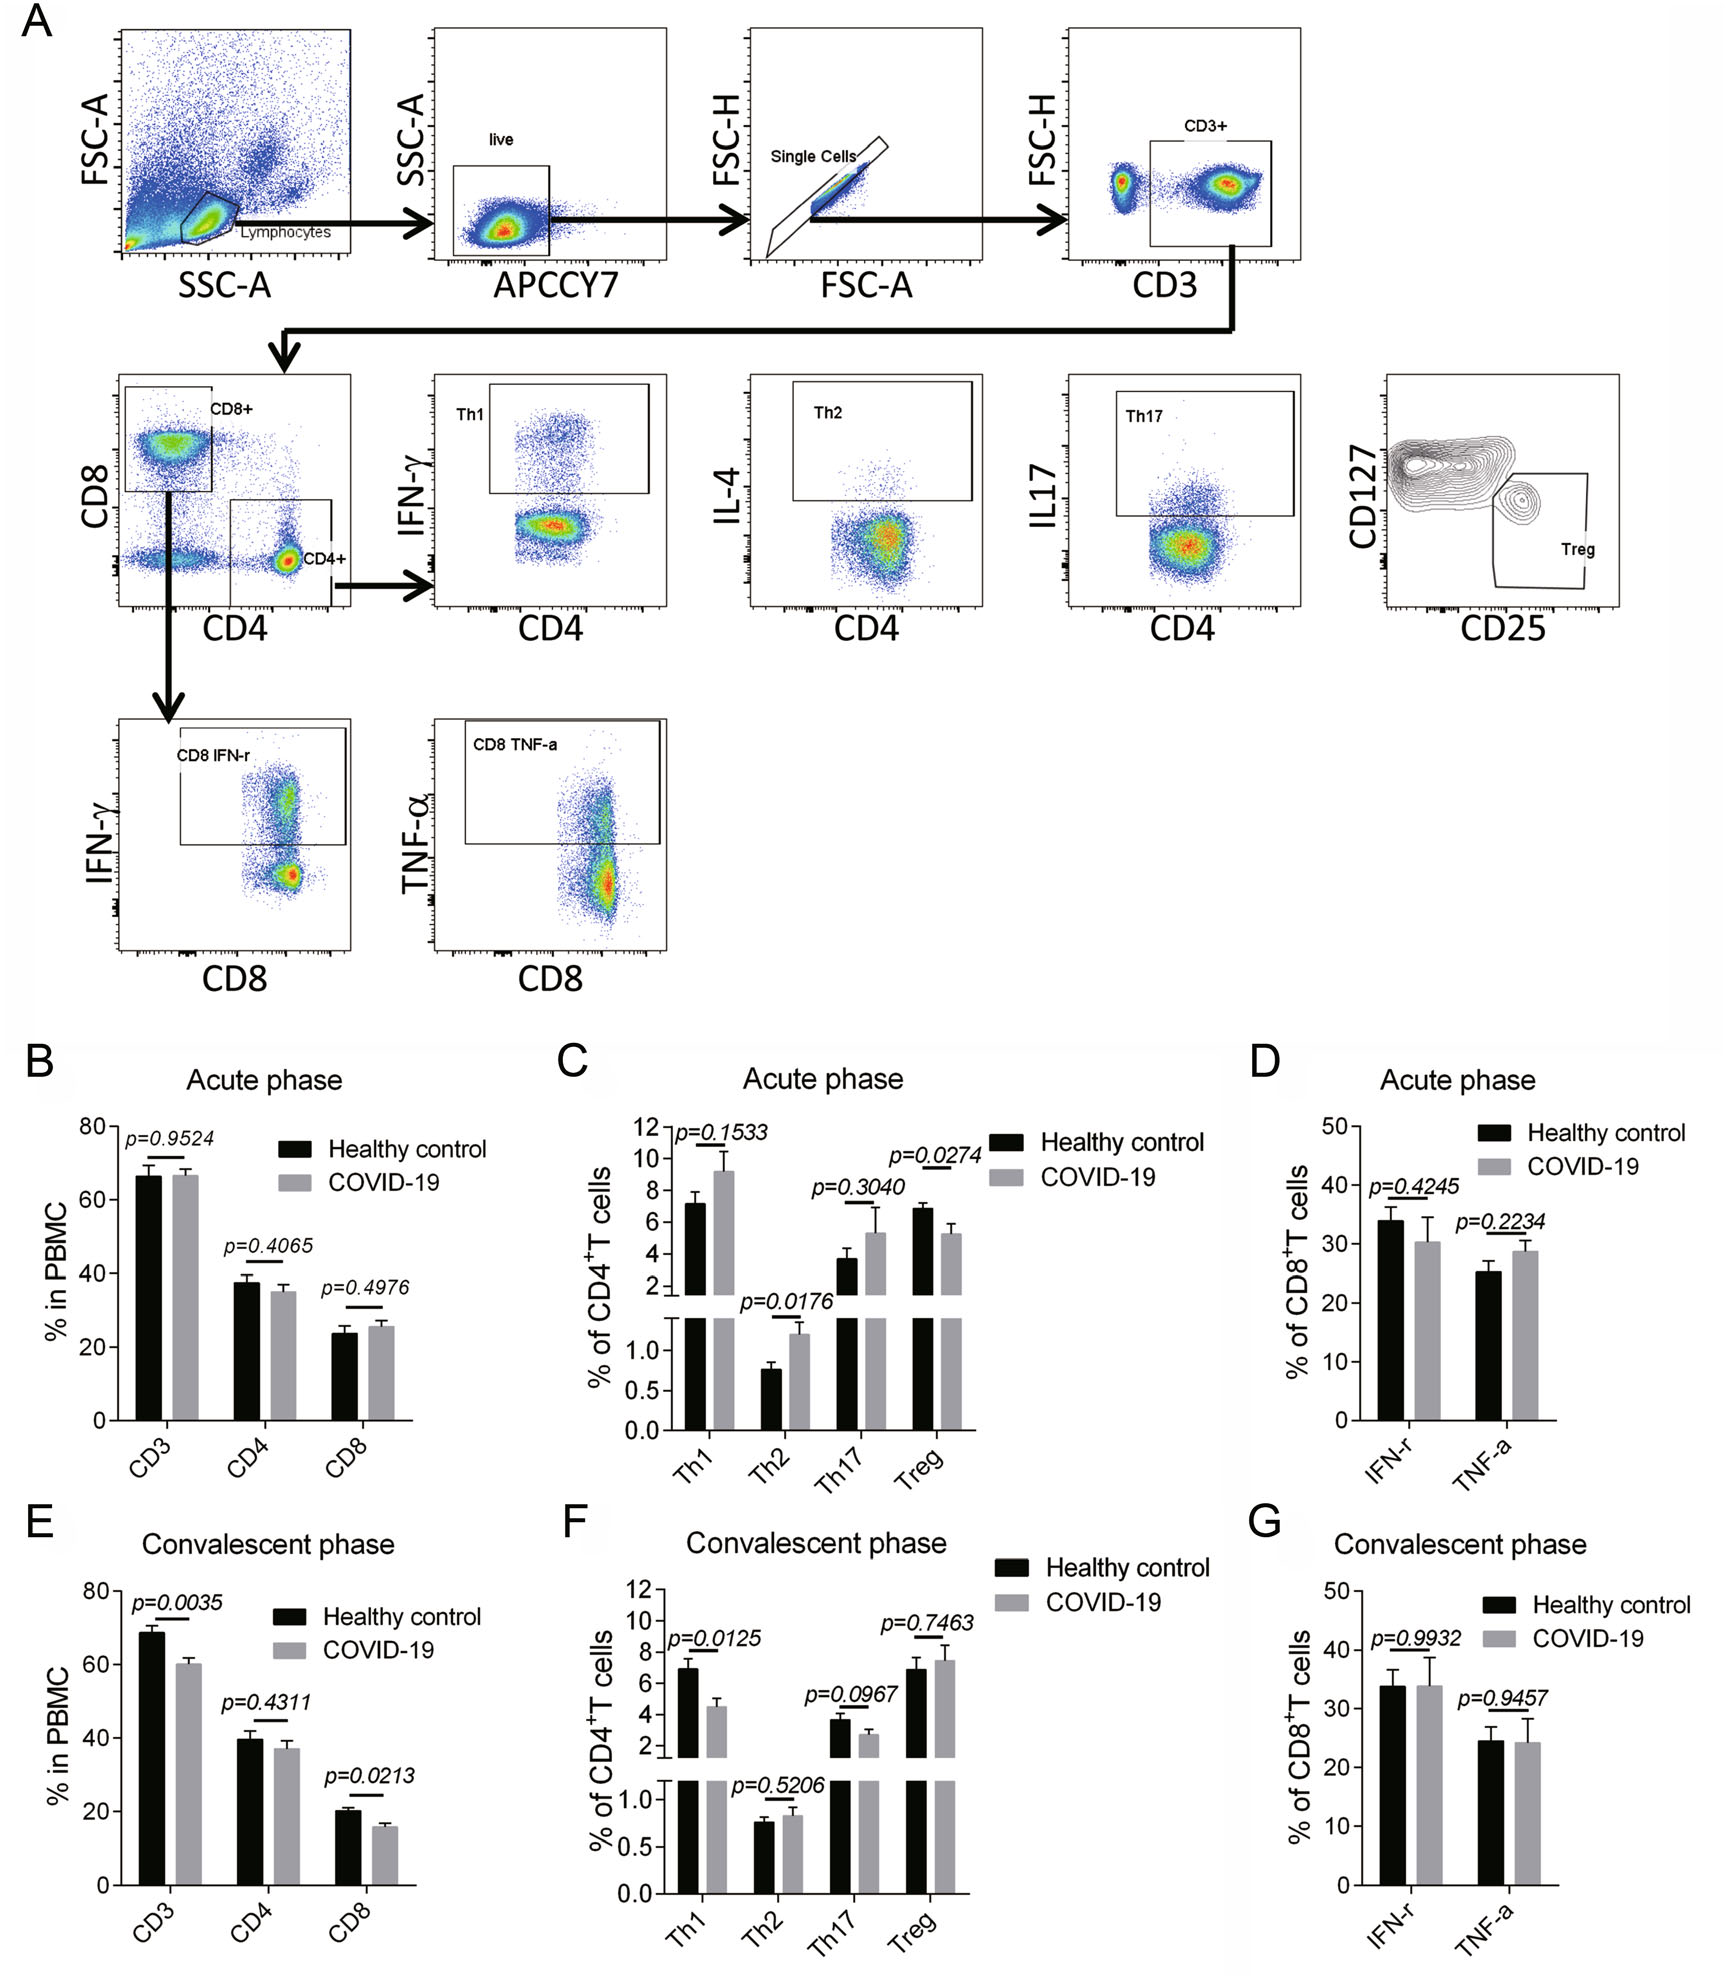
Figure 2. T cell immune response of children with COVID-19. A The gating strategy for CD4+ T cell subsets and CD8+ T cell cytokine production were showed. B–D The surface markers for T cells (CD3, CD4, CD8) (B), the Th1(CD4+ IFN-γ+)/Th2(CD4+ IL-4+)/Th17(CD4+ IL-17+)/Treg (CD4 + CD25+ CD127−) subsets (C), the IFN-γ-producing and TNF-α-producing CD8+ T cells (D) of the patients in acute phase were showed (n = 9). E–G The surface markers for T cells (E), the Th1/Th2/Th17/Treg subsets (F), the cytokine production in CD8+ T cells (G) of the patients in convalescent phase were displayed (n = 14). Data were presented as mean ± SEM. Student's t test was performed and P < 0.05 was considered of significant difference.
Additionally, we analyzed the memory T cell subsets including naïve T cells (NT), central memory T cells (TCM), effector memory T cells (TEM) and CD45RA+ effector memory T cells (TEMRA) during convalescent phase (Fig. 3A). Consequently, no significant changes were found in all the memory T cell subsets in CD4+ T (Fig. 3B) and CD8+ T cells (Fig. 3C), suggesting that no perturbation was developed in the homeostasis of memory T cells.
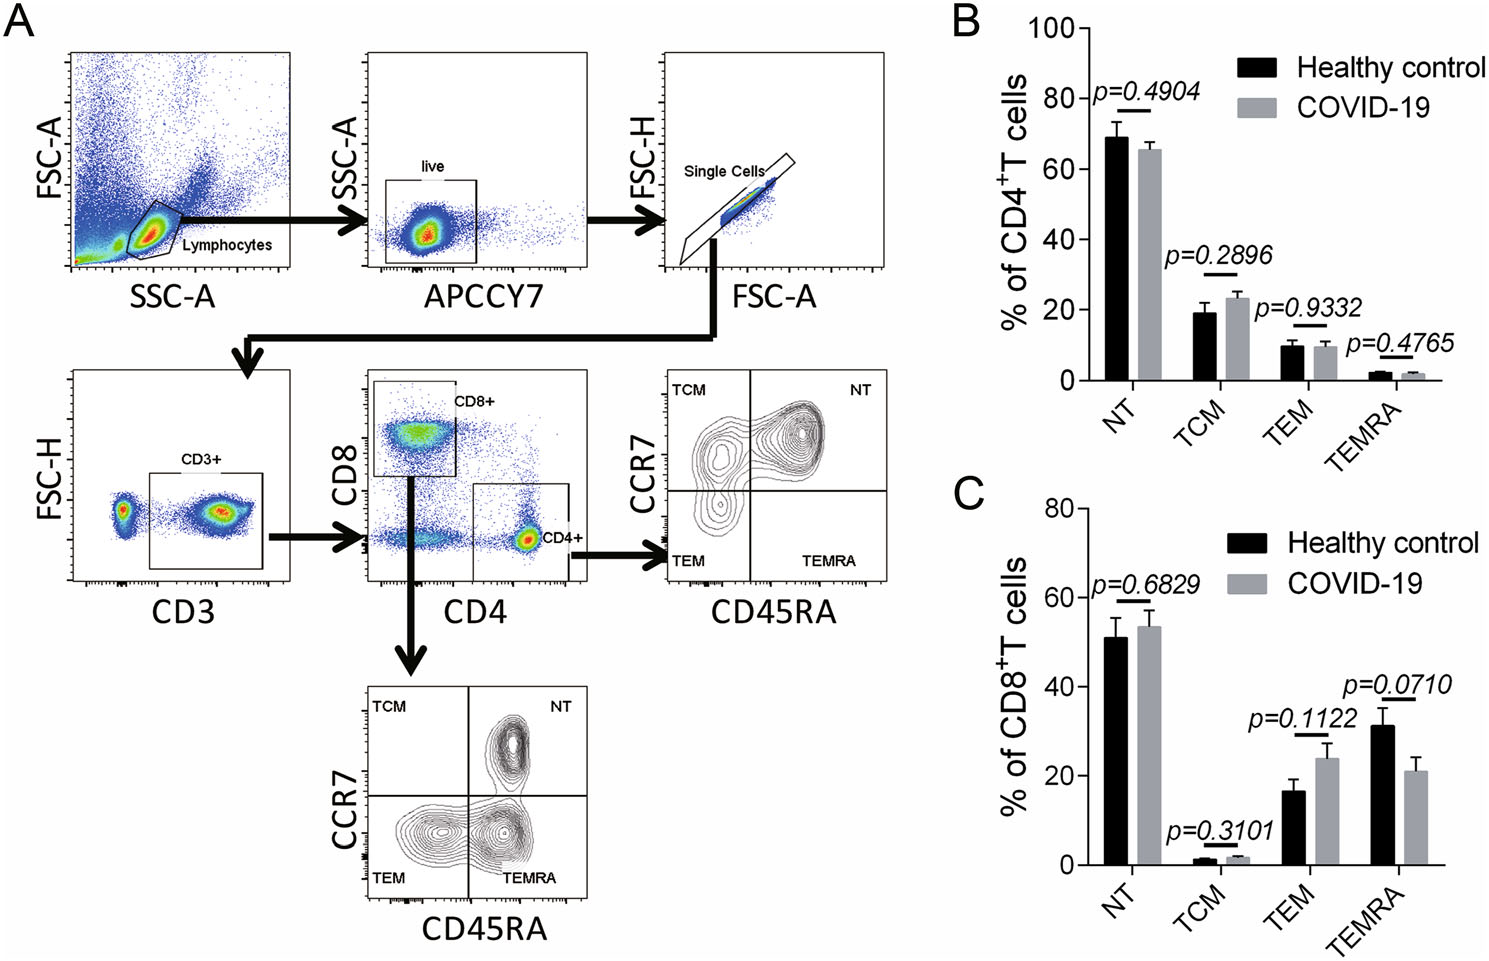
Figure 3. Memory T cell subsets in children with COVID-19 during convalescent phase. A The gating strategy for memory T cell subsets including the naïve T cells (NT) (CD45RA+ CCR7+), the central memory T cells (TCM) (CD45RA− CCR7+), the effector memory T cells (TEM) (CD45RA− CCR7−) and the CD45RA+ effector memory T cells (TEMRA) (CD45RA+ CCR7−) were showed (n = 7). (B–C) The proportion of memory T cell subsets in CD4+ T cells (B) and CD8+ T cells (C) in the patients during convalescent phase were displayed (n = 7). Data were shown as mean ± SEM. Student's t test was performed and P < 0.05 was considered of significant difference.
-
S-RBD or N-specific total antibodies or IgG all displayed a prominent increasing trend and mostly mounted a strikingly high level in middle and convalescent phase (Fig. 4A–4D). There was only one N IgG negative sample (5.89 × 10³ RLU/1 μL) in convalescent phase, while her S-RBD IgG was remarkably high (1.14 × 10⁵ RLU/1 μL).
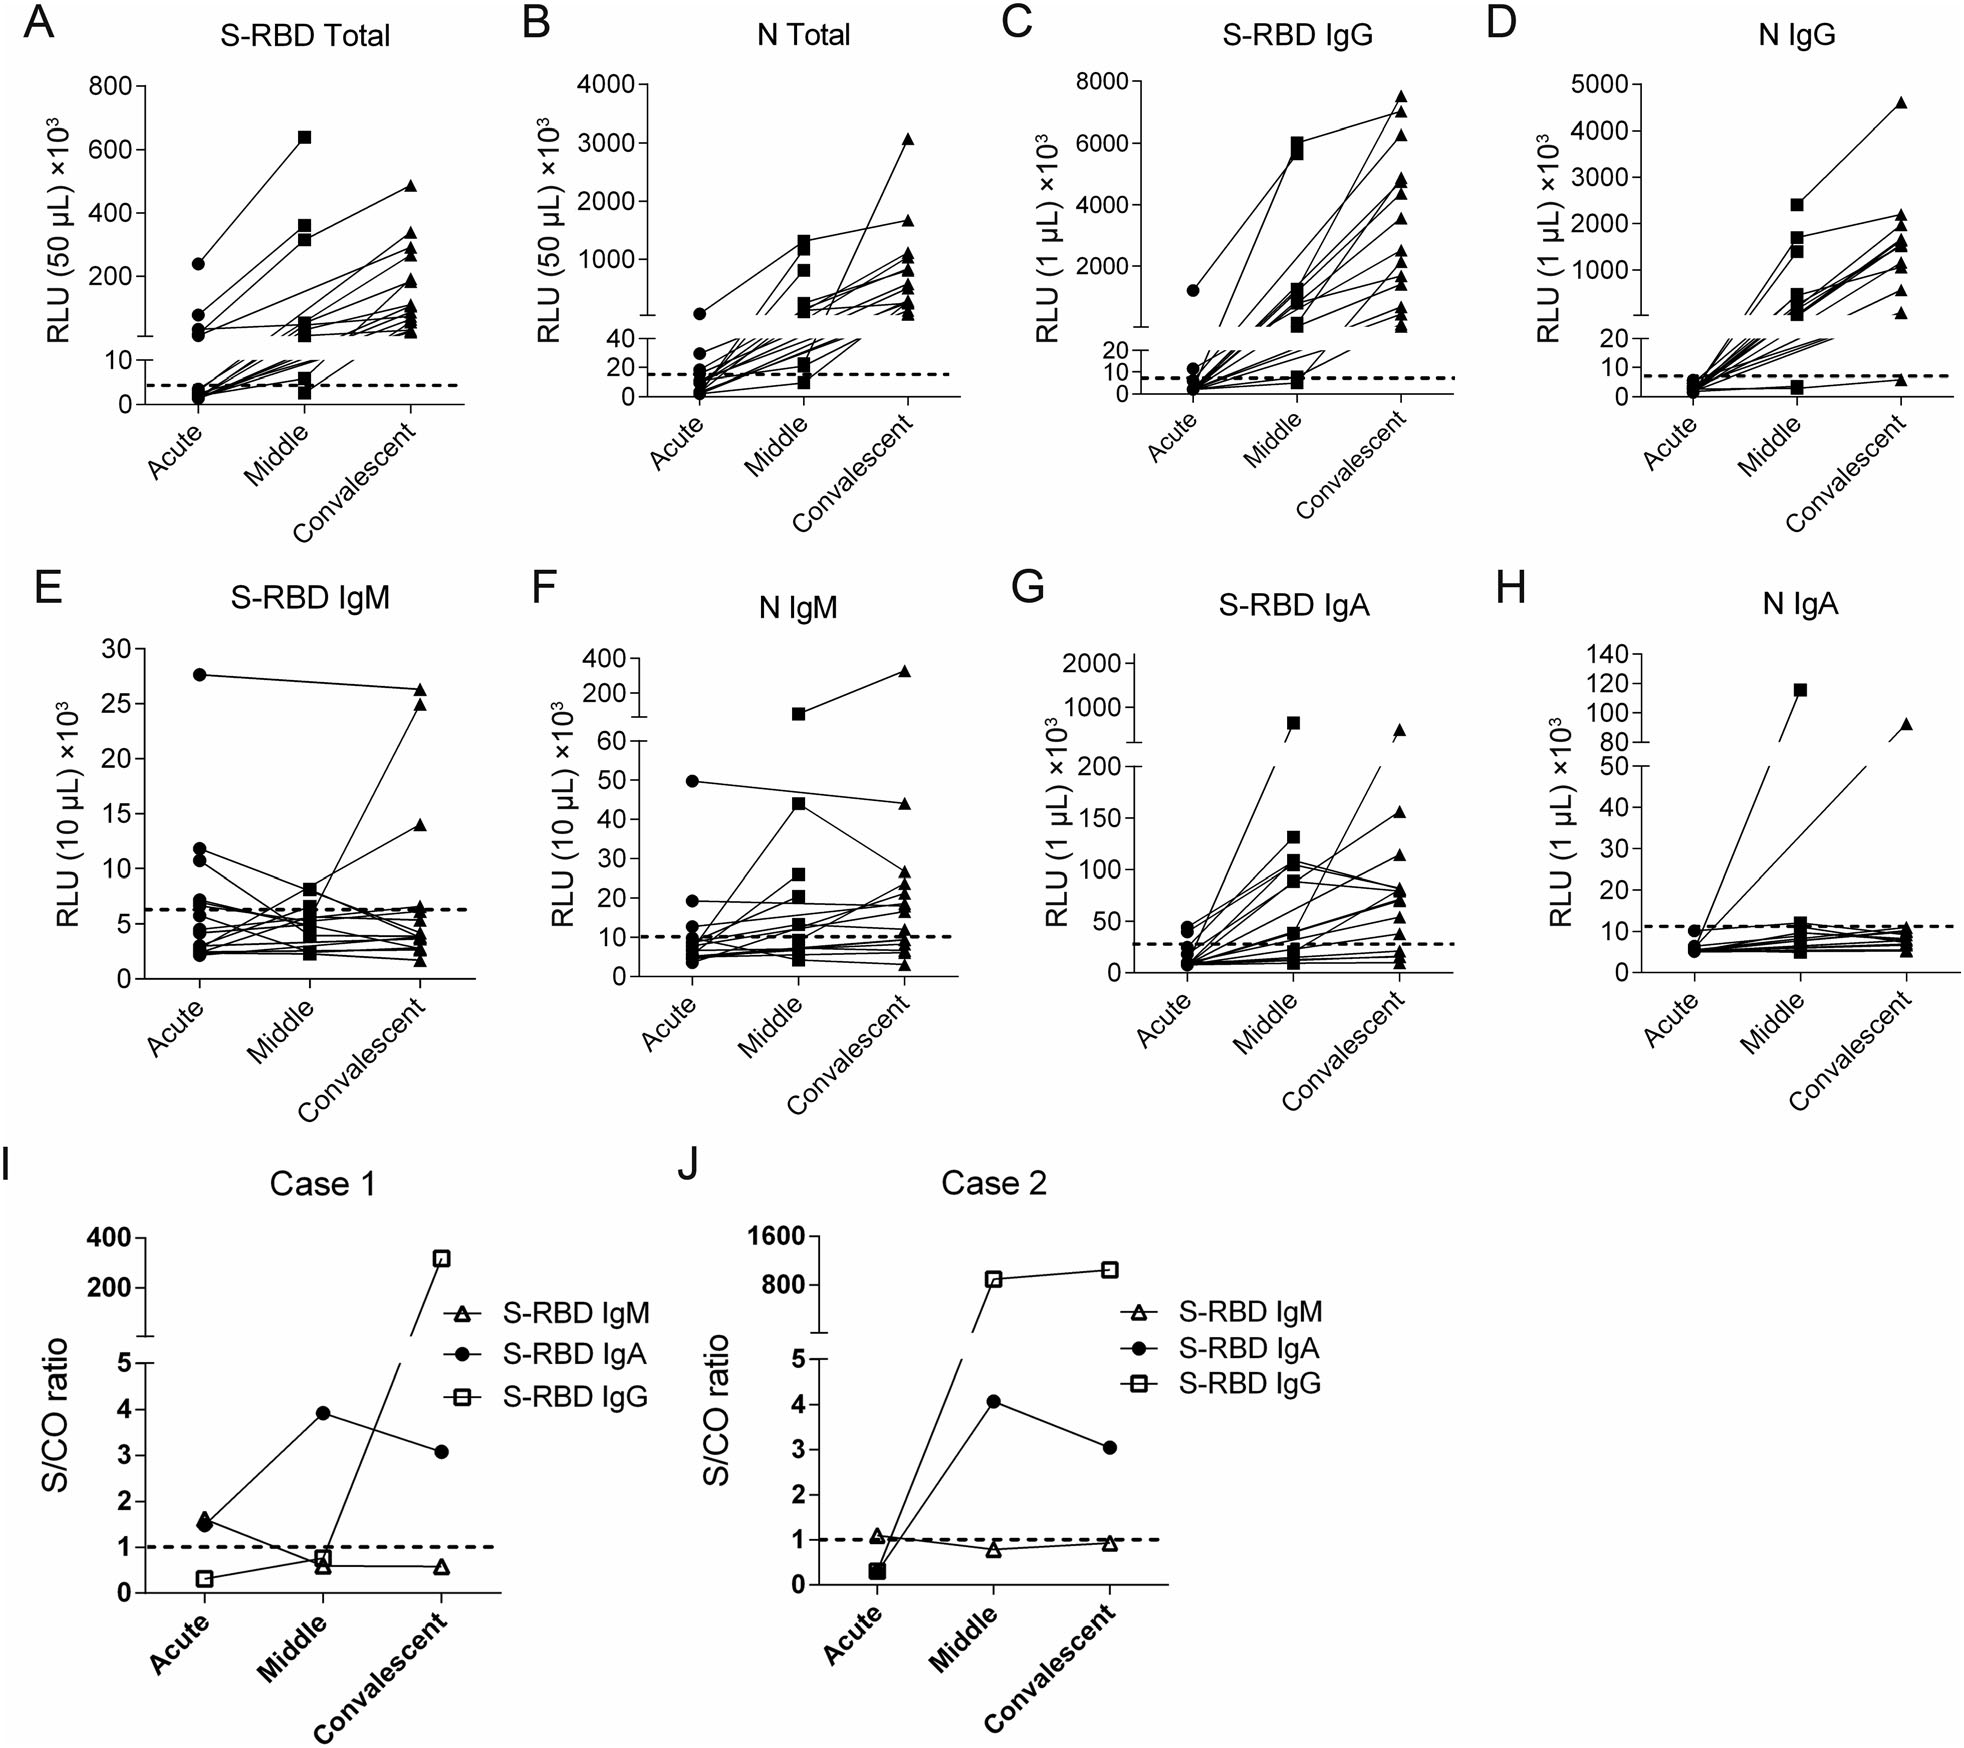
Figure 4. Kinetics of antibody production of children with COVID-19 in different phases of disease onset. (A–H) Sera from 19 COVID-19 patients were analyzed on SARS-CoV-2 S-RBD or N-specific total antibody (A, B), IgG (C, D), IgM (E, F) and IgA (G, H) during acute phase (n = 19), middle phase (n = 10) and convalescent phase (n = 14) respectively. The doted horizontal lines indicate the cut-off values which were set at the triple means of the RLU values of healthy controls. (I, J) The kinetics of S-RBD-specific IgG, IgM and IgA in 2 cases of the children with COVID-19. RLU, relative light unit; S/CO ratio, the ratio of sample RLU value to cut-off RLU value.
A total of 10 (53%) patients were considered as S-RBD IgM positive, including 6 of 19 samples in acute phase, 1 of 10 in middle phase and 3 of 14 in convalescent phase (Fig. 4E). Nine (47%) patients were defined as N IgM positive, with 3 of 19 samples in acute phase, 5 of 10 in middle phase and 9 of 14 in convalescent phase (Fig. 4F). Altogether, 11 patients (58%) were determined as S-RBD or N IgM positive, and 9 (47%) were detected during acute phase.
S-RBD seemed to be a better antigen to induce IgA than N protein, since 14 patients (74%) were defined as S-RBD IgA positive (Fig. 4G), while only 2 (11%) were N IgA positive (Fig. 4H). S-RBD IgA was on a clearly increasing trend from acute to middle phase, with 2 of 19 samples in acute phase and 7 of 10 in middle phase were considered as positive. Notably, 3 of the 7 S-RBD IgA positive patients in middle phase showed a decreasing trend afterwards.
Furthermore, to clarify the antibody kinetics after disease onset, the only two patients who had both consecutive samples and early S-RBD IgM response were chosen to show the pattern of antibody production individually. Typically, after a short presence in acute phase, S-RBD IgM declined rapidly to undetectable levels, while S-RBD IgA reached its peak level in middle phase but decreased afterwards. S-RBD IgG were elicited later than IgM and IgA, but continued to grow in convalescent phase (Fig. 4I, 4J).
Clinical Manifestations and Laboratory Findings of Children with COVID-19
Serum Cytokine/Chemokine Levels in Different Phases of Children with COVID-19
T Cell Immune Response of Children with COVID-19 in Acute and Convalescent Phase
Kinetics of SARS-CoV-2-Specific Antibody Production in Children with COVID-19 in Different Phases
-
SARS-CoV-2 is still spreading rampantly and causing a great global panic especially in the countries and territories with fragile health systems. Here in this report, we presented the immunological profile of children with COVID-19, which might add to the knowledge of SARS-CoV-2-induced host immune response.
Laboratory finding of adult patients revealed that lymphopenia, diminished IFN-γ-secreting CD4+ or CD8+ T cells and increased indicators of inflammation or organic impairment were commonly seen and were correlated with the disease severity (Chen et al. 2020; Qin et al. 2020). But in this study, children with COVID-19 didn't develop severe symptoms and the laboratory findings were normal or slightly changed for most cases. On another hand, adults with COVID-19 especially the severe cases tend to develop a cytokine storm-mediated immunopathology (Pedersen and Ho 2020; Mehta et al. 2020). Here in our study, we didn't find a broad elevation of cytokines in children, except for IL-10, IP10 and IL-16. IL-10, which is a Th2 cytokine, was reported to be associated with the disease severity and IL-10 of the patients in our study appeared to be even lower that moderate adult patients in other studies (Saxena et al. 2015; Zhang et al. 2020; Wang et al. 2020). IP10 was considered to be involved in the exacerbation of lung injury and was associated with the severity of COVID-19 (Ichikawa et al. 2013; Huang et al. 2020). The median of serum IP10 in moderate adult cases was reported to be about 103 pg/mL and didn't go back to normal until ≥ 15 days after disease onset (Huang et al. 2020; Yang et al. 2020), while the serum IP10 of the pediatric patients in our study (median 186.92 pg/mL, range 537.12–66.53 pg/mL) was much lower and rapidly decreased to normal within 10 days. It seems that children displayed less inflammatory response than adults, which is in accordance with their mild clinical manifestations.
Particularly, we observed a remarkable elevation of IL-16 in pediatric patients. IL16 has recently been regarded as a pan-viral biomarker (Sampson et al. 2017). Unlike IL-10 and IP10, IL-16 didn't decline as the disease progresses. Given that IL-16 enhanced the inflammatory response by promoting Th2 immune response (Li et al. 2019) and our previous work found IL-16 inhibited the influenza virus-induced Th1 response (Jia et al. 2020), we wondered whether the sustaining high level of IL-16 was correlated with Th1/Th2 unbalance in children with COVID-19. But the dynamics of IL-16 hasn't been reported in COVID-19 patients before, further studies are needed to figure out whether IL-16 has the similar secretion pattern in adult patients and to clarify the role of IL-16 in the progression of the disease.
Th2 assists B cell differentiation and antibody production by various ways (León et al. 2014; Guo and Rothstein 2013; Marconi et al. 1998; Lycke 1998; Yamamoto et al. 1996). For instance, IL-4 promotes IgM maturation and its class-switching to IgE and IgG. IL-10 could synergize with IL-4 in IgA secretion to confer first-line protection at mucosal surface (Guo and Rothstein 2013). Thus the biased Th2 response in acute phase might be beneficial in the production of virus-specific antibodies. However, since Th2 was always associated with allergic immunopathology and the Th2 cytokines were reported to increase in fatal cases of SARS (Li et al. 2008), we are unable to define the role of Th2 in the progression of COVID-19 based on the existing data, but this could propose possible directions for future study.
As is well established, there is a balance between the immunosuppressive role of Treg and the anti-viral immune response, and a superiority of either side could cause detrimental outcomes. After combining our data with other reports, we recognized that Treg was diminished in both moderate adult patients and pediatric patients, while in severe cases Treg tended to show a larger decrease (Qin et al. 2020). This prompted us to assume that appropriate compromise of Treg might be beneficial to orchestrate the immune response for better protection and less immunologic injury, but overreduced Treg in severe cases tended to cause consistent deleterious tissue destruction that could be fatal.
Combined with other reports and our study, SARS-CoV-2-specific antibodies were prominently induced both in pediatric and adult patients, and their neutralizing ability has been confirmed in our previously published work and other reports (Liu et al. 2020; Okba et al. 2020; Zhao et al. 2020; Matricardi et al. 2020; Azkur et al. 2020). The median seroconversion time for IgM and IgG in adults were reported to be day 12 and day 14 after disease onset (Okba et al. 2020; Zhao et al. 2020). But in our study, all the patients had become IgG positive in middle phase, indicating that children's seroconverted time for IgG might be earlier than 10 days. The high positive rate of serum IgM (47%) in acute phase suggests that the seroconverted time for IgM in children might be within 3 days and IgM might be an optional indicator for early infection. The mucosal immunity conferred by secretory IgA is crucial in virus neutralization, especially for respiratory viruses (Lycke 1998; Matricardi et al. 2020; Azkur et al. 2020). For both adults and children, IgA appeared to confer earlier response than IgG and more persistent response than IgM. However, IgA in adults was detectable at about 6–8 days and peaked at 15–20 days after disease onset, while IgA in children quickly mounted to its peak level at 4–10 days after disease onset (Matricardi et al. 2020; Azkur et al. 2020), suggesting that children's IgA may be elicited earlier than adults to confer timely protection against SARS-CoV-2 at mucosal surfaces.
In this study, we systematically presented immunological profile of children with COVID-19, which hasn't been reported before as far as we know. Children with COVID-19 developed robust virus-specific antibody production as adult patients did. But different from adults, children displayed mild serum cytokine elevation, as well as inactive CD8+ T cell response and moderate CD4+ T cell immune response, which might be associated with their less immunopathology and better prognosis. Endeavors are imperatively needed to explain why children develop different immune response against SARS-CoV-2 compared with adults and illustrate the interrelationships between pro-inflammatory cytokines, cellular immunity and humoral immunity.
-
This work was supported by grants specific for Coronavirus Disease 2019 from the Children's Hospital of Fudan University (Grant No. EKXGZX006).
-
JX and MZ conceived and designed the study, and reviewed and revised the manuscript. RJ performed the CBA and flow cytometry experiments and drafted the initial manuscript. XW and PL processed the patients' specimen and performed the antibody detection experiments. HZ participated in the antibody detection experiments. YG., HC and HT collected the patients' specimen. XL contributed to design the study. All the authors revised and approved the manuscript.
Author Contributions
-
The authors declare that they have no conflict of interest.
-
This study was reviewed and approved by the Ethics Committee of the Children's Hospital of Fudan University.

 DownLoad: