


HTML
-
Non-polio Enteroviruses (EVs) are among the most prevalent viruses infecting humans. While most infections are asymptomatic, EVs can cause a broad spectrum of disease from mild to severe and even fatal illnesses. Hand, foot and mouth disease (HFMD) is mainly caused by EVs species A and represents an important public health problem in the Asia–Pacific region. China ranks first worldwide in terms of the case number and mortality of HFMD (Yu and Cowling 2019), and HFMD outbreaks have occurred annually in the past decade. Currently, no specific antiviral drugs are available for HFMD. Despite the availability and partial roll-out of an EV-A71 vaccine, approved for licensure in China in March 2016, the vaccine has no cross-protective effect with other EVs. Thus the burden of HFMD in China remains high (Li et al. 2018).
EVs are nonenveloped, single-stranded, positive-sense RNA viruses (https://www.viprbrc.org/brc/home.spg?decorator=picorna_entero) that encode four structural viral proteins (VPs): VP1, VP2, VP3, and VP4. Among these VPs, the VP1 region of EVs is most often used for genotyping (Harvala et al. 2018). EV-A71, the most common pathogen of severe HFMD, is divided into seven genogroups, A through G; eleven subgenogroups, B0 through B5 and C1 through C5; and two sublineages, C4a and C4b, based on the VP1 region (Iwai et al. 2009; Zhu et al. 2013; Le et al. 2019). The prototype strain for EV-A71 is BrCr. Coxsackievirus A16 (CVA16) is divided into two genogroups, A and B; two subgenogroups, B1 and B2; and three sublineages, B1a, B1b and B1c, also based on the VP1 region (Perera et al. 2007; Zhang et al. 2010; Ganorkar et al. 2017). The prototype strain for CVA16 is G10. Coxsackievirus A6 (CVA6) is divided into four genogroups, A through D; seven subgenogroups, B1 and B2, C1 and C2 and D1 through D3; and two sub-lineages, D3a and D3b (Song et al. 2017). The prototype strain for CVA6 is Gdula.
For both EV-A71 and CVA16, the important neutralizing/antigenic epitopes within the VP1 protein that are associated with viral infectivity have been established. These include the BC-, GH- and EF-loops and numerous residues (EV-A71: residues 31, 43, 98, 104, 106, 145, 164, 242 and 244; CVA16: residues 51-52, 98, 102-103, 218, 220, 241, 248, 251 and 295) (Huang et al. 2009; Cordey et al. 2012; Lu et al. 2012; Shi et al. 2013; Lyu et al. 2015; Arthur Huang et al. 2017; Song et al. 2017; Xu et al. 2018; Yao et al. 2018; Le et al. 2019). In contrast, because CVA6 is mostly associated with mild cases and difficult to culture, the corresponding sites and their properties have yet to be determined.
In China, previous HFMD outbreaks were mainly caused by EV-A71 and CVA16; however, CVA6 and CVA10 have emerged worldwide as important pathogens in recent years. Currently, CVA6 is the most commonly detected serotype in HFMD patients in China (Song et al. 2017). To provide a new perspective on viral diversity and identify new potential targets for drug and vaccine research, we conducted phylogenetic and variable site analyses of the VP1 protein of EV-A71, CVA16 and CVA6 viruses isolated from HFMD patients in China.
-
Before the introduction of the EV-A71 vaccine, a prospective virological surveillance program among children hospitalized with HFMD was established between October 2013 and September 2016. The program included three county-level hospitals and three township-level hospitals in Anhua County, Hunan Province, China (Gao et al. 2018). Details of the methods and results of the etiological investigations are described elsewhere (Gao et al. 2018).
Briefly, 2836 patients were enrolled, from whom 2827 throat swabs, 2583 rectal swabs and 778 stool samples were collected. Generic real-time reverse transcription-polymerase chain reaction (RT-PCR) was used to detect all EVs, and specific real-time RT-PCR was used to specifically detect EV-A71, CVA16 and CVA6. If a sample tested positive in the generic real-time RT-PCR but negative in the specific real-time RT-PCR, an additional nested RT-PCR was used to amplify a portion of the VP1 or VP4-VP2 regions for viral identification.
-
To select samples for VP1 sequencing, we first calculated the numbers of patients infected with each of the three serotypes (EV-A71, CVA16 and CVA6) by clinical sample type (stool sample, throat swab or rectal swab). These samples were further grouped by year and month of collection to identify specific time points for genotype switches (Ooi et al. 2007; Dolan et al. 2018). Finally, we applied a set of selection criteria to these categorized clinical samples to generate a final subsample for VP1 sequencing. The selection criteria were as follows: (1) For throat swabs, when ≥ 10 samples were available in a month, 10 clinical specimens were randomly selected, and when < 10 samples were available in a month all positive specimens were included; (2) For rectal swabs and stool samples, when > 2 samples were available in a month, 2 clinical specimens were randomly selected, and when ≤ 2 samples were available in a month, all positive specimens were included; (3) When both fecal and rectal swab samples were available, fecal samples were prioritized, and when fecal samples were not available, rectal swabs were included; and (4) Only one positive specimen was included per patient.
-
Viral RNA was extracted using a QIAamp Viral RNA Mini Kit (QIAGEN, Hilden, Germany) and recovered in elution buffer, according to the manufacturer's instructions. Nested RT-PCR amplification and sequencing of VP1 from the selected clinical samples were conducted using previously described PCR primers (Supplementary Table S1) (Perera et al. 2007; Zhang et al. 2009; Gaunt et al. 2015). In short, the first round amplification was performed in a 50 μL reaction volume using a SuperScript III One-Step RT-PCR Kit (Invitrogen, Carlsbad, CA, USA), with annealing temperatures of 50 ℃ for EV-A71, 45 ℃ for CVA16 and 55 ℃ for CVA6 over 40 cycles. CVA16 and CVA6 were amplified in a second round using DreamTaq Green PCR Master Mix (Invitrogen) under the same PCR conditions as the first-round in a 25 μL volume. The expected size of the PCR products was approximately 900 bp.
The obtained PCR products were sequenced bidirectionally using a Big Dye Terminator v3.1 Cycle Sequencing Kit (Applied Biosystems Inc., Foster City, CA, USA), using corresponding forward and reverse PCR primers in a 96-capillary 3730xl DNA Analyzer (Applied Biosystems). Sequences were confirmed by BLAST search (https://blast.ncbi.nlm.nih.gov/Blast.cgi).
-
For clarity, we first removed all sequences that were < 1% divergent from each other at the nucleotide level using the CD-HIT program (http://weizhong-lab.ucsd.edu/cdhit_suite/cgi-bin/) (Huang et al. 2010). Recombination was detected using a combination of methods (RDP, GENECONV, MaxChi, Chimaera, 3Seq, Bootscan and Siscan) within Recombination Detection Program version 4 (RDP4) with the default settings (Martin et al. 2015). Recombination was considered present when more than three of the above methods showed significant values (P < 0.05), and was reconfirmed by phylogenetic analysis. Sequence alignment was carried out using Geneious alignment in Geneious v7.1.3 (https://www.geneious.com). The maximum likelihood (ML) method available in IQ-TREE v1.4.3 was employed to reconstruct phylogenetic trees of the corresponding EVs serotypes (Nguyen et al. 2015). A bootstrap procedure with 10, 000 replicates was used to assess the reliability of the obtained phylogenetic trees. Tree files were visualized using FigTree v1.4.3.
-
VP1 amino acid sequence analysis was conducted using PredictProtein (https://predictprotein.org/) (Yachdav et al. 2014). Selection pressure was measured by identifing instances of episodic positive selection, at the level of an individual site, using a mixed effects model of evolution (MEME) as previously described (http://www.datamonkey.org) (Murrell et al. 2012). To identify VP1-region amino acid changes in EV-A71, CVA16 and CVA6, sequences were compared to their respective reference strains (genotype A). All VP1 amino acid sequences obtained in this study were aligned.
-
The sequences obtained in this study were submitted to the NCBI under accession numbers MK306732 through MK307505.
Virological Surveillance and Sampling
Selection of PCR-Positive Samples for Complete VP1 Sequencing
VP1 Sequencing of EV-A71, CVA16 and CVA6
Phylogenetic Analysis
Detection of Amino Acid Substitutions
Sequence Accession Numbers
-
In total, 2836 HFMD patients were enrolled in our previous study. Using PCR methodologies, EVs that were eligible for genetic characterization in this study were detected in 2517 (89%) patients (Gao et al. 2018).
Among the 18 EVs serotypes identified, CVA16, CVA6 and EV-A71 were the most frequently detected, accounting for 32.5% (n = 819/2517), 31.2% (n = 785/2517) and 20.4% (n = 514/2517), respectively (Fig. 1A). Additionally, the serotypes were identified as follows: 5.9% (n = 149/2517) CVA10, 3.0% (n = 55/2517) CVA4, 1.6% (n = 40/2517) CVA8, 1.2% (n = 31/2517) CVA2, 0.5% (n = 12/2517) E18, 0.3% (n = 8/2517) CVA5, 0.3% (n = 8/2517) CVB5, 0.2% (n = 6/2517) CVB2, and 0.2% (5/2517) E9. Other EVs serotypes were detected in 2 or fewer patients.
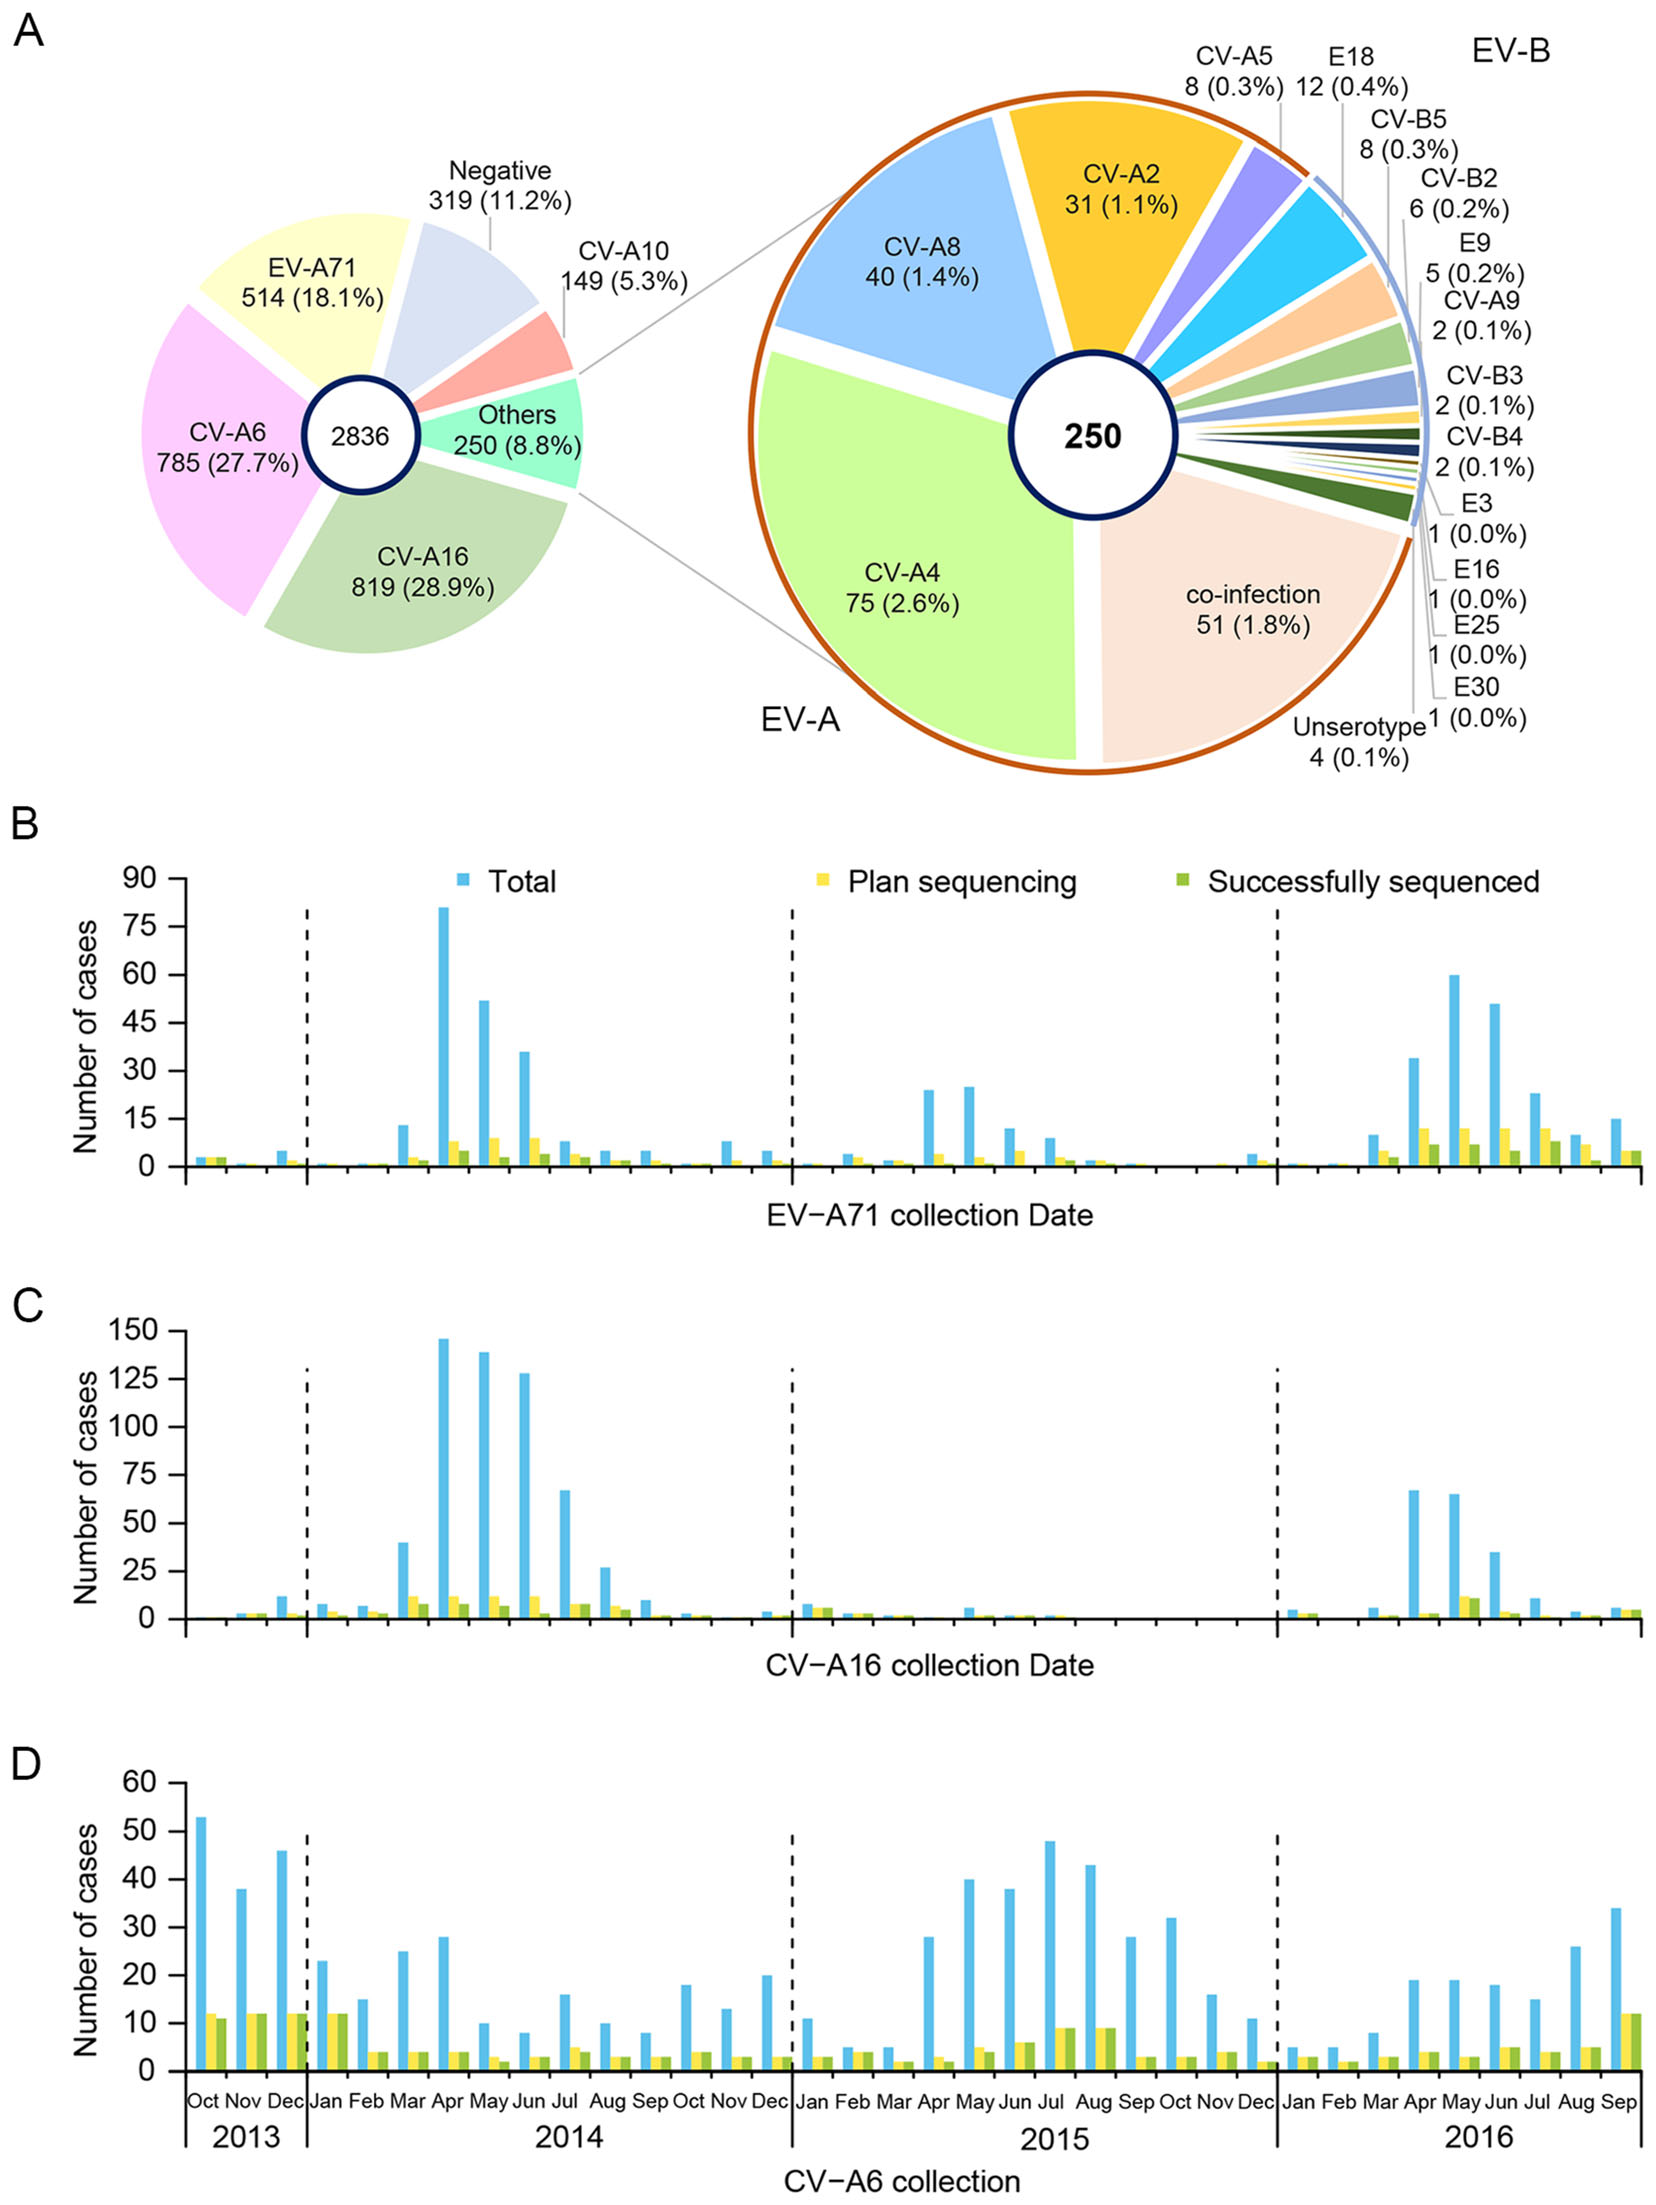
Figure 1. Distribution of EV serotypes found in Anhua County, China, October 2013–September 2016. A Distribution of EV-A71, CVA16 and CVA6 HFMD in Anhua County, China, October 2013–September 2016. Total monthly numbers, samples planned for VP1 sequencing and successfully sequenced of B EV-A71, C CVA16, and D CVA6.
-
According to the selection criteria, we selected 17% of the CVA16 isolates (n = 136/819), 23% of the CVA6 isolates (n = 181/785) and 28% of the EV-A71 isolates (n = 144/514) for complete VP1 sequencing. Then, we successfully obtained complete VP1 sequences from 76% of the CVA16 isolates (n = 103/136), 97% of the CVA6 isolates (n = 176/181) and 50% of the EV-A71 isolates (n = 72/144).
After the removal of identical sequences (where variation was < 1%), 24 EV-A71, 43 CVA16 and 65 CVA6 VP1 sequences remained for analysis (Fig. 1B–D, Table 1). All sequences fell within 3 subgenogroups: C4a for EV-A71, B1b for CVA16 and D3a for CVA6 (Figs. 2, 3 and 4).
Serotype Region Total samples in study, N No. for VP1 sequencing, n1 (n1/N, %) No. successfully sequenced, n2 (n2/n1, %) After removing sequences that were < 1% divergent, n3 (n3/n2, %) EV-A71 > 90% complete in the VP1 region 514 144 (28) 72 (50) 24 (33) CVA16 > 90% complete in the VP1 region 819 136 (17) 103 (76) 43 (42) CVA6 > 90% complete in the VP1 region 785 181 (23) 176 (97) 65 (37) CVA10 Partial VP1 149 119 (80) 119 (100) 66 (55) CVA2 Partial VP1 31 16 (52) 16 (100) 11 (69) CVA4 Partial VP1 75 55 (73) 55 (100) 29 (53) CVA5 Partial VP1 8 7 (88) 7 (100) 6 (86) CVA8 Partial VP1 40 38 (95) 38 (100) 28 (74) CVB2 Partial VP1 6 6 (100) 6 (100) 5 (83) CVB5 Partial VP1 8 8 (100) 8 (100) 8 (100) E18 Partial VP1 12 10 (83) 10 (100) 8 (80) Table 1. The Pretreatments of VP1 sequences obtained in this study.
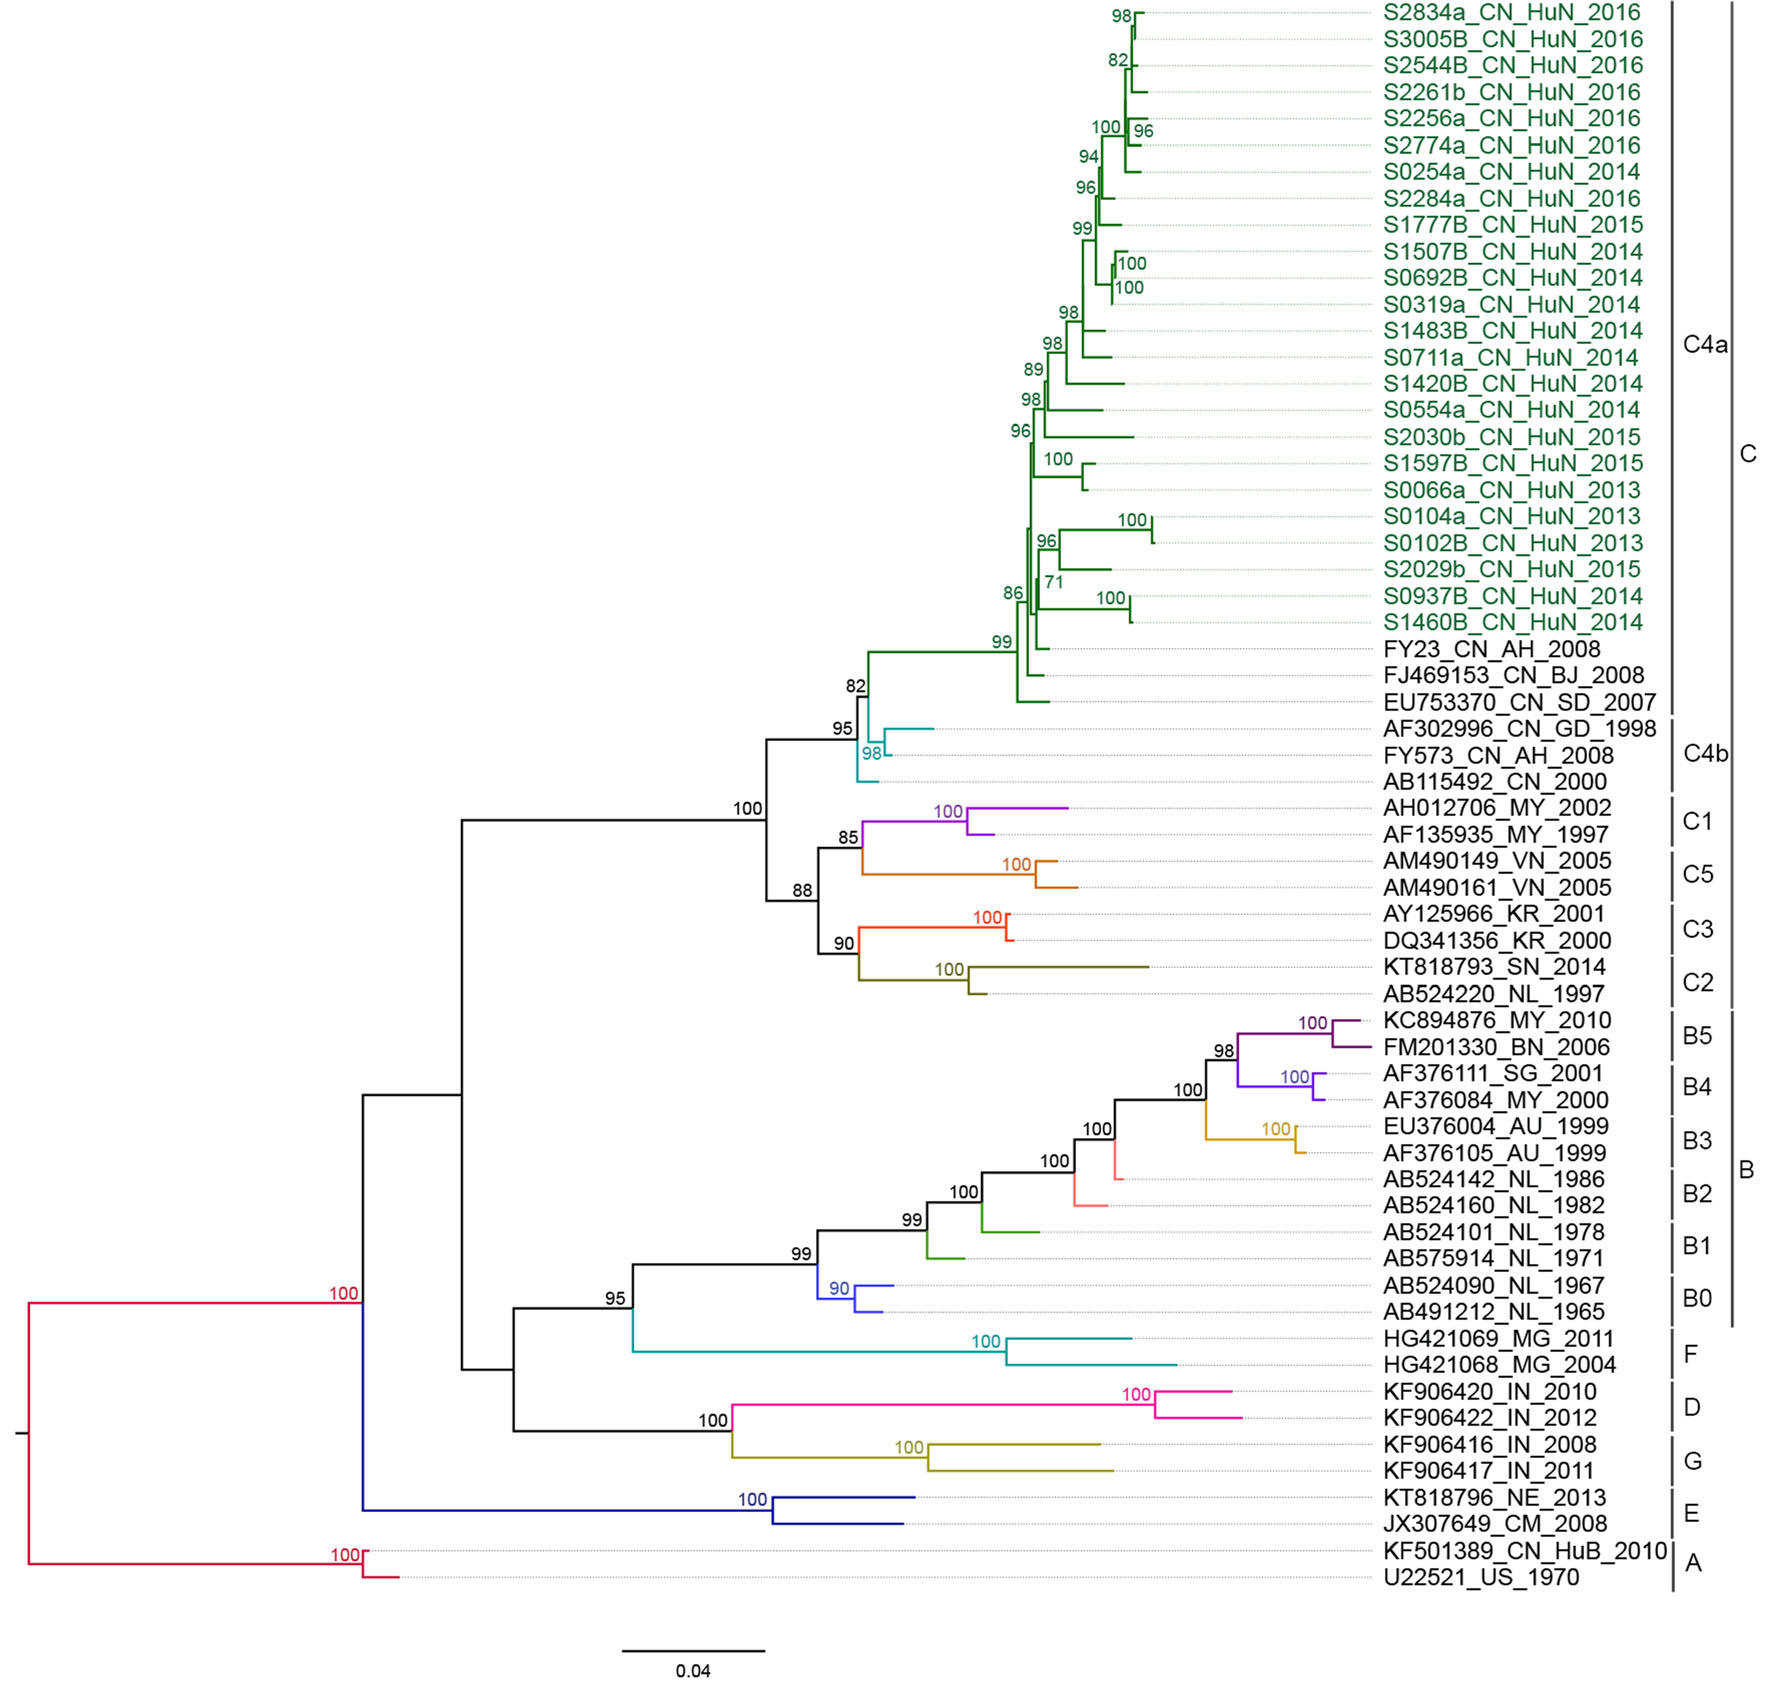
Figure 2. Phylogenetic analyses of the entire VP1 sequences (891 bp) of EV-A71 from Anhua County based on ML methods. The tree was rooted on genotype A of the EV-A71 strain. The branches of sequences are color-coded according to the EV-A71 lineage. The names of the study sequences are colored in green; the reference strains are uncolored. Bootstrap values > 70% are shown on the branches. The phylogenetic tree indicates that evolutionary branch C4a was responsible for infections in Anhua County during 2013–2016.

Figure 3. Phylogenetic analyses of the entire VP1 sequences (891 bp) of CVA16 from Anhua County based on ML methods. The tree was rooted on genotype A of CVA16 strain. The branches of sequences are color-coded according to the CVA16 lineage. The names of the study sequences are colored in green; the reference strains are uncolored. Bootstrap values > 70% were shown on the branches. The phylogenetic tree indicates that evolutionary branch B1b was responsible for infections in Anhua County during 2013–2016.

Figure 4. Phylogenetic analyses of the entire VP1 sequences (891 bp) of CVA6 from Anhua County based on ML methods. The tree was rooted on genotype A of CVA6 strain. The branches of sequences are color-coded according to the CVA6 lineage. The names of the study sequences are colored in green; the reference strains are uncolored. Bootstrap values > 70% were shown on the branches. The phylogenetic tree indicates that evolutionary branch D3a was responsible for infections in Anhua County during 2013–2016.
-
Partial VP1 region sequences of CVA10 (n = 119/149), CVA4 (n = 55/75), CVA8 (n = 38/40), CVA2 (n = 16/31), E18 (n = 10/12), CVB5 (n = 8/8), CVA5 (n = 7/8) and CVB2 (n = 6/6) were obtained (Table 1). After removing sequences with < 1% variation, partial VP1 sequences of CVA10 (n = 66/119), CVA4 (n = 29/55), CVA8 (n = 28/38), CVA2 (n = 11/16), E18 (n = 8/10), CVB5 (n = 8/8), CVA5 (n = 6/7) and CVB2 (n = 5/6) were included for analysis (Table 1). Following the calculation of similarity in terms of both nucleotides and amino acids, the results showed little variation (Supplementary Table S2). Thus, based on the phylogenetic tree and similarity analysis, these isolates clustered within their 8 subgenogroups: D, I-A, II, D, C, D2, E and 5.3 (Supplementary Figure S1-S8).
-
The remaining sequences were compared to reference prototype strains to identify variations at the amino acid level.
For the EV-A71 sequences, when compared to the prototype strain BrCr, 30 polymorphic amino acid sites were found. For the CVA16 sequences, when compared to the prototype strain G10, 29 polymorphic amino acid sites were found. For the CVA6, when compared to the prototype strain Gdula, 44 polymorphic amino acid sites were found (Figs. 5, 6 and 7, Supplementary Table S3).
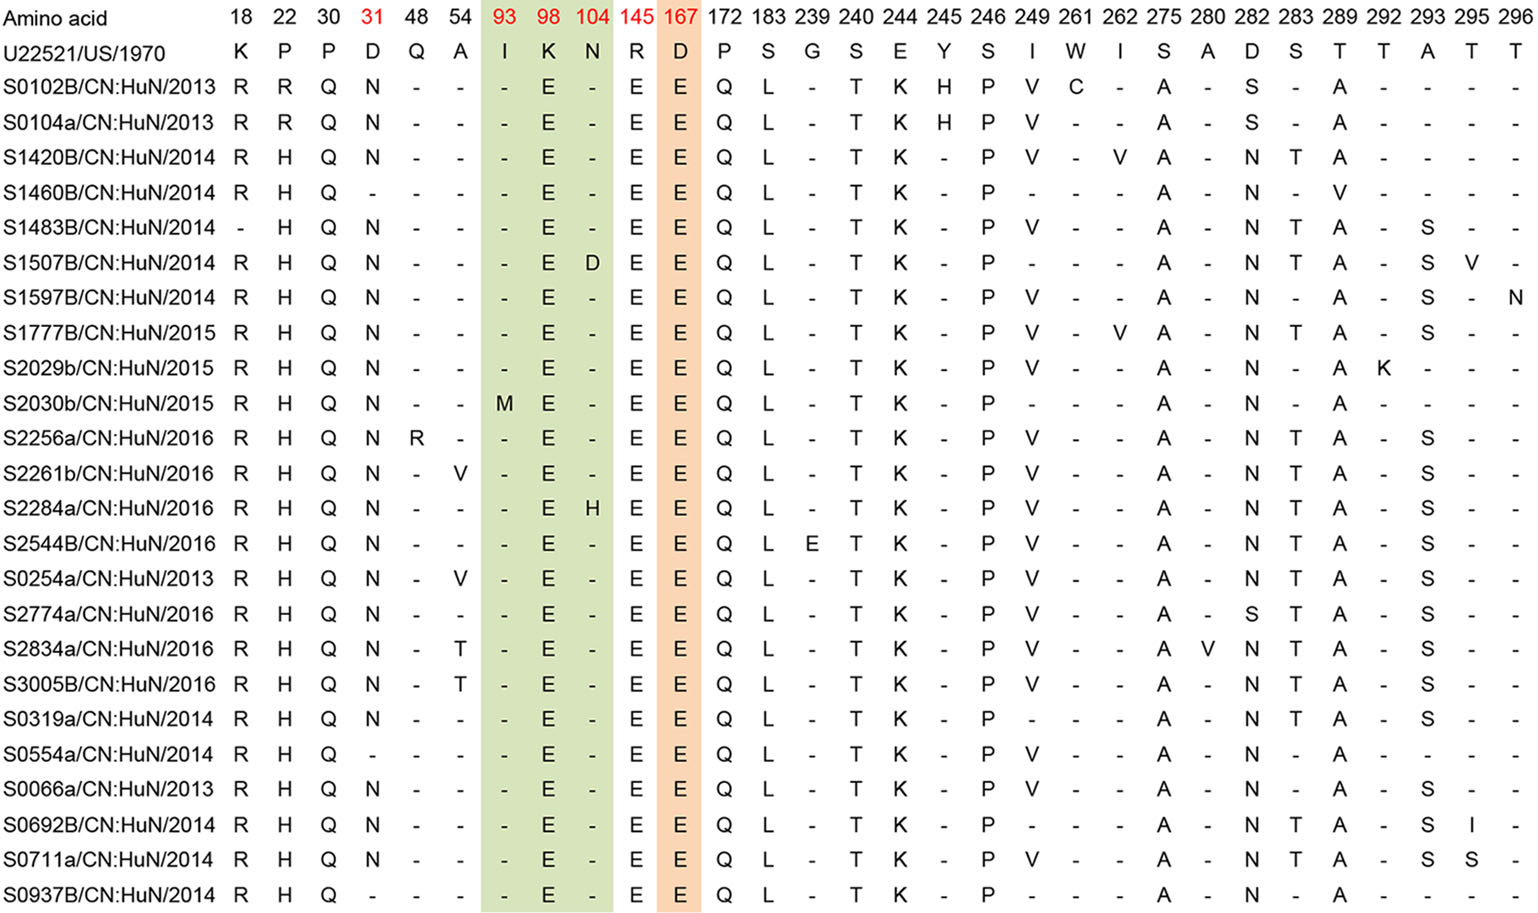
Figure 5. Variations were found in EV-A71 (C4a) of our study. "-" indicates matching to the U22521/US/1970 (EV-A71 prototype strain, genotype A, BrCr type-strain). Variations potentially associated with major neutralizing/antigenicity epitopes are indicated in red. BC loop regions are indicated in green, EF loop regions are indicated in orange.
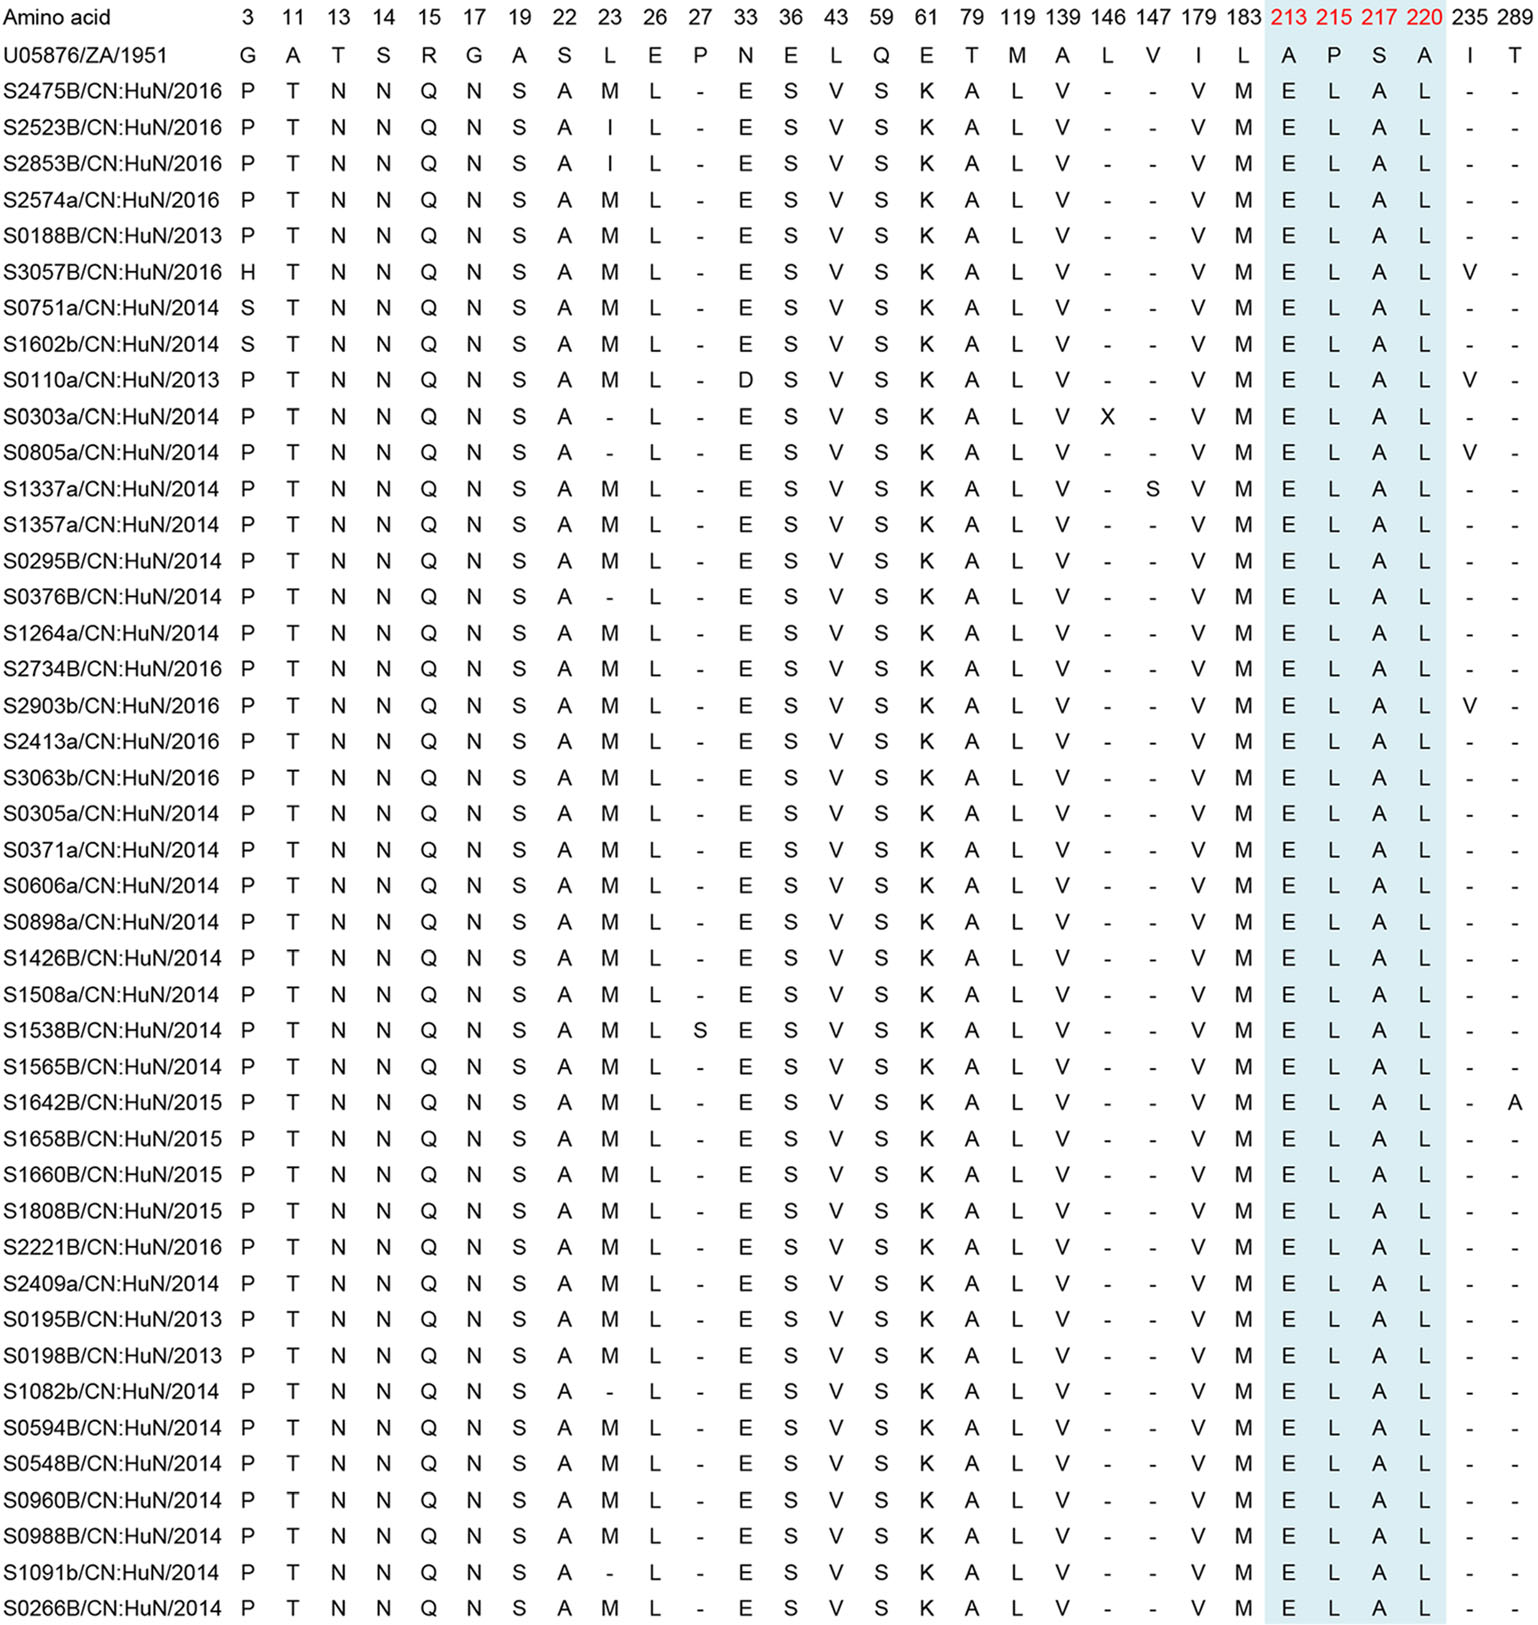
Figure 6. Variations were found in CVA16 (B1b) of our study. "-" indicates matching to the U05876/ZA/1951 (CVA16 prototype strain, genotype A, G10 type-strain). Variations potentially associated with major neutralizing/antigenicity epitopes are indicated in red and GH loop regions are indicated in blue.
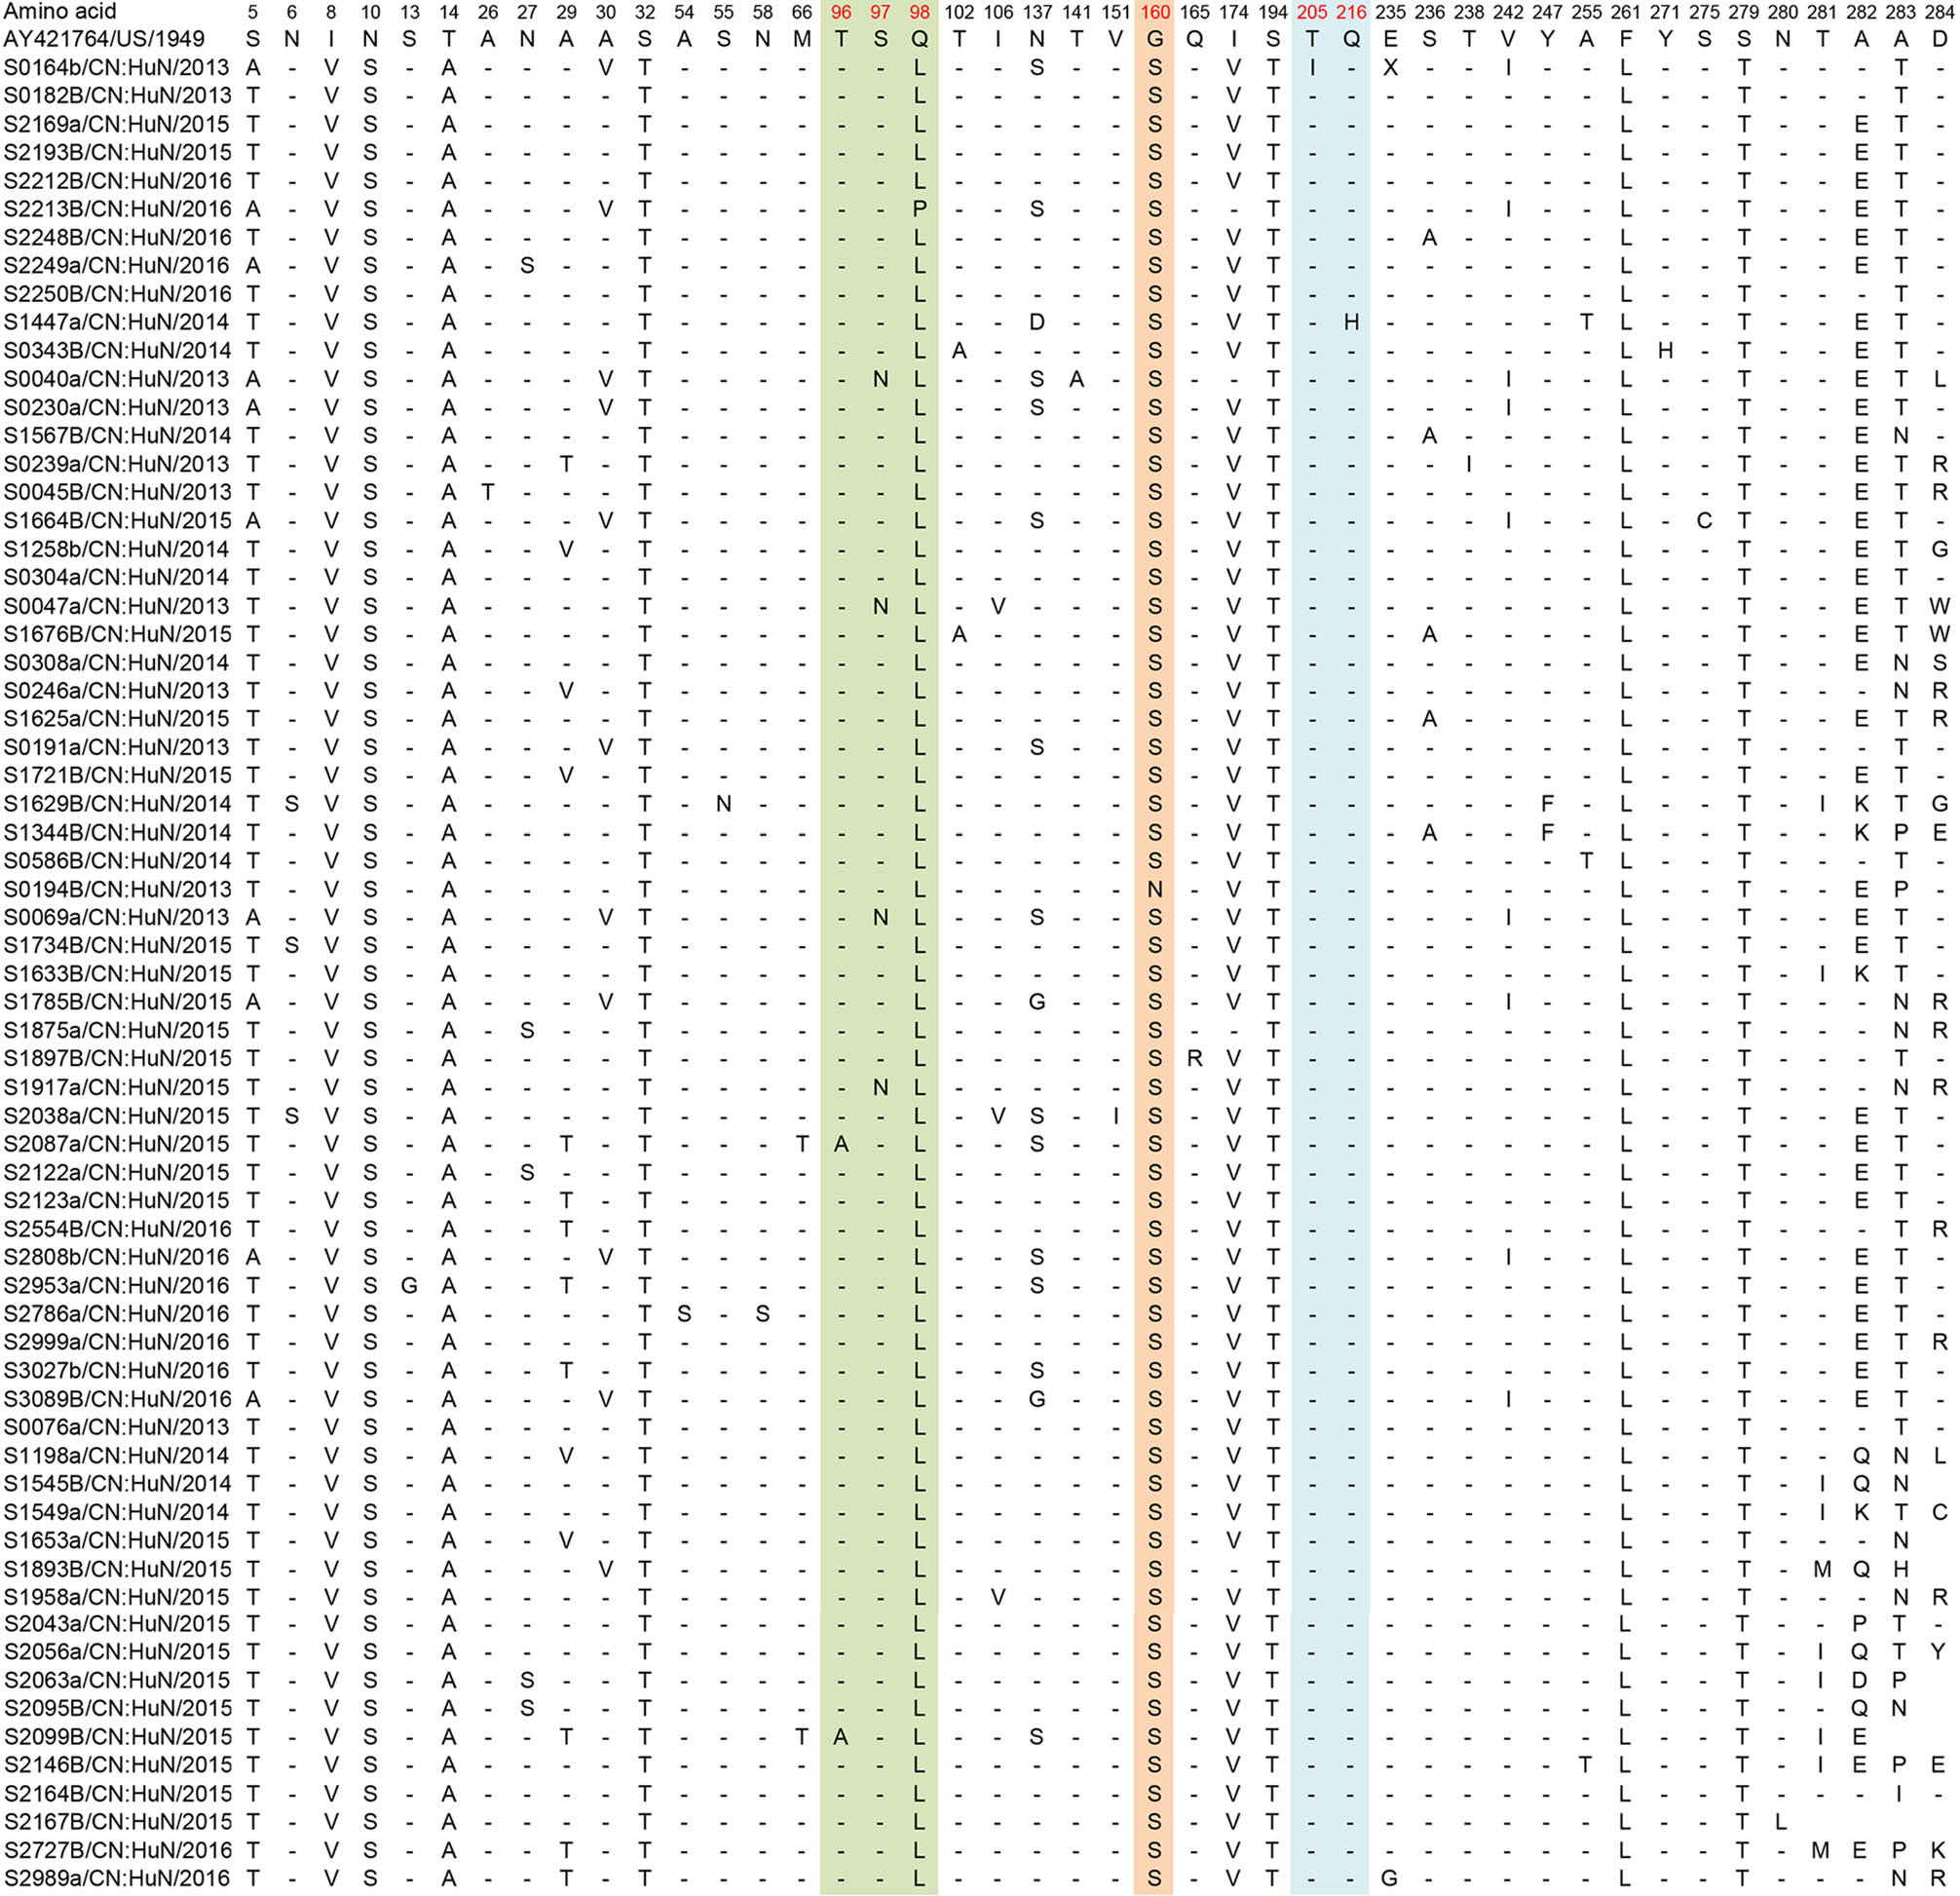
Figure 7. Variations were found in CVA6 (D3a) of our study. "-" indicates matching to the AY421764/US/1949 (CVA6 prototype strain, genotype A, Gdula type-strain). Variations potentially associated with major neutralizing/antigenicity epitopes are indicated in red. BC loop regions are indicated in green, EF loop regions are indicated in orange and GH loop regions are indicated in blue.
Additionally, we identified amino acid residue variations associated with major neutralization/antigenic epitopes. For the EV-A71 sequences, 87.5% (n = 21/24) of samples exhibited a substitution of aspartic acid (D) to asparagine (N) at residue 31 (D31N). Other substitutions were also found in the EV-A71 sequences: N104D/H (n = 2/24, 8%), R145E (n = 24/24, 100%), G239E (1/24, 4%), E244K (n = 24/24, 100%), S283T (15/24, 62.5%) and A293S/G (16/24, 66.7%) (Table 2).
Site Anhua study n (N, %) Le et al. (2019) n (N, %)Zhu et al. (2013) n (N, %)Liu et al. (2014) n (N, %)van der Sanden et al. (2010) n (N, %)Chia et al. (2014) n (N, %)31 (D31N) 21 (24, 87.5%) 42 (43, 97.7%) 14 (14, 100%) – – 15 (16, 93.8%) 104 (N104D/H) 2 (24, 8.3%) – – 0 (49, 0%) – – 145 (R145E/G/Q) 24 (24, 100%) 43 (43, 100%) 14 (14, 100%) 49 (49, 100%) – 16 (16, 100%) 239 (G239E) 1 (24, 4%) – – – 0 (50, 0%) – 244 (E244K) 24 (24, 100%) 43 (43, 100%) 14 (14, 100%) – 50 (50, 100%) – 283 (S283T) 15 (24, 62.5%) 2 (43, 4.7%) – – – – 293 (A293S/G) 16 (24, 66.7%) 4 (43, 9.3%) – – 0 (50, 0%) – "–" Indicates not reported.
aEV-A71 prototype strain (genotype A, BrCr type-strain).Table 2. Variations detected in VP1 amino acid sequences of EV-A71 strains (compared with U22521/US/1970a).
For the CVA16 sequences, the substitutions L23I/M/V and I235V were found in 88.4% (n = 38) and 9.3% (n = 4) of the investigated samples (n = 43), respectively. Other substitutions were found in only one CVA16 sequence: P27S, L146X, V147S and T289A (Table 3).
Site Anhua study n (N, %) Xu et al. (2018) n (N, %)Chan et al. (2012) n (N, %)Iwai et al. (2009) n (N, %)Sun et al. (2017) n (N, %)23 (L23I/M/V) 38 (43, 88.4%) 15 (146, 10.3%) – – 21 (35, 60%) 27 (P27S) 1 (43, 2.3%) – – – 0 (35, 0%) 146 (L146X) 1 (43, 2.3%) – – – 0 (35, 0%) 147 (V147S) 1 (43, 2.3%) – – – 0 (35, 0%) 235 (I235V) 4 (43, 9.3%) 5 (146, 3.4%) 1 (4, 25%) 1 (7, 14.3%) – 289 (T289A) 1 (43, 2.3%) – – 1 (7, 14.3%) 1 (35, 0%) "–" Indicates not reported.
aCVA16 prototype strain (genotype A, G10 type-strain).Table 3. Variations detected in VP1 amino acid sequences of CVA16 strains (compared with U05876/ZA/1951a).
For the CVA6 sequences, for which fewer major epitopes have been described in the literature, only small numbers of samples demonstrated amino acid substitutions; T96A (n = 2/65, 3%), S97N (n = 4/65, 6%), N137S/G/D (n = 16/65, 24.6%), T141A (1/65, 1.5%), V151I (1/65, 1.5%), G160N/S (n = 65/65, 100%), T205I (n = 1/65, 1.5%) and Q216H (n = 1/65, 1.5%) (Table 4).
Site Anhua study n (N, %) Kanbayashi et al. (2017) n (N, %)96 (T96A) 2 (65, 3.1%) 0 (25, 0%) 97 (S97N) 4 (65, 6.1%) 0 (25, 0%) 137 (N137S/G/D) 16 (65, 24.6%) 14 (25, 56%) 141 (T141A) 1 (65, 1.5%) 0 (25, 0%) 151 (V151I) 1 (65, 1.5%) 0 (25, 0%) 160 (G160N/S) 65 (65, 100%) 17 (25, 68%) 165 (Q165R) 1 (65, 1.5%) 0 (25, 0%) 205 (T205I) 1 (65, 1.5%) 0 (25, 0%) 216 (Q216H) 1 (65, 1.5%) 0 (25, 0%) aCVA6 prototype strain (genotype A, Gdula type-strain). Table 4. Variations detected in VP1 amino acid sequences of CVA6 strains (compared with AY421764/US/1949a).
Despite the variations described above, an analysis of selection pressure using MEME revealed that none of the protein-coding sequences showed adaptive evolution for EV-A71, CVA16 or CVA6.
Overview of EVs Serotype Compositions
Phylogeny of VP1 Sequences of EV-A71, CVA16 and CVA6
Phylogeny of Other EVs
VP1 Deduced Amino Acid Sequence Analysis of EV-A71, CVA16 and CVA6
-
The present study describes the genetic characteristics of EVs serotypes associated with HFMD in Anhua County, Hunan Province, China, between 2013 and 2016. The VP1 protein plays a major role in the infectivity, replication and virulence of EVs and is the primary target for neutralizing antibodies. As such, monitoring surveillance of changes within the VP1 region of EVs may allow for the early identification of epidemiological and clinical changes, as well as the identification of potential novel vaccine targets.
All genogroups (or subgenogroups) of the EVs investigated in this study were consistent with the circulating strains reported in mainland China in recent years (Zhang et al. 2010; Baek et al. 2011; Hu et al. 2011; He et al. 2013; Zhang et al. 2013; Chen et al. 2016; Yang et al. 2016; Song et al. 2017; Zhang et al. 2017; Chen et al. 2018). We found that despite the complex epidemic patterns of HFMD recorded in Anhua County (Gao et al. 2018), each serotype investigated demonstrated long-term, population-level, persistent circulation of specific subgenogroups.
Since its first detection in 1998, EV-A71 subgenogroup C4 has persistently circulated in mainland China, while EV-A71 subgenogroup B5 has been reported only sporadically (Zhang et al. 2013). Notably, the C4a subgenogroup is now endemic to China and has been responsible for the ongoing nationwide HFMD outbreak since 2008. Further, our study indicates that C4a remains the single circulating EV-A71 subgenogroup. This finding is in contrast to the EVs circulation patterns reportrd in other areas, such as Taiwan (China), Japan, Singapore, Thailand and Vietnam, in which EV-A71 subgenogroup replacement has been frequently reported (Zhu et al. 2013; Linsuwanon et al. 2014; Le et al. 2019).
Similarly, the cocirculation of multiple lineages (e.g. B1a, B1b and/or B1c) of CVA16 has been observed in Taiwan (China), Malaysia, Thailand, Australia, Vietnam, and Japan (Zhang et al. 2010; Zhao et al. 2016; Sun et al. 2017), while subgenogroups have remained stable in mainland China. A previous analysis of CVA16 epidemic strains found that subgenotype B1 has been the dominant lineage in China since 2000 (Sun et al. 2017). Here, our phylogenetic analysis indicated that, the main circulating CVA16 subgenogroup between 2013 and 2016 was B1b.
In contrast to that of EV-A71 and CVA16, the molecular epidemiology of CVA6 detected in this study was similar to that in the broader Asian region. The emergence of CVA6 as a major cause of atypical HFMD worldwide has been associated specifically with genotype D (Song et al. 2017). HFMD-associated CVA6 subgenogroup D3 was first described following an outbreak in Finland in 2008, followed by other countries across Europe (Bian et al. 2015; Song et al. 2017). Subsequently, the D3 subgenogroup emerged in Asia, and was described from samples taken during outbreaks in Japan, Vietnam and other countries (Anh et al. 2018). In this study, we found that the D3a lineage was the predominant virus in China between 2013 and 2016, and no indication of other emerging subgenotypes was observed.
Although the identified EV-A71, CVA16 and CVA6 sequences belonged to a single subgenogroup across our study period, novel amino acid changes were also detected when compared to the sequences reported in previous molecular epidemiological studies. To our knowledge, amino acid substitutions in the EV-A71 VP1 region at sites Q48R, A54T/V, N104D/H, G239E, T295I/V/S and T296N have been described only in this study. Furthermore, we also found that the detected frequencies of polymorphic sites at positions S283T and A293S/G of the VP1 region were much higher than those in previous reports (van der Sanden et al. 2010; Le et al. 2019).
Interestingly, the amino acid variation D31N in the VP1 region of EV-A71 was previously reported to be associated with higher virulence and neurotropism (Zhang et al. 2014; Le et al. 2019). However, while the D31N mutation was present in most EV-A71 samples (21/24, 87.5%) in our study, all patients with EV-A71 were clinically mild cases, which indicates that D31N may not be the only factor or even a major factor determining the virulence of EV-A71. However, it is worth noting that although all enrolled patients in this study were hospitalized, only one enrolled patient had severe HFMD. This is due to the healthcare system structure in China, where rural healthcare insurance provides a larger proportional reimbursement for costs for inpatient care compared to outpatient care. As such, parents of sick children request hospital admission regardless of disease severity and physicians support these requests due to concern over the development of severe HFMD illness in seemingly mild cases. Unfortunately, this process restricted our ability to compare genetic variation between different groups of disease severity in this study.
Among CVA16 samples, we also detected novel variations at sites P27S, L146X and V147S of the VP1 region. Further, the previously reported variation at site L23I/M/V was detected at higher frequencies in our samples than in previous reports (Sun et al. 2017; Xu et al. 2018), which may be associated with local circulation and environmental factors. However, despite these findings, we did not detect a large degree of genetic diversity in CVA16 viruses, which is consistent with previous findings (Zhao et al. 2016).
CVA6 is a newly emerging virus that is often associated with milder cases and outbreaks of HFMD. Due to the emerging status of this virus, the variation analysisof CVA6 was based on known amino acid sequences and studies of EV-A71 and CVA16. Here, we detected ten variations in the VP1 region of CVA6 (sites 96-98, 102, 106, 151, 160, 165, 174 and 216), that are potentially associated with major neutralization/antigenic epitopes. Additionally, CVA6 samples from our study demonstrated higher rates of the amino acid variation G160N/S in the VP1 region than previously reported. Based on the same analysis method employed in this study, Kanbayashi et al. (2017) showed that only 68% (n = 17) of samples contained the G160N/S variation in the VP1 region. In contrast, 100% (n = 65) of our CVA6-positive samples contained this amino acid change. Furthermore, we detected previously unreported variations at sites 96-97, 141, 151, 165, 205 and 216, which were the main drivers of diversity within the VP1 regions of the CVA6 viruses found in our study.
The above variations in the VP1-region amino acids of EV-A71, CVA16 and CVA6 may contribute to future changes in virulence, antigenic properties or genotype switches in circulating EVs in China. However, because only mild clinical cases of HFMD were enrolled in our study, we could not compare genotype variations between HFMD severity groups. Furthermore, this study only investigated recombination in the VP1 region, while other groups of investigators studied the entire viral genome and found indicators of recombination more frequently occurring within nonstructural proteins (e.g., P2 and P3) (Oberste et al. 2004; McWilliam Leitch et al. 2012). Nevertheless, the data presented here may still contribute to drug target research and multivalent vaccine development.
In conclusion, this study has enriched the data on the genetic characteristics of multiple HFMD-associated EVs. EV-A71 subgenogroup C4a, CVA16 subgenogroup B1b and CVA6 subgenogroup D3a were the predominant EVs lineages in Anhua County, Hunan Province, China. This phylogenetic analysis of the main serotypes of EVs causing HFMD adds to our knowledge about enteroviral evolution and circulation. However, further research regarding amino acid variations and their effects on virulence, antigenic shifts and genotype switches of EVs is required.
-
We thank staff members of the Anhua County-, Yiyang Prefecture-, and Hunan Provincial-level departments of health for providing assistance with administration and data collection; staff members at the Anhua County-, Yiyang Prefecture-, and Hunan Provincial-level CDCs and six study hospitals (Anhua People's Hospital, Anhua Second People's Hospital, Anhua Hospital of TCM, Tianzhuang Township Hospital, Jiangnan Township Hospital, and Qingtang Township Hospital) for providing assistance with field investigation, administration and data collection. This work was supported by the National Science and Technology Major Project of China (No. 2018ZX10201001-010, No. 2017ZX10103009-005, No. 2018ZX10713001-007), the National Natural Science Fund for Distinguished Young Scholars of China (No. 81525023), the National Natural Science Foundation of China (No. 81473031), the Program of Shanghai Academic/Technology Research Leader (No. 18XD1400300), the Li Ka Shing Oxford Global Health Programme (No. B9RST00-B900.57), the Chinese Preventive Medicine Association (No: 20101801). JC is supported by CAS Pioneer Hundred Talents Program.
-
HJY conceptualized, designed and supervised the study. KWL, QHL, PL, MH and SBY coordinated and participated in data collection. YHZ, LLW and QQ performed the experiments. GZ, NTA, NTTH, XW, TTL and JC provided laboratory technical support. YHZ and LVT wrote the first draft of the manuscript. HJY, HRD and LVT revised the manuscript. All authors contributed to review and revision and approved the final manuscript as submitted and agree to be accountable for all aspects of the work.
-
HJY has received investigator-initiated research funding from Sanofi Pasteur, GlaxoSmithKline, and Yichang HEC Changjiang Pharmaceutical Company, none of which is related to HFMD and enteroviruses.
-
This study was approved by the ethical review committees at the Chinese Center for Disease Control and Prevention, World Health Organization Regional Office for the Western Pacific, and the School of Public Health, Fudan University (Gao et al. 2018). Informed verbal consent was obtained from all individual patients' parents/guardians included in the study (Gao et al. 2018).

 DownLoad: