


HTML
-
Japanese encephalitis is a mosquito borne disease and is the leading cause of viral encephalitis in the Asia-Pacific area, with annual cases recently estimated to be ~68, 000 with a 10% to 15% mortality rate (Tsai, 2000; Campbell et al., 2011). JEV is transmitted in a zoonotic cycle, with mosquitoes transmitting the virus through bites, and wading birds and pigs serving as primary wild and domestic amplifying hosts respectively. Phylogenetic investigations of sequences from isolates indicate the presence of five genotypes, GⅠ to GⅤ, with the majority of cases associated with GⅠ and GⅢ. Until the 1990s, G Ⅲ was the dominant genotype associated with outbreaks and other genotypes only occurred sporadically. However, in the last 20 years, evidence indicates that GⅠ has almost completely displaced GⅢ in all regions and is now the dominant genotype.
In an earlier study (Pan et al., 2011), we showed that this GⅢ/GⅠ displacement event was accompanied by an order of magnitude increase in the genetic diversity of GⅠ relative to GⅢ. In a more recent report (Han et al., 2014), we collected all publically available sequences collected from JEV cases and investigated variation in host composition over time and by genotype. Our findings suggested that GⅠ gained dominance by achieving a more focused host range. In particular, (ⅰ) while number of GⅠ isolates associated with mosquitoes and pigs increased over time, consistent with the displacement event, human cases remained predominantly associated with GⅢ and (ⅱ) despite the increase in number of mosquito isolates, the diversity of mosquito types was significantly narrower in GⅠ. This result was also consistent with an experimental study by Schuh et al. (Schuh et al., 2014) which observed higher infectivity for GⅠ in mosquito cells.
In this study, we collected surveillance data on JEV outbreaks spanning the time period over which the GⅠ/ GⅢ displacement event occurred and investigated the relationship between human cases, vaccination, and identified GⅠ and GⅢ cases (via sequencing and phylogenetic analysis of isolates). In regions with comprehensive record keeping and vaccination programs we observed a strong inverse correlation between human cases and GⅠ, further supporting the argument that GⅠ gained dominance by accommodating a narrower host range. These findings highlight the value of comprehensive surveillance data and analytical techniques to complement more experimental methods for the investigation of infectious disease.
-
To obtain a regional summary of the change in the prevalence of JEV and vaccination coverage over time in epidemic and endemic regions in Asia and the Pacific, we performed an online search for publications related to JEV surveillance and vaccination programs, and contacted regional health authorities to gain access to and assistance in interpreting local surveillance data. The downloaded sources comprised published research with entries in PubMed as well as World Health Organization (WHO) Health Bulletins, WHO Weekly Epidemiological Records and National Annual Health Statistics (MHLWJ, 2011; KCDCP, 2012; TMPH, 2012). The reports were reviewed to determine an annual estimate of JEV for each country or region in terms of vaccination coverage, number of cases and number of fatalities. Where possible, preferred reporting items for systematic reviews and meta-analyses (PRISMA) guidelines were adopted in an attempt to identify and account for biasing due to sampling and detection methods (Liberati et al., 2009). In particular, only reports that supplied number of cases and fatalities supplied by local or regional health authorities, and within clearly defined date ranges, were selected. Several of the Chinese papers did not have PubMed entries, and these are listed in supplementary Table S1. The isolation date and location information of sequences were used to determine the presence and absence of each genotype in individual regions over time. Based on this we generated datasets for Mainl and China, Chinese Taiwan, India, Japan, Democratic Republic of Korea (South Korea), Thail and and Viet Nam between 1980 to 2010 for further analysis.
-
The sequence datasets described in (Han et al., 2014) were used to generate a profile of the presence of GⅠ and GⅢ by region over time. Briefly, the data comprised 347 GⅠ and 275 GⅢ isolates retrieved from the GenB ank database (http://www.ncbi.nlm.nih.gov/) with vaccine or derivative strains, in vitro cultured isolates and sequences containing significant numbers of ambiguous non-standard nucleotide or amino acid characters excluded. The sequences were isolated from a variety of hosts (mosquitoes, midges, bats, pigs, horses and humans) with collection dates from 1949 to 2009 and a geographic distribution spanning Mainl and China, Chinese Taiwan, India, Japan, South Korea, Thail and and Viet Nam. The genotype of each isolate was identified by phylogenetic analysis. A full list of sequences and their background information, including identified genotype, is available in the supplementary information in (Han et al., 2014).
-
For Mainl and China, Chinese Taiwan, India, Japan, South Korea, Thail and and Viet Nam there was sufficient genotype information to investigate the relationship between genotype presence and JEV case data. In these cases, each region was investigated by χ2 test to investigate significant variations in cases and fatalities in the presence and absence of vaccination and in the presence and absence of the GⅠ and GⅢ genotypes.
Consolidation of surveillance and vaccinationdata
Sequence datasets
Investigation of correlation between genotype and surveillance data
-
Datasets for Mainl and China (Figure 1), Chinese Taiwan (Figure 2), India (Figure 3), Japan (Figure 4), South Korea (Figure 5), Thail and (Figure 6) and Viet Nam (Figure 7) were generated as described in the Materials and Methods. Based on the available data, these regions were summarized as follows: Mainl and China, GⅠ and GⅢ present over the course of the data, partial but increasing vaccination over the date range but limited details, limited surveillance of insect vectors and arboviruses before 2003 (Liu et al., 2006); Chinese Taiwan, introduction of GⅠ around 2008, high vaccination coverage from 1980 to 2010 (Jan et al., 2000; Huang et al., 2010; Chen et al., 2011). India, introduction of GⅠ around 2009, low vaccination (Umenai et al., 1985; Chakraborty et al., 1987; Angami et al., 1989; George et al., 1990; Mukherjee et al., 1991; Vajpayee et al., 1991; Kar et al., 1992; Vajpayee et al., 1992; Prasad et al., 1993; Thakare et al., 1999; Rao et al., 2000; Chattopadhyay, 2001; Kaur et al., 2002; Potula et al., 2003; Kabilan et al., 2004; Phukan et al., 2004; Mudur, 2005; Parida et al., 2006; Dhillon and Raina, 2008; Saxena et al., 2009; Sarkar et al., 2012; Sarkari et al., 2012; Tiwari et al., 2012). Japan, introduction of GⅠ and displacement of GⅢ 1991 to 1992, nationwide vaccination 1967 to 2004 (Ma et al., 2003; Kuwayama et al., 2005; Saito et al., 2007; Arai et al., 2008; Tang et al., 2010; MHLWJ, 2011; Obara et al., 2011; Konishi et al., 2012). South Korea, introduction of GⅠ and displacement of GⅢ 1991 to 1994, nationwide vaccination program introduced in 1985 (Sohn, 2000; Yun et al., 2010; Takhampunya et al., 2011; KCDCP, 2012; Seo et al., 2013). Thail and, limited genotype information, but reported genotype shift in late 1990s, nationwide vaccination program introduced early 1990s (Henrich et al., 2003; Nitatpattana et al., 2008; Olsen et al., 2010; TMPH, 2012). Viet Nam, No GⅢ cases reported since 2005, limited vaccination data available (Nga et al., 2004; Le et al., 2010; Yen et al., 2010; Ho Dang Trung et al., 2012). For each dataset, to deconvolute the effect of vaccination on human cases, we selected time frames where there was a genotype displacement and there was either no vaccination or comprehensive vaccination in a region.
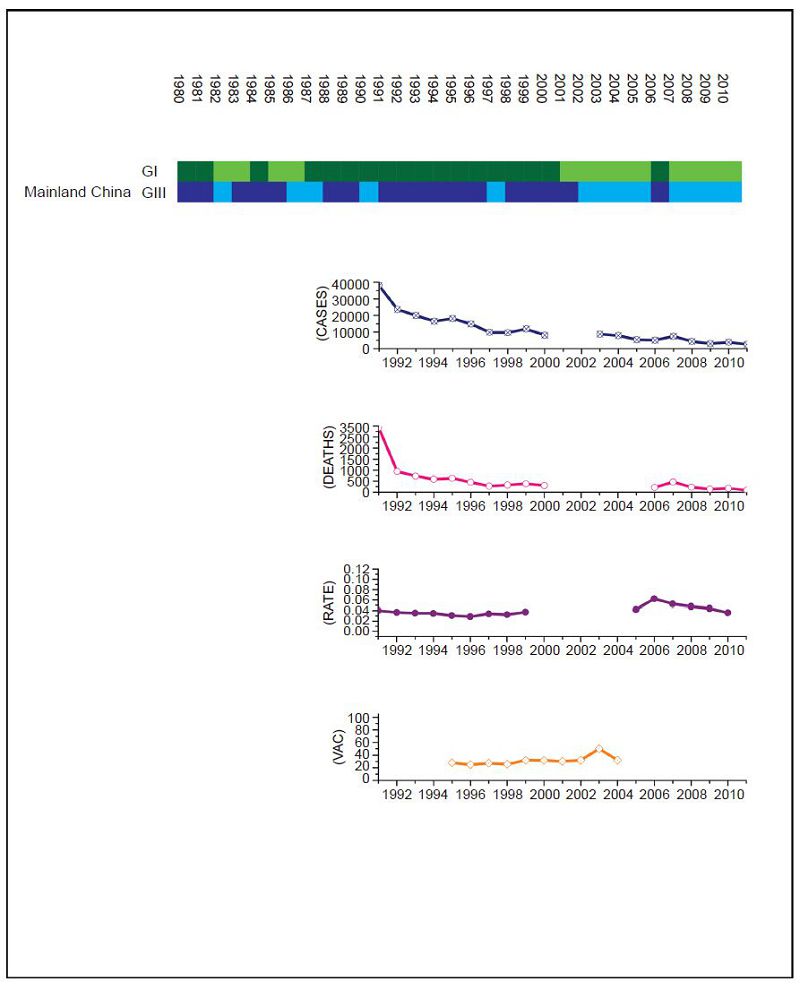
Figure 1. JEV situation in Mainland China. From top to bottom: GⅠ and GⅢ occurrence; number of human cases; number of deaths, mortality rate; vaccination coverage. For GⅠ and GⅢ occurrence, the top row corresponds to GⅠ, the bottom row corresponds to GⅢ. Light green and light blue squares indicate that GⅠ and GⅢ isolates respectively were collected for that year. Dark green and dark blue indicate no isolates were collected for that year. The number of human cases has gradually decreased over the time period due to a progressively more comprehensive national vaccination program, but specific details about the percentage of coverage are not available so details are shown only for Guangxi province.
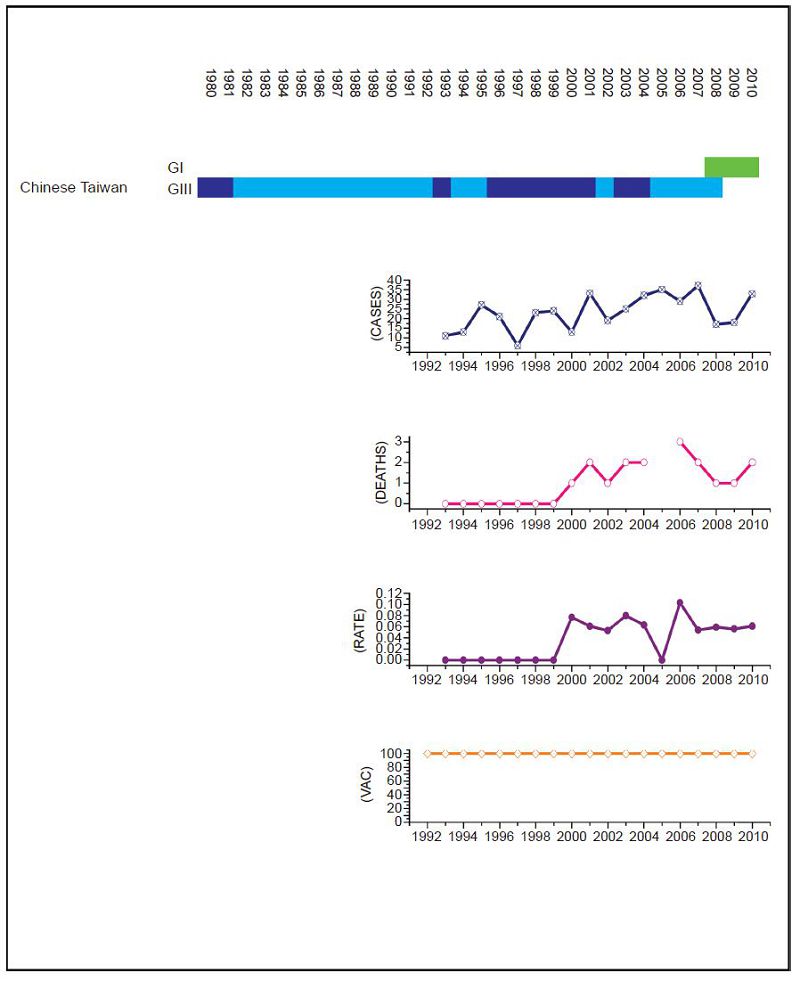
Figure 2. JEV situation in Chinese Taiwan. From top to bottom: GⅠ and GⅢ occurrence; number of human cases; number of deaths, mortality rate; vaccination coverage. For GⅠ and GⅢ occurrence, top row corresponds to GⅠ, bottom row corresponds to GⅢ. Light green and light blue squares indicate that GⅠ and GⅢ isolate respectively was collected for that year. Dark green and dark blue indicate no isolates were collected for that year. Taiwan has an effective vaccination and surveillance program that has brought the number of human cases down to a handful a year.
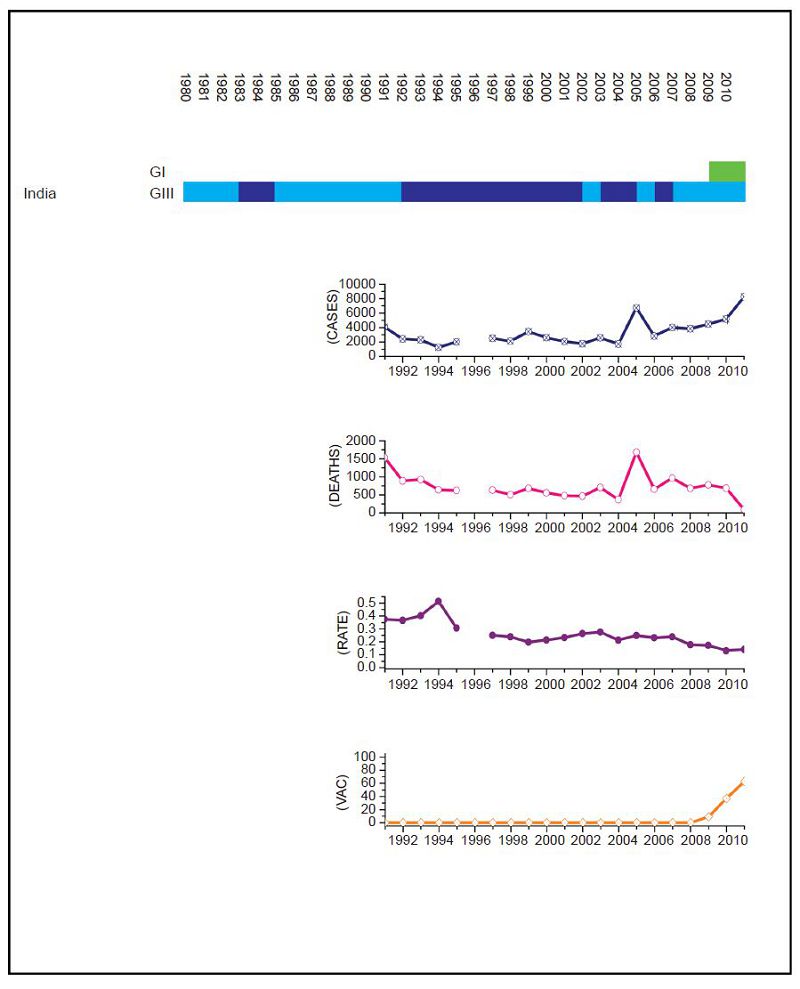
Figure 3. JEV situation in India. From top to bottom: GⅠ and GⅢ occurrence; number of human cases; number of deaths, mortality rate; vaccination coverage. For GⅠ and GⅢ occurrence, the top row corresponds to GⅠ, the bottom row corresponds to GⅢ. Light green and light blue squares indicate that GⅠ and GⅢ isolates respectively were collected for that year. Dark green and dark blue indicate no isolates were collected for that year. Vaccination was introduced in recent years, but is not comprehensive.
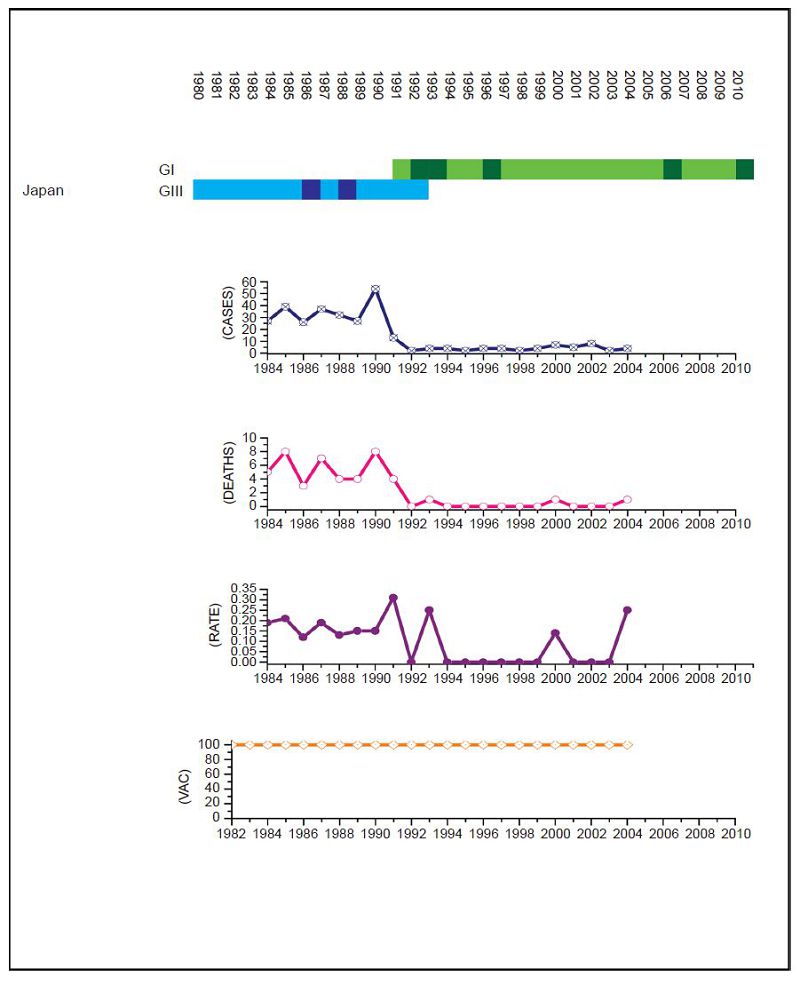
Figure 4. JEV situation in Japan. From top to bottom: GⅠ and GⅢ occurrence; number of human cases; number of deaths, mortality rate; vaccination coverage. For GⅠ and GⅢ occurrence, the top row corresponds to GⅠ, the bottom row corresponds to GⅢ. Light green and light blue squares indicate that GⅠ and GⅢ isolates respectively were collected for that year. Dark green and dark blue indicate no isolates were collected for that year. Japan has an effective vaccination and surveillance program but the number of cases remained between 20 to 60 annually until the early 1990s when there was a dramatic drop that coincided with the GⅢ to GⅠ shift (p = 0.047).
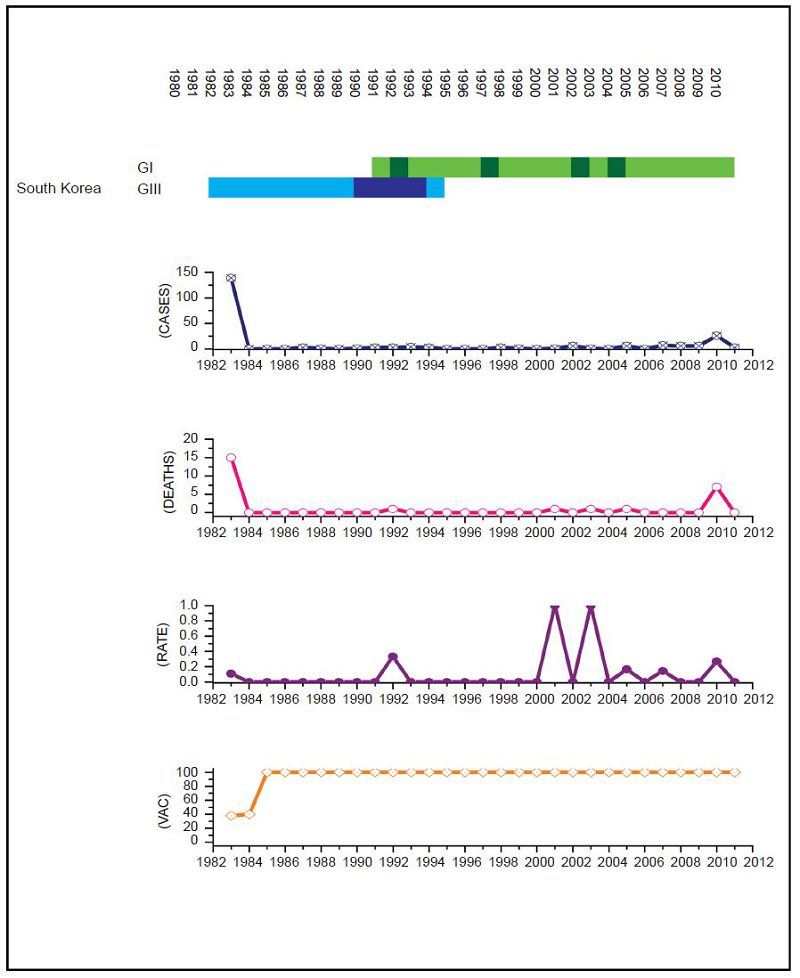
Figure 5. JEV situation in South Korea. From top to bottom: GⅠ and GⅢ occurrence; number of human cases; number of deaths, mortality rate; vaccination coverage. For GⅠ and GⅢ occurrence, the top row corresponds to GⅠ, the bottom row corresponds to GⅢ. Light green and light blue squares indicate that GⅠ and GⅢ isolates respectively were collected for that year. Dark green and dark blue indicate no isolates were collected for that year. South Korea has an effective vaccination and surveillance program that has brought number of human cases down to one or two a year and there is no measurable difference in human cases before and after the GⅢ to GⅠ displacement event.
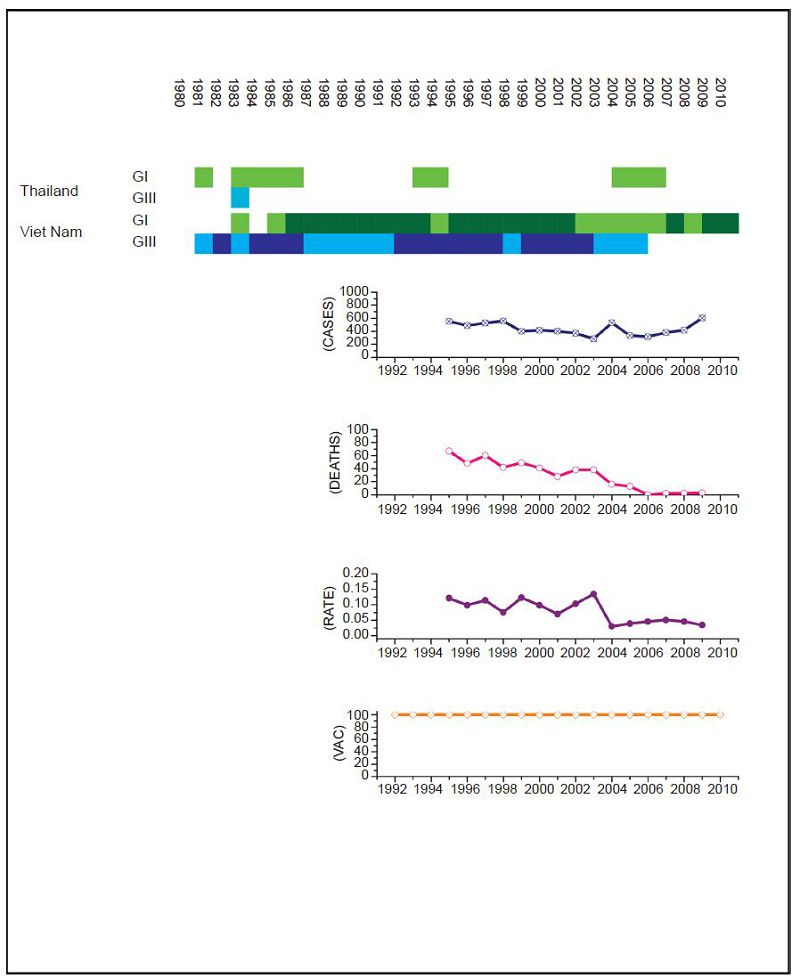
Figure 6. JEV situation in Thailand. From top to bottom: GⅠ and GⅢ occurrence; number of human cases; number of deaths, fatality rate; vaccination coverage. For GⅠ and GⅢ occurrence, the top row corresponds to GⅠ, the bottom row corresponds to GⅢ. Light green and light blue squares indicate that GⅠ and GⅢ isolates respectively were collected for that year. Dark green and dark blue indicate no isolates were collected for that year. The upper graph shows isolates for Thailand, the lower graph shows isolates for Viet Nam; as insufficient data was available for Thailand, Viet Nam was used. The annual number of human cases has remained in the 100s despite a comprehensive and continuous vaccination campaign. However, the mortality rate has decreased significantly since GⅠ became the dominant lineage in the region (p < 2.2 ×10⁻¹⁶).
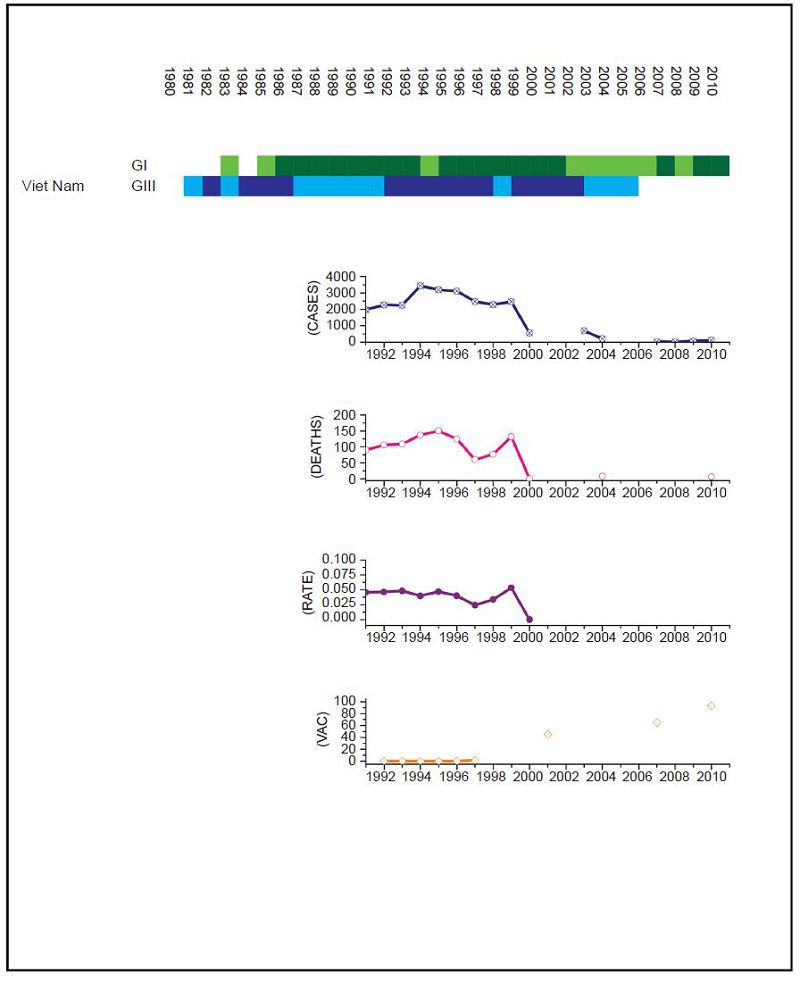
Figure 7. JEV situation in Viet Nam. From top to bottom: GⅠ and GⅢ occurrence; number of human cases; number of deaths, mortality rate; vaccination coverage. For GⅠ and GⅢ occurrence, the top row corresponds to GⅠ, the bottom row corresponds to GⅢ. Light green and light blue squares indicate that GⅠ and GⅢ isolates respectively were collected for that year. Dark green and dark blue indicate no isolates were collected for that year. Limited surveillance data is available over the period to determine the impact of the GⅠ to GⅢ shift.
For India the surveillance data fails to clearly distinguish between JEV and acute encephalitis syndrome (AES) to make reliable estimates except for recent years (NVBDCP, 2012). In Japan, due to some adverse reactions in 2004, vaccination rates dropped between 2005 and 2009, but were resumed in 2010. For Mainl and China, only a single JEV isolate was collected between 1990 and 2001. There are limited sequences available for Thail and and limited surveillance data for Viet Nam so, given the geographical proximity of the two countries, we combined the genotype data for Viet Nam with surveillance data for Thail and to estimate the JEV situation in Thail and. Based on this information, we performed a χ2 test on human case data for (ⅰ) Mainl and China for 1979 to 1996 compared to 2002 to 2010, (ⅱ) Chinese Taiwan for 2006 and 2008 compared to 2009 to 2011, (ⅲ) India for 2006 and 2008 compared to 2009 to 2011, (ⅳ) Japan for 1982 to 1991 compared to 1992 to 2004, (ⅴ) South Korea for 1982 to 1994 compared to 1995 to 2010 and (ⅵ) Thail and for 1995 to 2003 compared to 2004 to 2009. No statistical test was performed for Viet Nam.
For Chinese Taiwan and India there was no statistically significant change observed in human cases before and after the genotype shift event. For Chinese Taiwan, the genotype shift occurred relatively recently (relative to available surveillance data) around 2005 to 2008 and so there is insufficient post shift data for comparison. For India, there is limited reliable surveillance data available as there is no clear distinction between JEV cases and other encephalitis cases. For Japan and Thail and there were significant decreases in the mortality rate after the genotype shift event (p = 0.047 and p < 2.2 × 10⁻¹⁶ respectively). For South Korea, there was also a statistically significant difference between the two time intervals (p = 0.014), that indicated there were more cases after the shift event, but this was due to a single outbreak that occurred in 2010 that dominated the dataset, which is primarily comprised of one or two cases/year for the last 25 years. For Mainl and China, there was a significant difference between mortality rates for the two time frames, consistent with the gradual increase in vaccination coverage that has occurred over the last thirty years (Liu et al., 2006).
Association between vaccination, JE humancases and genotype shift.
-
Japanese encephalitis has a major impact on public health in the Asia-Pacific area. While effective vaccines exist, they are based on GⅢ, which was the dominant genotype at the time, and the observation that GⅠ was gradually displacing GⅢ raised concerns regarding the continuing efficacy of the vaccine. There have been many publications related to GⅢ displacement in various countries and regions, e.g. (Nga et al., 2004; Nitatpattana et al., 2008; Chen et al., 2011; Fulmali et al., 2011), but these have focused on reporting the displacement, rather than investigating the cause. While lineage displacement is a common event, JEV is distinct insofar as, compared to many other viruses, it is highly conserved between genotypes, and there is less than 1% variation between GⅠ and GⅢ. Thus, underst and ing the mechanisms driving this displacement could help to determine the significance and impact of future events.
In this study, we have attempted to build a comprehensive dataset describing the JEV GⅢ/GⅠ displacement event from a number of different perspectives. In our earlier work, we consolidated all sequence data collected from across JEV incidence regions and investigated how host composition varied over the course of the genotype displacement event. Based on this, we were able to identify significant differences in the host range of the two genotypes. In particular, the majority of sequence isolates from human cases remained associated with GⅢ, suggesting that GⅠ might be less effective at infecting humans. In this work, we built on these results and examined whether this difference was also visible in surveillance data. We used sequence data to build a GⅠ/ GⅢ presence profile for each region and combined this with vaccination and human case data collected at a regional scale in an attempt to identify differences between "before" and "after" GⅢ to GⅠ shift events. In this way we have created a comprehensive dataset describing the impact on JEV in the Asia-Pacific area over the course of the last thirty years. For regions where there was comprehensive data available, and a well-defined genotype shift there was a distinct and statistically significant drop in human cases when the shift from GⅢ to GⅠ occurred. However, in the majority of cases, there was insufficient data to support this time of analysis or to achieve statistical significance.
One possible criticism of our analysis of surveillance data is the problem of sampling bias, including under-reporting of human cases, difference in detection methods, variation in testing over time and the question of what defines a true JE case. For this reason, we deliberately restricted our analysis to comparison of datasets within each country or region, over a limited time frame (and over a period for which vaccination was either comprehensive or non-existent) and only considered more recent data. In fact, similar concerns can be raised at widely quoted estimates of global incidence of JEV which are based on the same data sources (Burke and Leake, 1988; Nishijima et al., 2012) and here at least we are able to avoid bias that might be present in the studies, introduced by regional differences in surveillance techniques, as we are only performing comparison of data collected from a single country or region. Additionally, other factors such as the challenge of accurate diagnosis of JEV (Solomon et al., 2008), variation and advances in diagnostic methods (Shrivastva et al., 2008; Dong et al., 2012), and climatic changes (Johansson et al., 2009; Le Flohic et al., 2013) could also confound this analysis, and could also be factors in the observed changes. However, for these factors, we would expect either a gradual change (as new technology is gradually adopted) or periodic or r and om fluctuations (in the case of climatic factors). In the case of the data from Japan, the genotype replacement occurred within a well-defined time interval, there was no changes in diagnostic methods and was accompanied by an order of magnitude drop in the number of recorded cases.
While the apparent reduced infection efficacy in humans implies there may be a reduced probability of human infections, this is counterbalanced by the higher infection rates in pigs and mosquitoes, which are primarily responsible for the viral replication cycle. The predicted increase in infection rates indicates there will be higher numbers of infected mosquitoes, which suggests the higher probability of spillover could compensate for a probability of lower infection. This highlights the necessity of continuing comprehensive vaccination and prevention strategies. Our approach demonstrates the value of combining and analyzing different data types to describe the evolution of a virus and the subsequent impact on the environment, as well as the value of comprehensive surveillance data and case reports. Nevertheless, our analysis hypothesizes rather than concludes an association between genotype shift and drop in number of human cases. Thus, experimental investigation and additional data collection are needed to further confirm whether there are distinct differences between GⅠ and GⅢ in terms of in terms of symptoms, severity of infection and mortality rates.
-
This work was supported by NSFC grant number 81371810.
-
The authors declare that they have no conflict of interest. This article does not contain any studies with human or animal subjects performed by any of the authors.
-
NH and SR designed the analysis. NH, SR, WF, SLQ & JA carried out the analysis and interpretation of results, NH, SR & JA wrote the paper. All authors read and approved the final manuscript.
Supplementary figures/tables are available on the website of Virologica Sinica: www.virosin.org; link.springer.com/journal/12250.
-

Table S1. List of Chinese papers

 DownLoad: