HTML
-
Severe acute respiratory syndrome coronavirus 2 (SARS-CoV-2) is the cause of the ongoing coronavirus disease 2019 (COVID-19) pandemic worldwide (Huang et al. 2020). It is the seventh coronavirus discovered that infects humans, and is related to the two other highly pathogenic human coronaviruses SARS-CoV and Middle East Respiratory Syndrome (MERS-CoV), which emerged in 2003 and 2012 (Drosten et al. 2003; Zaki et al. 2012), respectively. SARS-CoV-2 emerged in December 2019 with the first human cases in Wuhan, and then reported worldwide to become a major threat to human health (Ren et al. 2020; Zhou et al. 2020). The World Health Organization (WHO) official declared COVID-19 a pandemic on March 11th, 2020, and as of February 13th, 2021, over one hundred and seven million cases of COVID-19 have been confirmed worldwide, including over 2.3 million deaths (https://covid19.who.int/). The absence of approved vaccines and specific antiviral drugs seriously hinders pandemic control. Up to now, several vaccines are undergoing clinical testing but there is still no satisfactory progress in the development of antiviral drugs. This situation underscores the urgency for developing biosafe and convenient drug screening and evaluation systems.
Reverse genetic systems are useful platforms for exploring new pathogens, including developing and assessing antiviral therapeutics, clarifying viral pathogenesis and host–pathogen interactions (Almazán et al. 2014). With regards to coronavirus (CoV), reverse genetics once seemed difficult due to the large size of the CoV genome (~30,000 nucleotides) and the instability of cloned gene sequences in E. coli. Recently, great progress has been made in this field, and some non-traditional approaches have been successfully used (Almazán et al. 2014), including cloning in low-copy bacterial artificial chromosomes (BACs) (Almazán et al. 2000), in vitro ligation (Yount et al. 2003, 2000), using vaccinia virus as a vector (Thiel and Siddell 2005), or using transformation-associated recombination cloning in Saccharomyces cerevisiae (Nikiforuk et al. 2016; Thi et al. 2020). Reverse genetics is usually used for building infectious cDNA clones, which can produce genetically manipulatable infectious viruses for the study of viral processes. Another important aspect of reverse genetic in viral research is the creation of viral replicons that lack structural proteins and defective for infectious viral particle production. However, as replicons are self-amplifying nucleic acids and contain all elements for viral RNA synthesis (Almazán et al. 2014), they constitute a safe and convenient substitution for studying viral replication-related processes and antiviral drug evaluation targeted at replication related processes, especially for pathogens requiring biosafety level 3 (BSL3) practices and containment like SARS-CoV-2.
In response to the SARS-CoV-2 pandemic, reverse genetic systems have been rapidly deployed to explore and characterize this new pathogen. Thao et al. first generated SARS-CoV-2 infectious clones using one-step transformation-associated recombination cloning (Thi et al. 2020). Xie et al. constructed an infectious cDNA clone of SARS-CoV-2 and generated a reporter virus by in vitro ligation. This group also characterized this recombinant virus in comparison with clinical isolates (Xie et al. 2020). Hou et al. generated a SARS-CoV-2 infectious cDNA clone and reporter virus, and explored the pathogenesis of SARS-CoV-2 using these systems (Hou et al. 2020). However, all of these reported reverse genetic systems of SARS-CoV-2 are infectious cDNA clones, meaning experiments carried out with them need to be set up in BSL3 facilities which are costly, time-consuming, and require extensive training. More noteworthy is that the BSL3 facilities requirement makes it challenge to implement antiviral drug screening assay with infectious SARS-CoV-2 at many research institutes and pharmaceutical companies. Therefore, biosafe experimental systems for evaluating antiviral drugs and studying SARS-CoV-2 are critical and urgently needed. Here, we report the construction of plasmid-based, non-infectious SARS-CoV-2 replicons with reporter genes. Replication of these replicons was achieved simply by direct transfection of cells with the replicon plasmids. Using these non-infectious replicons, the effects of the known replication inhibitors E64-D and remdesivir were confirmed, and the 50% maximal effect concentration (EC50) value for these two compounds was estimated, indicating that these non-infectious SARS-CoV-2 replicons are useful tools for antiviral drug evaluation.
-
293 T cells were purchased from ATCC and cultured in Dulbecco's modified Eagle's medium (DMEM) supplemented with 10% fetal bovine serum (FBS) and 100 μg/mL penicillin/streptomycin.
-
Antibody against tGFP (TA150041) was purchased from OriGene Technologies (Rockville, MD, USA), antibody against SARS-CoV-2 Nucleocapsid protein (40143-R019) was from Sino Biological (Beijing, China), and β-Actin antibody (A1978) was from Sigma-Aldrich (St. Louis, MO, USA). IRDye 680-or 800-labeled secondary antibodies were obtained from LI-COR Biosciences (Lincoln, NE, USA). E64-D (S7393) and remdesivir (S8932) were purchased from Selleck (Houston, TX, USA). E64-D and remdesivir were kept in DMSO at the concentration of 40 mg/mL and 10 mmol/L as stock solutions respectively.
-
The whole designed sequence of our SARS-CoV-2 replicon was divided into 26 fragments, and each one contained an ~ 30 bp overlap with its neighboring fragments. Among these, fragment 1 (F1) contained the CMV promoter and 5′UTR of viral genome, fragment 26 (F26) contained the 3′UTR, polyA sequence, HDVRz, and BGH, and fragment 24 (F24) contained the blasticidin deaminase gene and partial ORF8 sequences were chemically synthesized. Fragment 23 (F23) containing the turboGFP coding gene was obtained by PCR amplification using pCMV6-AN-GFP as the template. The other fragments were all obtained by RT-PCR from viral RNA. The whole reverse genetic system was based on the virus strain EPI_ISL_403929 (GISAID database, which was identical in sequence to GenBank accession number MN908947). All primers used in this process are listed in Supplementary Table S1. SARS-CoV-2 was isolated as reported previously (Ren et al. 2020), and viral RNA was provided by Dr. Lili Ren (IPB, Chinese Academy of Medical Sciences and Peking Union Medical College, Beijing, China) and was extracted from supernatant from SARS-CoV-2-infected cells. The 26 gene fragments were then stepwise assembled by overlap extension PCR and produced nine final fragments designated as F1–F4, F5–F8, F9–F11, F12–F13, F14–F17, F18–F19, F20–F22, F23–F24, and F25–F26. F1–F4 was further cloned into a T-vector for NSP1 deletion mutation, and the resulting fragment was termed F1–F4 ΔNSP1. The reverse genetic strategy for SARS-CoV-2 replicon construction is illustrated in Fig. 1.
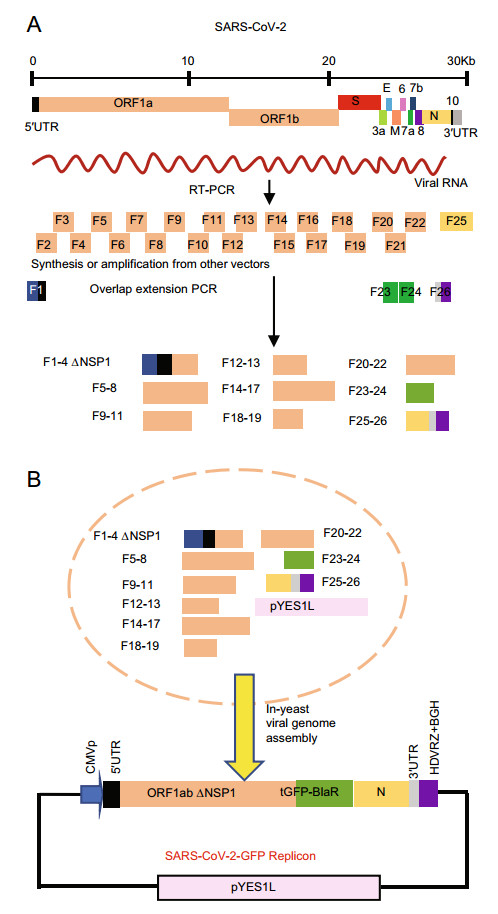
Figure 1. Assembly of a SARS-CoV-2-GFP replicon. A Genome structure of SARS-CoV-2 and workflow of fragment generation to assemble a SARS-CoV-2-GFP replicon. The open reading frames (ORFs) of viral genes and sequences of untranslated regions (UTRs) are indicated. B Strategy for transformation-associated recombination (TAR) of SARS-CoV-2-GFP replicon fragments in yeast. Relevant sequences are indicated. CMVp: cytomegalovirus promoter; ORF1ab ΔNSP1: ORF of viral 1ab gene deleted with coding region for NSP1; tGFP-BlaR: GFP-blasticidin deaminase fusion gene; HDVRZ: hepatitis delta virus ribozyme; BGH: bovine growth hormone termination and polyadenylation sequences.
-
Transformation-associated recombination was performed using the GeneArt® High-Order Genetic Assembly System (Invitrogen, Carlsbad, CA, USA), according to the manufacturer's instructions. In brief, nine or ten DNA fragments for SARS-CoV-2 replicon (200 ng each) together with 100 ng of linear pYES1L vector were transformed into MaV203 cells using the PEG/LiAc method. The transformed cells were then grown on CSM-Trp agar plates for three days at 30 ℃. The resulting colonies were screened for yeast colony PCR, and the assembled construct was then electroporated into One Shot® TOP10 Electrocomp™ E. coli cells. Colonies were then screened for one fragment by PCR, and one positive colony was prepared for plasmid extraction.
-
SARS-CoV-2 replicon/pYES1L plasmids were purified using the HiSpeed Plasmid Maxi Kit (QIAGEN, Hilden, Germany). 293 T cells were transfected with SARS-CoV-2 replicon/pYES1L plasmid using Lipofectmine 3000 (Invitrogen) according to the manufacturer's protocol. Briefly, 293 T cells grown to 80% confluence were transfected with 2 μg of SARS-CoV-2 replicon/pYES1L plasmid with 4 μL Lipofectamine 3000 per well in 12-well plate or transfected with 200 ng of SARS-CoV-2 replicon/pYES1L plasmid with 0.4 μL Lipofectamine 3000 per well in 96-well plate. Thirty-six hours after transfection, the nuclei were stained with Hoechst (Invitrogen) and then fixed with 4% paraformaldehyde, fluorescence were observed and imaged by fluorescence microscopy, and cells were then harvested for Western blot analysis and luciferase activity assay.
-
Cells were lysed on ice for 30 min in lysis buffer (25 mmol/L Tris–Cl, 150 mmol/L NaCl, 1 mmol/L EDTA, and 1% NP-40, pH 7.4) supplemented with protease inhibitor cocktail (Roche, 04693132001). Whole-cell extracts (20–100 μg) were separated by 10% SDS-PAGE and then transferred to nitrocellulose membranes (Pall, 66485). After blocking with 5% dried milk at room temperature for 1 h, the membranes were probed with indicated primary antibodies at an appropriate dilution overnight at 4 ℃. The following day, the membranes were incubated with corresponding IRDye 680-or 800-labeled secondary antibodies and were then scanned using the Odyssey Infrared Imaging System (LI-COR Biosciences, Lincoln, NE, USA).
-
The cell viability of the tested drugs on 293 T cells was determined by CCK8 assays (Absin, Shanghai, China). To calculate EC50 of E64-D, 293 T cells were seeded in 96-well plates at a density of 4 × 10⁴ cells/well. After cell adherence, the cells were transfected with SARS-CoV-2-GFP or SARS-CoV-2-GFP-Luc replicon plasmid. According to a previous study about SARS-replicon, E64-D was added into the medium about twelve hours post-transfection (Wang et al. 2008). In this study, ten hours post-transfection was chosen as the time point to add E64-D, the culture medium was changed with indicated dosages of E64-D were added directly to the medium. E64-D was diluted to 1 mmol/L with fresh culture medium and then further diluted to the indicated concentration by threefold serial dilutions. Thirty-six hours post-transfection, cells were fixed for fluorescence intensity quantification by SpectraMax iD5 microplate reader (Molecular Devices, Sunnyvale, CA, USA), lysed for Western blot assay detect tGFP-BlaR expression or lysed for luciferase activity assay. The luciferase activity assay was carried out using a luciferase assay system (Promega, Madison, WI, USA) according to the manufacturer's instructions. Then, dose response curves were drawn, and the EC50 was calculated using GraphPad Prism software by nonlinear regression. The EC50 of remdesivir was determined by the same method as E64-D except that the different dosages of remdesivir were added to the culture media just before transfection. This time point was determined according to previous studies that remdesivir was added into culture media before replicon transfection (Zhang et al. 2020; Xia et al. 2020).
Cells
Antibodies and Chemical Reagents
Generation of Viral Subgenomic Fragments
Transformation-Associated Recombination of SARS-CoV-2 Replicon Fragments in Yeast
Plasmid Purification and Transfection
Western Blot Analysis
Calculating EC50 Value
-
In order to rapidly construct SARS-CoV-2-GFP replicon plasmids and bypass the instability of viral gene fragments in E. coli, transformation-associated recombination (TAR) cloning in S. cerevisiae was chosen as a strategy, as this approach has been successfully used for the rapid construction of MERS-CoV and SARS-CoV-2 infectious clones (Nikiforuk et al. 2016; Thi et al. 2020). The overall reverse genetic strategy is illustrated in Fig. 1. This replicon includes untranslated 5′ and 3′ ends of the viral genome, the replicase gene ORF1ab with an NSP1 deletion, since this suppresses host gene expression and may be toxic in transfected cells (Shi et al. 2020; Yuan et al. 2020), as well as the nucleocapsid N gene that has been reported to be required for viral RNA synthesis, a partial sequence of ORF8 and transcription regulatory sequence (TRS) of the N gene and ORF10. In order to enable easy quantification of viral replication and selection of replicon-containing cells, a GFP-blasticidin deaminase fusion gene (GFP-BlaR) was inserted to substitute for the spike gene under the control of the TRS of the spike gene. This strategy has been successfully used by others to construct SARS-CoV-derived replicon cell lines (Ge et al. 2007). This whole replicon genome was placed under control of a cytomegalovirus (CMV) promoter. Hepatitis delta virus ribozyme (HDVRz), bovine growth hormone termination, and polyadenylation (BGH) sequences were also added to the 3′ region of Poly A sequences to ensure the production of integral viral RNAs.
This whole reverse genetic system was based on the virus strain EPI_ISL_403929 (GISAID database, which is identical to GenBank accession number MN908947). The designed replicon genome was divided into 26 fragments (F1–F26, Fig. 1A, also see Supplementary Materials). Most of the fragments were generated by RT-PCR from viral RNA, and the rest including F1, F23, F24, and F26 were generated by PCR from chemically synthesized cDNAs or other vectors (Fig. 1A). Each fragment contains a ~30 bp overlap with its neighboring fragments and was then stepwise assembled by overlap extension PCR. Finally, nine sub-genomic fragments were obtained and transformed into S. cerevisiae MaV203 cells with linear pYES1L vector for homologous recombination (Fig. 1B). pYES1L vector is a YAC-BAC shuttle plasmid that can be used as a cloning vector for the simultaneous and seamless assembly of DNA fragments in S. cerevisiae cells. Furthermore, the BAC-based design overcomes the stability issues when transformed into E. coli cells. This plasmid also has been reported successfully used in constructing MERS-CoV infectious clone previously (Nikiforuk et al. 2016). After growth for three days at 30 ℃, recombinant yeast colonies began to appear on CSM-Trp agar plates (Fig. 2A). Four yeast colonies were randomly picked and screened for three replicon fragments (F12–F13; F18–F19; F23–F25) by yeast colony PCR, and the results showed that all four colonies were positive for the three tested fragments (Fig. 2B), indicating the high efficiency of the TAR cloning system. Afterward, the assembled constructs in positive yeast colonies were transferred to E. coli, and five colonies were then picked and screened for replicon fragments (F16–F17) by PCR. Again, the results indicated that all of the five colonies were positive (Fig. 2C). Then, these plasmids were isolated from E. coli. The finally obtained plasmid was screened for all nine fragments used in yeast homologous recombination by PCR, and the results showed that all of them were present in the resulting plasmid and were of anticipated sizes (Fig. 2D). Next, the assembled SARS-CoV-2-GFP replicon plasmid was sequenced, and three point-mutations were identified in the whole sequence (Table 1), two with amino acid mutations in the coding region of NSP2 and NSP3, and one with no amino acid change in the coding region of NSP12. These individual mutations occurred during RT-PCR and overlap extension PCR since the large size of the SARS-CoV-2 genome.
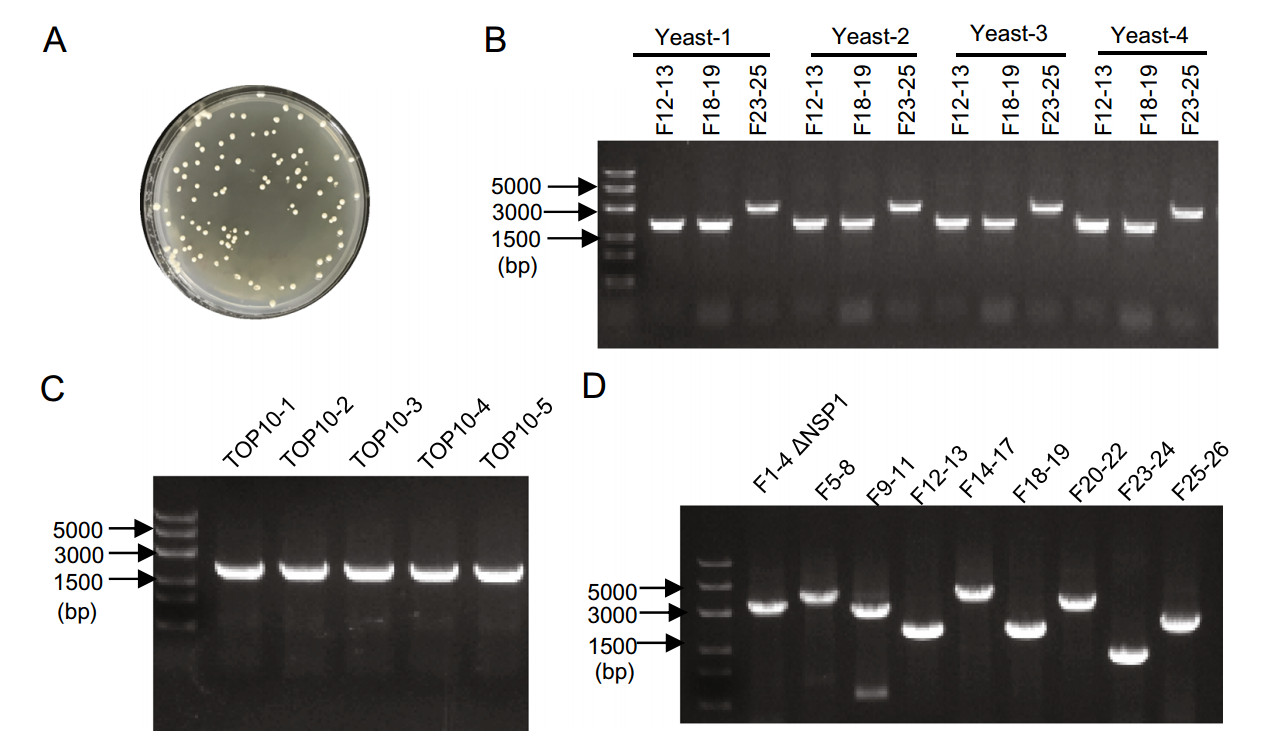
Figure 2. Verification of a SARS-CoV-2-GFP replicon plasmid. A Recombinant yeast colonies on CSM-Trp agar plates. B Transformed yeast clone was tested for fragments F12–F13, F18–F19, and F23–F25 by yeast colony PCR. C E. coli clones transformed with yeast plasmid were tested for F16–F17 by PCR. D Recombinant SARS-CoV-2-GFP replicon plasmid was tested for all nine sub-genomic fragments used in yeast homologous recombination by PCR.
Encoded protein Genomic position Nucleotide change Amino acid change NSP2 397 C → T Thr → Met NSP3 6969 T → C Leu → Pro NSP12 14,559 G → A None Table 1. Sequence analysis of SARS-CoV-2-GFP replicon.
-
To verify whether our SARS-CoV-2-GFP replicon plasmid was valid, this plasmid was transfected into 293 T cells. Thirty-six hours post-transfection (hpt), tGFP expression was monitored using fluorescence microscopy, and obvious green fluorescence was visually observed in SARS-CoV-2-GFP-transfected cells but not in non-transfected cells (Fig. 3A). Then, Western blot was used to further confirm the expression of the tGFP-BlaR gene and viral nucleocapsid (N) protein, and as shown in Fig. 3B, both the tGFP-BlaR fusion gene and N protein could be detected in SARS-CoV-2-GFP-transfected cells. The tGFP-BlaR fusion gene was expressed as a 40 kDa protein as expected. Collectively, these results demonstrated that the SARS-CoV-2-GFP replicon could replicate and be transcribed in transfected cells. To optimize the time point for following drug evaluation, kinetics study of tGFP-BlaR expression after SARS-CoV-2-GFP replicon transfection was carried out and the results showed that the tGFP-BlaR signal began to be detected at 12 hpt and peaked at 36 hpt (Fig. 3C). Therefore, thirty-six hours post-transfection was chosen as the time point to evaluate the activity of antiviral drugs in the following study.
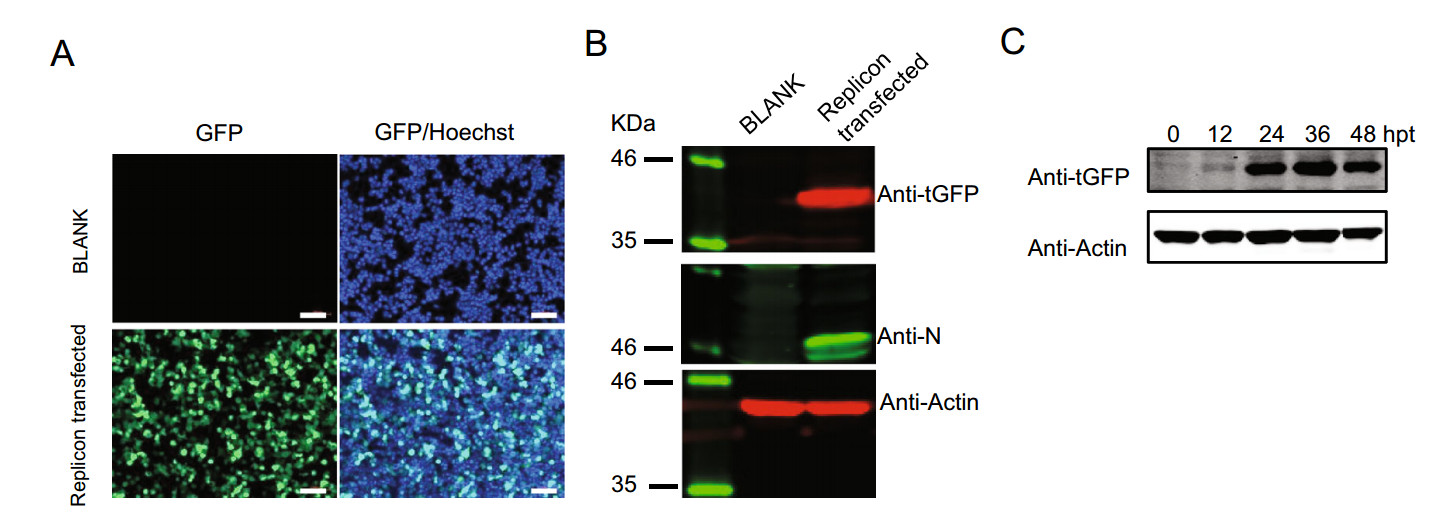
Figure 3. SARS-CoV-2-GFP replicon transfection assay. A Fluorescence microscopy monitoring tGFP expression. 293 T cells were transfected or nontransfected (BLANK) with SARS-CoV-2-GFP replicon, and 36 h post-transfection, cells were fixed, observed and photographed, the nuclei were stained with Hoechst dye, scale bar: 100 µm. B 293 T cells were transfected or nontransfected (BLANK) with SARS-CoV-2-GFP replicon, and 36 h post-transfection, cells were lysed followed by Western blot to monitor the expression of tGFP-BlaR, Nucleocapsid protein (N), and Actin was used as a loading control. C Kinetics of tGFP-BlaR expression, 293 T cells were transfected with SARS-CoV-2-GFP replicon and were lysed at indicated hours post-transfection (hpt) and tGFP-BlaR expression was monitored by Western blot, Actin was used as a loading control.
-
To explore the utility of the SARS-CoV-2-GFP replicon for antiviral drug evaluation, we tested the dose-responsive effect of two previously reported coronavirus replication inhibitors. The first inhibitor was E64-D, which is a cysteine proteinase inhibitor and blocks replicase polyprotein processing in viral replication (Kim et al. 1995). This was reported to work well in both SARS-CoV tissue culture systems and replicon systems (Ge et al. 2007; Wang et al. 2008; Yount et al. 2003). E64-D treatment at a concentration of 0.1 mg/mL and 0.2 mg/mL significantly reduced the tGFP fluorescence in SARS-CoV-2-GFP replicon-transfected 293 T cells at 36 h post-transfection when observed under a fluorescence microscope (Fig. 4A). This reduction in tGFP expression was also evident by Western blot for tGFP-BlaR expression (Fig. 4B). The second inhibitor tested was remdesivir, which is an adenosine analogue and can incorporate into nascent viral RNA chains to result in pre-mature termination (Pruijssers et al. 2020). Remdesivir was recently recognized as a promising antiviral drug against a wide array of RNA viruses including the Ebola virus, SARS-CoV, and MERS-CoV (Sheahan et al. 2017), as well as SARS-CoV-2 in cell culture (Wang et al. 2020) and animal models (de Wit et al. 2020), and is currently under clinical development for the treatment of Ebola virus infection and SARS-CoV-2 infection (Hashemian et al. 2020). Consistent with other reports, remdesivir inhibited tGFP expression in SARS-CoV-2-GFP replicon-transfected 293 T cells and exhibited an obvious dose dependence by both fluorescence microscopy observation (Fig. 4C) and Western blot for tGFP-BlaR expression (Fig. 4D). Collectively, our results demonstrated the suitability of this SARS-oV-2-GFP replicon system for evaluating and studying candidate antiviral agents.
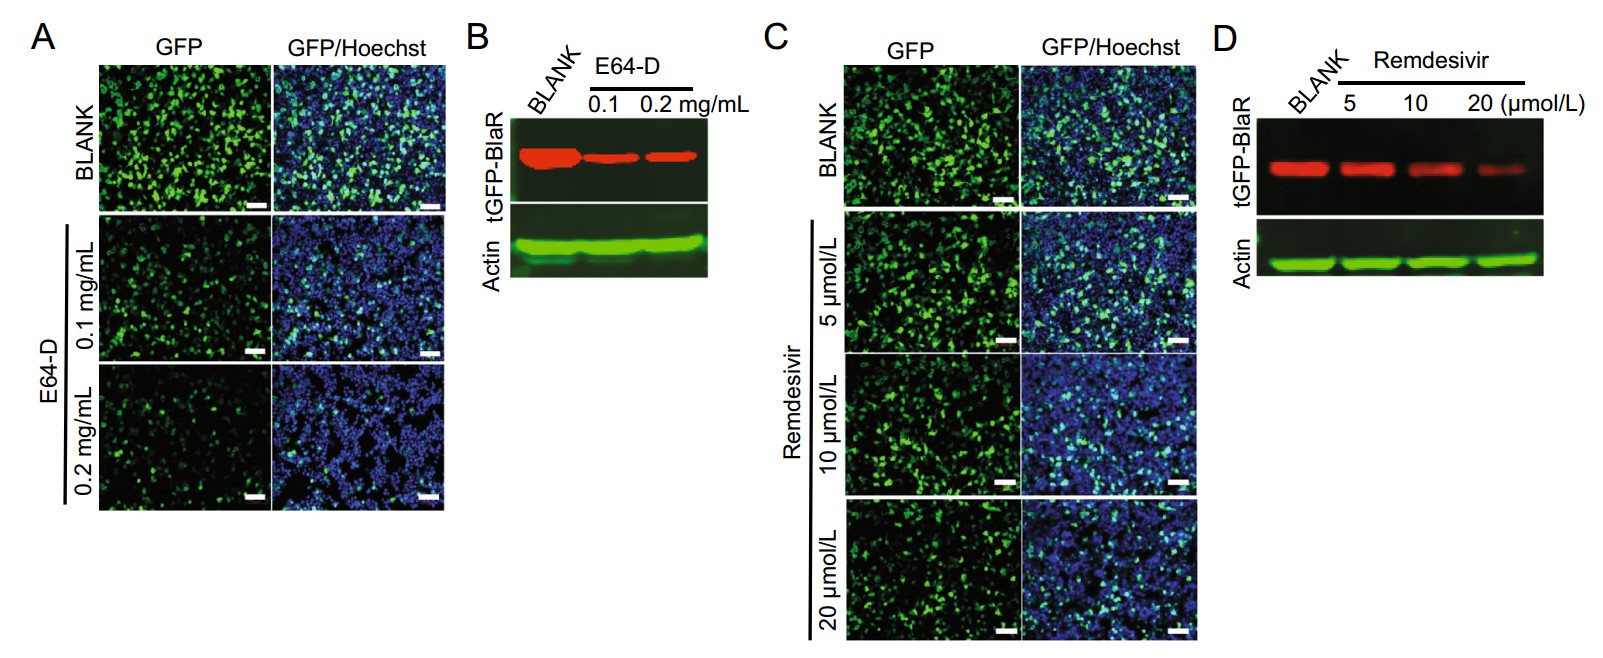
Figure 4. Inhibitory effect of E64-D and remdesivir on a SARS-CoV-2-GFP replicon. A, B 293 T cells were transfected with SARS-CoV-2-GFP replicon, and ten hours post-transfection, cells were treated or nontreated (BLANK) with E64-D at indicated concentrations. Thirty-six hours post-transfection, cells were observed and photographed by fluorescence microscopy, the nuclei were stained with Hoechst, scale bar: 100 µm (A) or lysed for Western blot monitored the expression of tGFP-BlaR, actin was used as a loading control (B). C, D 293 T cells were transfected SARS-CoV-2-GFP replicon, and cells were treated or nontreated (BLANK) with remdesivir at indicated concentrations just before transfection. Thirty-six hours post-transfection, cells were observed and photographed using fluorescence microscopy, the nuclei were stained with Hoechst, scale bar: 100 µm (C), or lysed for Western blot for tGFP-BlaR, Actin was used as a loading control (D).
-
A good drug evaluation system usually reflects a well dose-responsive relationship, and the half-maximal effective concentration (EC50) is often used to evaluate the antiviral effect of a specific compound. Although E64-D and remdesivir exhibit dose-dependent antiviral effect on the replicon system, we explored this replicon system to estimate the EC50 value of the two compounds. We used two methods to quantification tGFP-BlaR expression and calculated EC50 respectively to test the reproducibility of the system. First, we determined GFP fluorescence intensity by a microplate reader and drawing dose-responsive curve with the fluorescence intensity value (Fig. 5A and 5B), then the EC50 value of the two compounds was calculated as 36.3 μmol/L and 8.93 μmol/L respectively (Fig. 5A and 5B). We also evaluated cell viability using CCK8 assay in parallel in 293 T cells and demonstrated that although cytotoxic effects were observed at the highest concentration of E64-D and remdesivir in the assay, no cytotoxic effects were observed at the EC50 concentration of both two drugs (Fig. 5A and 5B). Next, we determined tGFP-BlaR expression by Western blot assay, as shown in Fig. 5C and 5E, the expression of tGFP-BlaR decreased gradually when the dose of E64-D and remdesivir increased. By drawing dose–response curves using the ratio of tGFP-BlaR/β-actin gray values from Western blot, the EC50 value of E64-D and remdesivir was determined as 47.60 μmol/L and 6.76 μmol/L (Fig. 5D and 5F). These results are very similar to the previous results determined by fluorescence intensity value and the slight difference is due to different detection methods. Taken together, these results further demonstrated that a SARS-CoV-2-GFP replicon could be reliably used to evaluate antiviral drugs.

Figure 5. Determining the EC50 of E64-D and remdesivir using a SARS-CoV-2-GFP replicon. A, B 293 T cells were transfected with SARS-CoV-2-GFP replicon, E64-D and remdesivir were added to culture media 10 h post transfection or just before transfection respectively, the green fluorescence intensity was determined thirty-six hours post-transfection, and dose responsive curves were drawn and EC50 value of E64-D (A) and remdesivir (B) was calculated by four-parameter nonlinear regression respectively. Cell viability was determined by CCK8 assay in parallel on 293 T cells. The experiments were done in triplicates. C–F Replicon transfection and drug treatment were performed as mentioned in (A, B), thirty-six hours post-transfection, Western blot for tGFP-BlaR expression was carried out with E64-D (C) and remdesivir treated cells (E). EC50 value of E64-D (F) and remdesivir (G) as determined by dose response curves using the ratio of tGFP-BlaR/β-actin gray values with different concentration and calculated by four-parameter nonlinear regression. The experiments were done at least two times.
-
In order to expand the application scope of our replicon system, we constructed a dual-reporter SARS-CoV-2-GFP-Luc replicon using our original SARS-CoV-2-GFP replicon. We engineered a firefly luciferase (FLuc) in frame with ORF8 of the viral genome (Fig. 6A). The previously mentioned transformation-associated recombination cloning protocol was carried out, but the fragment F23–F24 used in SARS-CoV-2-GFP recombination was substituted with F23 and F24-FLuc. Ten sub-genomic fragments together with linearized pYES1L were transformed into S. cerevisiae MaV203 cells to obtain a reassembled replicon plasmid (SARS-CoV-2-GFP-FLuc). The resulting plasmid was also screened for all fragments used in recombination by PCR, and our results demonstrated that all were present (Fig. 6B). Then, the SARS-CoV-2-GFP-FLuc replicon was transfected into 293 T cells, and luciferase activity was detected thirty-six hours post-transfection. The results showed a ~ 6000-fold increase in luciferase activity in SARS-CoV-2-GFP-FLuc replicon-transfected cells (Fig. 6C), demonstrating this replicon worked well. Similarly, kinetics study monitoring luciferase activity after SARS-CoV-2-GFP-Fluc replicon transfection was carried out, and the result showed 36 hpt was also the peak time point of luciferase activity (Fig. 6D). Next, this SARS-CoV-2-GFP-FLuc replicon was transfected into 293 T cells, and the EC50 value of E64-D was determined. Thirty-six hours post-transfection, cells were lysed, and dose response curves were drawn with the luciferase activity values or tGFP-BlaR/β-actin gray values determined by Western blot respectively. The EC50 of E64-D was derived to be 48.95 μmol/L by luciferase signals (Fig. 6E), and was 36.67 μmol/L determined by tGFP-BlaR signals (Fig. 6F). The results determined by the two indicators are comparable to each other, indicating the utility of this SARS-CoV-2-GFP-FLuc replicon for drug evaluation as well.
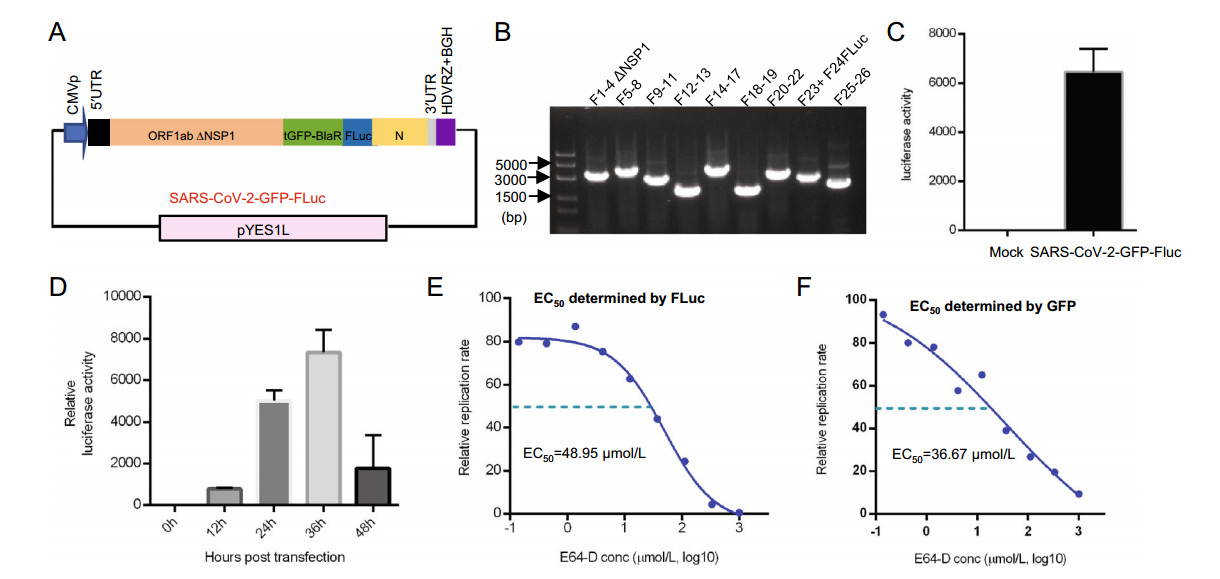
Figure 6. Construction a SARS-CoV-2-GFP-FLuc replicon and determination of the EC50 of E64-D. A Diagram of SARS-CoV-2-GFP-FLuc replicon. B Verification of a SARS-CoV-2-GFP-FLuc replicon plasmid. Recombinant SARS-CoV-2-GFP-FLuc replicon plasmid was tested for all sub-genomic fragments used in yeast homologous recombination by PCR. C Luciferase activity in nontransfected (BLANK) or SARS-CoV-2-GFP-FLuc replicon-transfected or 293 T cells, the luciferase activity was determined 36 h post transfection. D Kinetics study of luciferase activity after SARS-CoV-2-GFP-FLuc replicon transfection, 293 T cells were transfected with SARS-CoV-2-GFP-Fluc replicon and luciferase activity was determined at indicated hours post-transfection (hpt). E EC50 value of E-64D was determined using a dose response curve drawn based on luciferase activity in SARS-CoV-2-GFP-FLuc-transfected 293 T cells using four-parameter nonlinear regression. F EC50 value of E-64D was determined using a dose response curve drawn based on the ratio of tGFP-BlaR/β-actin gray values with different concentration and calculated by four-parameter nonlinear regression, the experiments were done at least two times.
Design and Construction of a SARS-CoV-2-GFP Replicon
Confirmation of SARS-CoV-2-GFP Replicon in Transfected Cells
Inhibitory Effects of E64-D and Remdesivir on SARS-oV-2-GFP Replicon
Evaluation of the Half-Maximal Effective Concentration (EC50) of E64-D and Remdesivir with a SARS-oV-2-GFP Replicon System
Development of a Dual-Reporter SARS-CoV-2-GFP-FLuc Replicon System
-
We report here the development of non-infectious replicons of SARS-CoV-2. One of the most promising applications of these replicons is their use to facilitate antiviral drug evaluation without manipulating infectious viruses. Thus, these biosafe experimental systems are powerful tools for pharmaceutical companies for developing countermeasures to COVID-19. Furthermore, these SARS-CoV-2 replicons also allow exploration of molecular mechanisms of SARS-CoV-2 viral replication and viral-host interactions. Since the replicons constructed in this study were plasmid-based, they can be easily manipulated and introduced with any expected mutations for detailed studies about host–pathogen interactions.
In our replicon system, we introduced blasticidin deaminase gene fused with GFP to facilitate selection of replicon-containing cells. This method has been successfully used to generate SARS-CoV-derived replicon cell lines (Ge et al. 2007). However, we could not establish a SARS-CoV-2-derived replicon cell line using this strategy. We thought there were two possible reasons for this. First, some cytotoxic viral genes could still be associated with these replicons and were disturbing normal cell growth. In our design of these two SARS-CoV-2 replicons, we already deleted the coding region of NSP1 as NSP1 is not essential to coronavirus replication and has been reported to be toxic to host cells by suppressing host gene expression (Shi et al. 2020; Yuan et al. 2020). Alternatively, the cell line we used for these studies was not amenable to the creation of stable SARS-CoV-2 replicon cell lines. We used 293 T and BHK21 cells in our original attempt to establish SARS-CoV-2-derived replicon cell lines, but all of these attempts failed. We hypothesize that these cell lines were not permissive for SARS-CoV-2 replicon integration. The permissiveness of the host cell is an important factor contributing to efficient RNA replication and is determined by various complex host factors. Like other RNA viruses, for example, HCV, whole genome replicon-derived cell lines can only be successfully established in particular cell lines like Huh-7 cells (Bartenschlager et al. 2003; Horscroft et al. 2005). As for SARS-CoV-2 replicon-derived cell lines, more attempts with different cell lines are needed as these would be additional tools for exploring this virus.
Remdesivir has been recently demonstrated to be potently active against SARS-CoV-2 in vitro and in vivo (Choy et al. 2020; Pruijssers et al. 2020; Wang et al. 2020). The viral target of remdesivir is the RNA-dependent RNA polymerase (RdRp) of SARS-CoV-2, NSP12, which was also included in our replicon system. We tested the effect of remdesivir on our SARS-CoV-2-GFP replicon, and our results again confirmed the inhibitory effect of remdesivir, with an EC50 value of 8.93 μmol/L or 6.76 μmol/L using our replicon by different quantification methods. In previous studies, the EC50 of remdesivir on SARS-CoV-2 has been reported differently, from 0.01 μmol/L to 26.9 μmol/L (Pruijssers et al. 2020). The reason for these differences in EC50 values may be due to the different cell lines, quantification methods, and assay conditions used, such as the drug incubation period (Pruijssers et al. 2020). One recent report demonstrated that the potency of remdesivir was directly related to the intracellular concentration of the pharmacologically active triphosphate metabolite, indicating an intrinsic difference in the cell line used greatly contributed to the differences in EC50 values reported for remdesivir (Pruijssers et al. 2020). Another compound with known inhibitory effects used in this study was E64-D, which is a cysteine proteinase inhibitor and has been reported to inhibit replicase polyprotein processing in mouse hepatitis virus strain A59 (MHV-A59) (Kim et al. 1995). This inhibitor has been reported to work well on SARS-CoV and SARS-CoV replicons at a concentration of 0.4–0.5 mg/mL (Ge et al. 2007; Wang et al. 2008; Yount et al. 2003). In our replicon systems, the inhibitory effect was evident at a relatively low concentration of about 0.1–0.2 mg/mL, and the EC50 value determined was about 40 μmol/L, meaning a drug concentration about 13.7 μg/mL, indicating the reliability and sensitivity of our replicon systems.
In the SARS-CoV-2-GFP-FLuc replicon system, two reporter genes were utilized. This enables different laboratories to choose different readouts for the drug evaluation or to use two indicators at the same time. Occasionally, a single indicator may not be suitable for a certain drug. In our study, we did not detect an inhibitory effect of remdesivir on SARS-CoV-2-GFP-FLuc when testing luciferase activity but detected the decreased expression of luciferase by Western blot for unknown reasons, and we will further explore the reasons in the future study. Meanwhile, in this study, we did not monitor the stability of SARS-CoV-2-GFP-FLuc replicon when passaged in E. coli, whether two reporter genes increase the instability of the replicon should be assessed cautiously in future use.
During this manuscript prepared, three articles about SARS-CoV-2 replicon have been reported (Kotaki et al. 2020; Zhang et al. 2020; Xia et al. 2020). Except the construction strategy is different, the replicons in this study have their own characteristics: Firstly, the replicons constructed in this study are plasmid-based. Replication of these replicons was achieved simply by direct transfection. Secondly, the transcription of viral genome is driven by a CMV promoter thus bypasses the complicated RNA operation in vitro transcription. Furthermore, transfection with plasmids may provide high replication efficiency and more stable readouts. Thirdly, we generate a replicon with dual reporter genes, which expands the application scope and flexibility of the replicon system.
Taken together, in this study we have established non-infectious SARS-CoV-2 replicons with different reporter genes by reverse genetics. These SARS-CoV-2 replicons represent safe and flexible systems for antiviral drug evaluation.
-
This work was supported by the CAMS Innovation Fund for Medical Science (CIFMS 2016-I2M-1-014), the National Key Plan for Scientific Research and Development of China (2016YFD0500300), National Key R&D Program of China (2020YFA0707600) and Beijing Municipal Science and Technology Project (Z201100001020005).
-
B.W. and C.Z. performed the experiments; B.W. and H.H. wrote the paper, L.R. and X.L. provided advice and revised the paper; H.H., J.W., and Z.Z. conceived the project and provided overall direction.
-
A patent application has been filed on 13 October 2020 on SARS-CoV-2 replicon construction (China Patent Application No. 202011091157.1).
-
This article does not contain any studies with human or animal subjects performed by any of the authors.




 DownLoad: