


HTML
-
Human endogenous retroviruses (HERVs) are derived from multiple independent integrations of exogenous retroviruses in our ancestor's germ cell, most of which are more than 30 million years old (Bannert and Kurth 2006). After initial integration, some HERV elements were amplified within the genome via re-infection or intracellular retrotransposition (Dewannieux and Heidmann 2013); consequently, HERVs currently account for about 8% of the human genome (for protein-coding genes, about 1%) (Lander et al. 2001; Harrow et al. 2009). Over the course of co-evolution with the host, HERVs sequences have accumulated a large number of mutations, insertions, and deletions at the subject of natural selection (Gifford et al. 2018). Indeed, most HERVs in our genome contain no internal genes but solo-LTR (long-terminal repeat), which is a result of the recombination of 5′ and 3′ LTRs (Bolze et al. 2017). Therefore, the sequences of present-day HERVs are highly diverse and show defective replication. Although most HERVs are structurally incomplete and their activity is strictly controlled by epigenetic regulation (like DNA and histone methylation, histone deacetylation) (Hurst and Magiorkinis 2017; Fu et al. 2019) and 18-nt and 22-nt 3′-tRNA fragments (tRFs) (Schorn et al. 2017), transcriptions of some elements have been detected under a variety of physiological or pathological conditions. Traditional studies on HERVs have mostly focused on their relationship with cancer (Golan et al. 2008; Kahyo et al. 2013), pluripotency (Romer et al. 2017), and neurological diseases (Kury et al. 2018).
A few studies had found that there is a certain undefined correlation between HERVs and antiviral innate immunity. In animals, some endogenous retroviruses (ERVs) have been found to be co-opted by the host for resistance to the infection and replication of ERV-related exogenous viruses. For example, in mice, the Fv-1 and Fv-4 gene products derived from endogenous murine leukemia virus (MLV) provided resistance against exogenous MLV infection (Jolicoeur and Baltimore 1976; Ikeda and Odaka 1983; Taylor et al. 2001); in sheep, endogenous jaagsiekte sheep retrovirus (enJSRV) could suppress exogenous JSRV invasion (Spencer et al. 2003; Mura et al. 2004). Furthermore, it has been reported that transcription levels of env or gag genes of HERV-K or HERV-W increased significantly after infection by several viruses, like influenza A virus (Flu-A) (Nellaker et al. 2006), hepatitis B virus (HBV) (Liu et al. 2017), Epstein Barr virus (EBV) (Hsiao et al. 2009), and etc. Collectively, these studies suggest that some ERVs may have been integrated in the antiviral immune defense system of the host.
In addition, we previously reported the transcriptional profile of HERV loci in human A549 cells infected with dengue virus serotype 2 (DENV-2) (Wang et al. 2020); we found that a large number of HERV loci were up-regulated in DENV-2 infected cells. Interestingly, the reactivated loci tended to be distributed near immune-related genes and were expressed in a pattern consistent with that of the genes. On the basis of these findings, we defined a DEHERV-G pair as a pair of HERV and its nearest human gene (within 100 kb) on the same strand that was differentially expressed to describe the relationship between HERV reactivation and host genes under viral infection. However, it is necessary to explore whether the overall induction of the HERV loci is specific to DENV infection or a common phenomenon associated with viral infections. Although element activation of HERVs after viral infections had been detected using PCR amplification or microarray analysis in some studies (Muradrasoli et al. 2006; Tabone et al. 2018), the obtained results may not be comparable with those of other previous studies because the former targeted a limited number of members of the HERV family rather than the overall family. With the rapid development of RNA sequencing technology, RNA-seq datasets have become increasingly popular and are freely shared for scientific research; it is a convenient method for studying genome-wide transcriptional regulation of ERV under a range of physiological or pathological conditions.
In this study, we reanalyzed the published RNA-seq data corresponding to multiple viral infections that were downloaded from the NCBI database before March 31, 2020; we determined changes in the expression profiles of HERV induced by different viral infections. By comparing the related DEHERV-G pairs in each dataset, we identified 43 key HERV loci that were located near interferon-stimulated genes (ISGs) and were simultaneously up-regulated after exogenous viral infections. Our results provide evidence of the close association between HERVs and human antiviral responses.
-
We obtained RNA-Seq datasets of virus-infected human cells from the Sequence Read Archive (SRA) database (http://www.ncbi.nlm.nih.gov/sra/) using the SRA prefetch tool (v 2.9.3). The following accession numbers were used: PRJNA495858, PRJNA605905, PRJNA551246, PRJNA559203, PRJNA577579, PRJNA549926, PRJNA555053, PRJNA545099, PRJNA615032, and PRJNA609228. In addition, the transcriptomic findings of DENV-2 infected A549 cells reported in our previous study were included in the subsequent comparative analysis. Illumina RNA-seq reads, including those of single-end and double-end sequences, were used as expression data. Each dataset contained mock treated cells as the control, and each treatment was performed with 2-4 biological replicates. According to the conditions of viral infection, including the viral strain, time after infection, and cell type, abbreviations were assigned to the corresponding samples. For example, "HCV_12h_mock" represents the control sample for the sample that was analyzed 12 h after hepatitis C virus (HCV) infection. Summary of samples used in this study is shown in Table 1, and details of experiments and methods could be found in the original reports corresponding to the datasets.
Virus Hours post-infection Virus strain Cell Accession number DENV-2 72 TSV01 A549 PRJNA552644 Flu-A – PR8 A549 PRJNA495858 Flu-B – B/Yamagata A549 PRJNA605905 ZIKV 48 FSS13025 hiNPCs PRJNA551246 48 PE243V hiNPCs HCV 12 – Huh7 PRJNA559203 36 – Huh7 60 – Huh7 WNV – – A549 PRJNA577579 CCHFV 24 – Huh7 PRJNA549926 72 – Huh7 24 – HepG2 72 – HepG2 EBV – Akata differentiated NOKs PRJNA555053 – Akata undifferentiated NOKs MV – – MSC (5H) PRJNA545099 – – MSC (hTERT) RSV 24 A2 A549 PRJNA615032 SARS-CoV-2 24 USA-WA1/2020 A549 PRJNA615032 24 USA-WA1/2020 NHBE RHV 6 – Calu3 PRJNA609228 24 – Calu3 Table 1. Summary of samples used in this study.
-
Data analyses were performed as described previously (Wang et al. 2020). Briefly, the quality of raw reads were assessed with FastQC (v 0.11.5) (Andrews 2010), and the low-quality reads were filtered out with Trimmomatic (v 0.38) (Bolger et al. 2014). The resulting reads were aligned upon the human genome GRCh38 with HISAT2 (v 2.1.0) (Kim et al. 2015), and counted using the "primary" option of featureCounts (v 1.6.3) (Liao et al. 2014), where only reads uniquely assigned to a single feature were counted. This approach may underestimate the total expression of features to some extent and slightly bias the expression values of older HERV elements, but allows convincing counts to be assigned to individual features. Conversely, if multiple mapped reads are not excluded, false positive expression of many undesired HERV loci may be detected. Therefore, using the unique mapped reads is more likely to avoid false positives for transcribed HERV loci. Ensembl GRCh38 version 95 GTF was used for annotated genes, while the GTF was derived from HERVd database containing the most extensive HERV loci for HERV loci annotation (Paces et al. 2004). In each experiment, features with less than 5 assigned reads across all samples were discarded.
-
The DESeq2 package was executed for differential expression analysis of human genes and HERV loci (Love et al. 2014). Adjusted P < 0.05 and | log2 fold change | > 1 were considered to be significant (Haase et al. 2015). When both HERV and its neighboring human gene were both differentially expressed (DE), they were collectively referred to as DEHERV-G pair. Subsequently, we calculated the number of DEHERV-G pairs in each dataset; we used Venn in TBtools to show their overlap and Gene Locations in TBtools to show the location of their components on chromosomes (Chen et al. 2020). The distribution of HERV loci relative to human genes (within exons, introns, UTRs, and 5 kb up- and down-stream regions) was determined using the read distribution module in the RSeQC package (v 3.0.1) (Wang et al. 2012).
-
PPI network was constructed by using the Search Tool for the Retrieval of Interacting Genes/Proteins (STRING) database retrieval tool (http://stringdb.org/) (Szklarczyk et al. 2019). Interactors with a combined confidence score of ≥ 0.4 were selected, and based on these scores, the PPI network was illustrated using Cytoscape (Shannon et al. 2003).
-
The differentially expressed genes (DEGs) in the DEHERV-G pairs were subjected to Gene Ontology (GO) functional analysis and Kyoto Encyclopedia of Genes and Genomes (KEGG) pathway analysis using the clusterProfiler package (Yu et al. 2012). The GO categories include biological process (BP), cellular component (CC), and molecular function (MF). To reduce redundancy, the enrichGO analysis was followed by the "simplify" function as suggested by the author. Adjusted P < 0.05 was defined the threshold of statistical significance.
RNA-Seq Datasets
Reads Mapping and Counting
Differential Expression Analysis
Construction of Protein–Protein Interaction (PPI) network
Functional Enrichment Analysis
-
As reported previously, we have observed that DENV infection induces HERVs activation. To explore whether this phenomenon is ubiquitous in viral infections, we used data obtained by the infection of human cells with multiple exogenous viruses to study the activation of HERV. Specifically, we performed a total of 179 SRA runs to download 21 high-throughput RNA-seq datasets from the SRA database and then re-analyzed them. These data covered 11 different viruses, including Flu-A, influenza B virus (Flu-B), Zika virus (ZIKV), HCV, measles virus (MV), West Nile virus (WNV), Crimean-Congo hemorrhagic fever virus (CCHFV), respiratory syncytial virus (RSV), rhinovirus (RHV), EBV, and severe acute respiratory syndrome coronavirus type 2 virus (SARS-CoV-2). In addition, we included our previously published DENV-2 infection data in this study for a comprehensive comparative analysis. The virus strains, infected cells, and time after infection of each sample are shown in Table 1.
After quality control of the raw reads, we obtained a total of about 1 TB of clean reads, and over 85% of reads, as a whole, were aligned with the human GRCh38 reference genome. Subsequently, using Ensembl GRCh38_95 GTF and the created HERV GTF as the annotation files, we detected human genes and HERVs expression in all analyzed samples. We found that approximately 1% of total reads corresponded to HERVs and that approximately 60% of total reads were mapped to human gene annotations. An overview of the RNA-Seq data is presented in Supplementary Table S1.
The principal component analysis of the transformed expression of all 22 datasets is shown in Fig. 1. We found that samples were clustered within group and dispersed among the groups, and the samples of the same virus under different infection conditions were relatively closely distributed. For the expressions of human genes, HCV, CCHFV, and ZIKV groups were clearly subdivided from other virus samples. The overall expression of HERVs was similar in most datasets, whereas EBV and HCV samples were significantly different compared to the other groups.
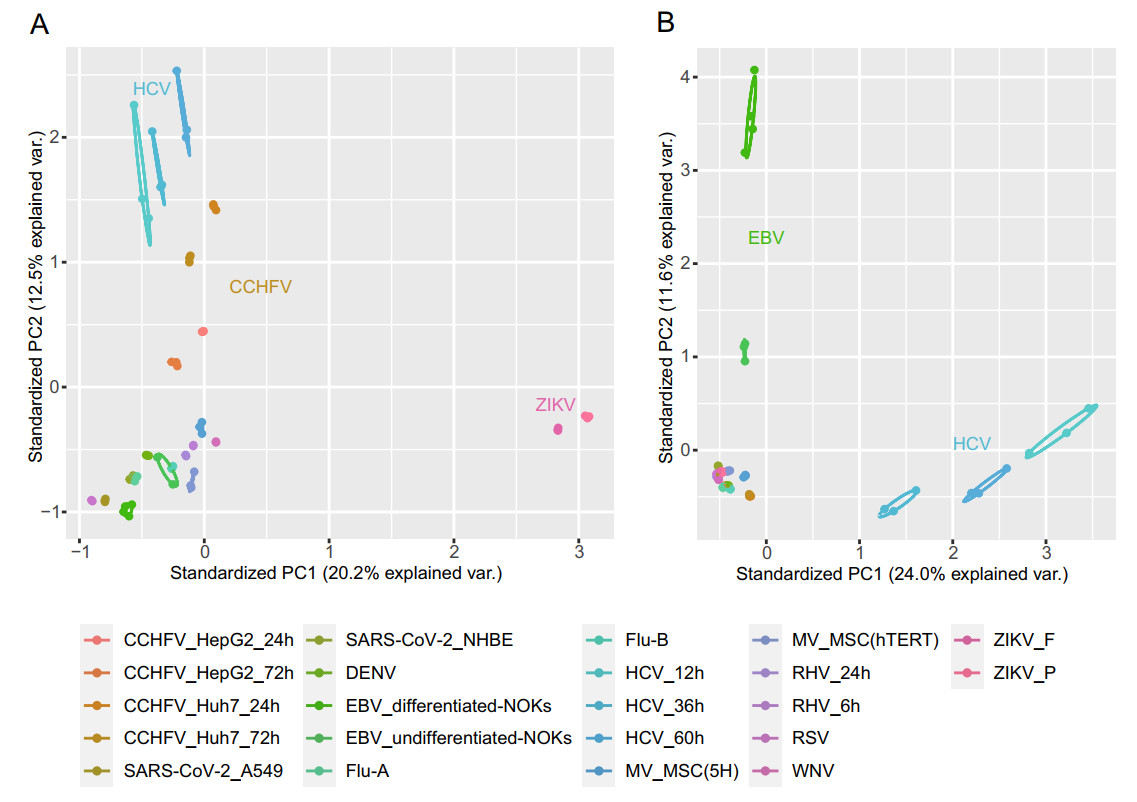
Figure 1. PCA analysis of the transformed expression values of human genes (A) and HERV loci (B).
-
Following conventional practices, we defined significantly differentially expressed human genes and HERV loci (DEGs and DEHERVs) as those with | log2 fold change | ≥ 1 with an adjusted P of ≤ 0.05. Data corresponding to DEGs and DEHERVs in all datasets are listed in Table 2. We found that the induction effects of some viruses, such as DENV-2 (4701 DEGs and 3033 DEHERVs), Flu-A (9130 DEGs and 6799 DEHERVs), and Flu-B (5544 DEGs and 2486 DEHERVs), were obvious. Compared to other respiratory viruses (like RSV with 659 DEGs and 75 DEHERVs), the SARS-CoV-2 USA-WA1/2020 strain (published in March 2020) had a weaker induction effect (33 DEGs and 6 DEHERVs in A549 cells, 127 DEGs, and 17 DEHERVs in normal human bronchial epithelial (NHBE) cells). A total of 30, 549 DEGs and 16, 707 DEHERVs were detected. After adjusting for redundancy, 16, 248 DEGs and 11, 427 DEHERVs were obtained, indicating that there was a crossover between the HERVs loci activated by different viral infections. In addition, correlation analysis showed that the number of DEHERVs was positively correlated with the number of DEGs (R2 = 0.9484) (Supplementary Fig. S1).
Dataset Number of DEGa Number of DEHERVb Up-regulated Down-regulated Total Up-regulated Down-regulated Total DENV-2 2942 1759 4701 2352 681 3033 Flu-A 5341 3789 9130 4810 1989 6799 Flu-B 3667 1877 5544 1408 1078 2486 ZIKV_F 1072 274 1346 536 68 604 ZIKV_P 408 49 457 270 12 282 HCV_12h 4 4 8 0 0 0 HCV_36h 354 49 403 152 2 154 HCV_60h 1118 345 1463 208 33 241 WNV 825 52 877 349 6 355 CCHFV_Huh7_24h 12 0 12 6 0 6 CCHFV_Huh7_72h 559 348 907 147 61 208 CCHFV_HepG2_24h 44 1 45 20 0 20 CCHFV_HepG2_72h 121 77 198 45 8 53 EBV_differented-NOKs 237 772 1009 245 146 391 EBV_undifferented-NOKs 90 173 263 70 36 106 MV_MSC(5H) 1383 115 1498 1128 85 1213 MV_MSC(hTERT) 733 191 924 319 64 383 RSV 430 229 659 69 6 75 SARS-CoV-2_A549 32 1 33 6 0 6 SARS-CoV-2_NHBE 104 23 127 14 3 17 RHV_6h 1 0 1 2 1 3 aDifferentially expressed human gene; bdifferentially expressed HERV. Table 2. Summary of differentially expressed human genes and HERVs in each dataset.
Subsequently, we compared the DEHERVs of each dataset in pairs. As shown in Supplementary Fig. S2A, the 22 datasets were clearly divided into two clusters, where EBV and HCV groups were significantly different from the other groups, which was similar to the expression of genome-wide HERV loci (Fig. 1B). Among them, ZIKV_F (FSS13025, isolated in Brazil in 2015) and ZIKV_P (PE243, a progenitor strain isolated in Cambodia in 2010) had the highest correlation coefficient, and 279 of 282 DEHERVs in the ZIKV_P group overlapped with those in the ZIKV_F group, indicating that the induction of HERVs by different strains was highly consistent. Moreover, the Flu-A and DENV groups shared the highest number of HERVs, followed by the Flu-A and Flu-B groups. In addition, the HCV, CCHFV, and RHV groups contained RNA-seq data obtained after different hours post infection (hpi); we found that exogenous viral infections affected the expressions of HERVs in a time-dependent manner. In the early stage of infection, the expressions of a small number of HERVs and host genes were changed, and the number of DEGs and DEHERVs was observed to increase with time (Supplementary Fig. S2B, Table 2). For example, relative to the mock treated group, 0, 154, and 241 DEHERVs in HCV-infected cells were detected at 12, 36, and 72 hpi, respectively.
It was worth noting that, with the exception of the major down-regulation of human genes in the two EBV groups, the number of up-regulated HERVs and genes was higher than the number of down-regulated HERVs and genes in cells infected with these viruses. Collectively, these results indicate that exogenous viral infections could not only stimulate host genes transcription, but also induce HERV activity in human cells.
-
In our previous study, we found a correlation between viral infection-induced DEHERVs and DEGs and proposed the concept of DEHERV-G pair to reveal their potential interactions (Wang et al. 2020). In this study, we detected DEHERV-G pairs in each dataset. After adjusting for redundancy, only 4299 unique pairs were left out of the 6049 DEHERV-G pairs, indicating that the results of different datasets were partially overlapped. As shown in Fig. 2A, the datasets showing the highest number of DEHERV-G pairs were (in descending order) the Flu-A, DENV-2, Flu-B, MV_MSC(5H) (5H-mesenchymal stem cells), ZIKV_F, and EBV_diff-NOKs (differentiated normal oral keratinocytes (NOKs) cells) datasets, with 2706, 830, 823, 449, 291, and 176 pairs, respectively. Other datasets had relatively lower number of DEHERV-G pairs, for example, only four pairs were detected in both A549 and NHBE cells infected with SARS-CoV-2.
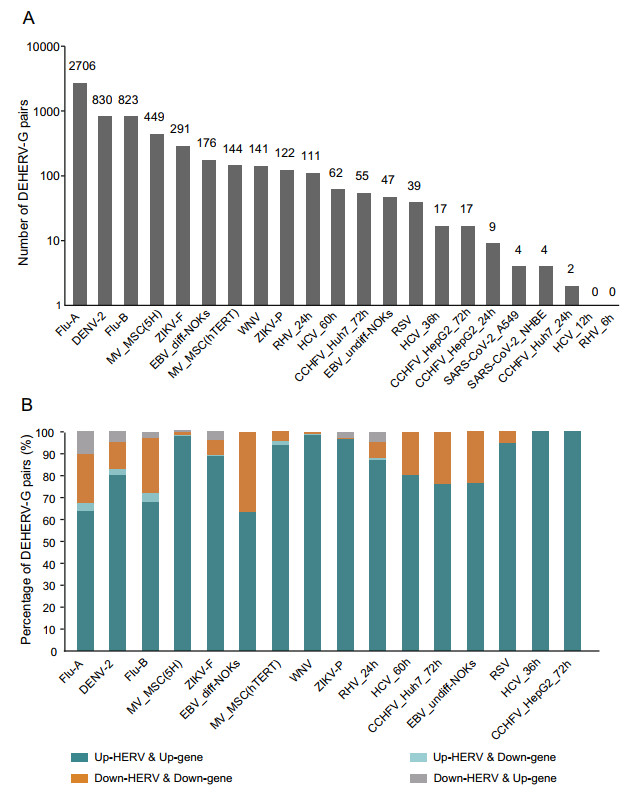
Figure 2. Identification of DEHERV-G pairs in each dataset. A Number of DEHERV-G pair. B Proportion of DEHERV-G pairs in four expression patterns. Only datasets with more than 10 DEHERV-G pairs are shown.
DEHERVs and DEGs, as components of DEHERV-G pairs, were divided into those showing up-regulated and down-regulated expression; therefore, there are four modes of DEHERV-G pair expression altogether. To avoid data bias, only the datasets with more than 10 pairs of DEHERV-Gs were subsequently analyzed (Fig. 2B). Interestingly, more than 90% of DEHERV-G pairs in all datasets had a consistent expression pattern, that is, both the expressions of their components were all up-regulated or down-regulated; up-regulation of HERVs and genes was mainly dominant.
-
To explore the potential key HERV loci closely related to exogenous viral infections, we compared the DEHERV-G pairs detected in all datasets to screen for common DEHERV-G pairs in multiple datasets. Considering that the results of EBV datasets were very different from those of other datasets and that groups with a low number of elements would introduce bias into the intersection analysis, we analyzed DEHERV-G pairs that are common in DENV-2, Flu-A, Flu-B, ZIKV, WNV, and MV datasets (Fig. 3A). As listed in Supplementary Table S2, a total of 43 common DEHERV-G pairs were identified, which consisted of 43 HERVs and 28 human genes, and their structure is illustrated in Supplementary Fig. S3. Notably, all of their components were significantly up regulated. In term of distribution, these DEHERV-G pairs were not randomly distributed but were concentrated on certain autosomes, such as chr1, chr4, chr12, and chr22 (Fig. 3B). Furthermore, we analyzed the distance of HERV relative to its paired human gene (Fig. 3C). We found that almost all of the common 43 HERVs were located closely to their paired genes. About half of them were located in the intron region of neighboring gene, while only 2% of them were more than 5 kb away from the neighboring gene.
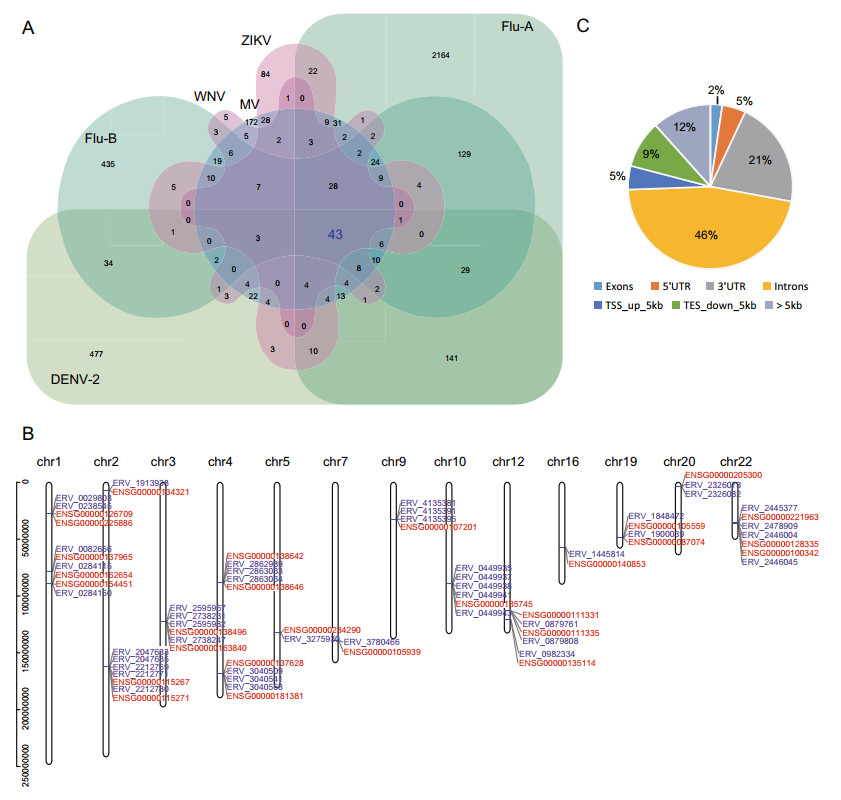
Figure 3. Screening for key DEHERV-G pairs associated with viral infection. A Veen diagram of key DEHERV-G pair enriched in six datasets. The pairs constituting the intersection of all datasets are considered to be the key DEHERV-G pairs. B Distribution of the components of the 43 key DEHERV-G pairs on chromosomes. The red letter represents human gene, and the blue letter represents HERV site. C Location of DEHERV loci relative to human genes. UTR: untranslated region; TSS: transcription start site; TES: transcription end site.
In addition, we analyzed the 43 common DEHERV-G pairs in all datasets (Supplementary Fig. S4). We found that, except for the EBV and HCV groups that did not contain these pairs, all other groups contained all or some of the 43 pairs. Moreover, the longer the time after infection, the greater the number of DEHERV-G pairs identified in the cells, which was consistent with previous results on the overall DEHERVs.
-
Firstly, we analyzed the features of sequence type and classification of the 43 HERVs. As shown in Fig. 4A and Supplementary Table S2, 72% of the DEHERV loci were solo-LTRs (L: 31/43), 12% contained only internal sequences (I: 5/43), and the remaining loci contained single-terminal or double-terminal LTR sequences and internal gene sequences (LI: 4/43; LIL: 3/43). According to the method reported by Kojima (Kojima 2018), the common HERVs were mainly classified into the superfamily of ERV3 and ERV1, which accounted for about 63% (27/43) and 30% (13/43) of the HERVs, respectively. Among them, 18 loci belonged to the MaLR group of the ERV3 superfamily.

Figure 4. Characteristics of the components of 43 key DEHERV-G pairs. A Count of HERVs in different categories. The height of the columns represents the number of HERVs. B PPI network of human genes. The circle represents protein-coding gene, in which the red filled represents interferon induced genes, and the triangle represents lncRNA. C GO enrichment analysis of human genes. D KEGG enrichment analysis of human genes. E Distribution of the key DEHERV-G pairs in interform-beta or ploy(I: C)-stimulated cells.
As another component, the human genes in the key DEHERV-G pairs included 3 long non-coding RNAs (lncRNAs) and 25 protein-coding genes (Fig. 4B, Supplementary Table S2). Literature review showed that 24 of the protein-coding genes were ISGs, and the expression of the remaining one gene, phosphatase 1 regulatory subunit 15A (PPP1R15A) gene, was reported to directly contribute to the stochasticity of interferon-beta (IFN-β) synthesis (Dalet et al. 2017). Additionally, expression of AL445490.1, which is called lncRNA-IFI6, was induced by IFN and could inhibit the expression of neighboring interferon alpha inducible protein 6 (IFI6) (Liu et al. 2019). STRING analysis showed that 20 of these genes were highly correlated with each other (Fig. 4B, Supplementary Table S3).
Finally, we performed functional and pathway enrichment analysis on the human genes of the 43 DEHERV-G pairs. GO enrichment analysis showed that they were mainly enriched in biological processes related to the innate immune response to viral infections, such as response to virus, type Ⅰ interferon signaling pathway, and negative regulation of viral genome replication (adjusted P < 0.05) (Fig. 4C, Supplementary Table S4). In addition, KEGG pathway enrichment analysis showed that these genes were significantly enriched in a variety of signaling pathways related to viral infections, including Flu-A virus, HCV, MV, herpes simplex virus type 1, EBV, and hepatitis B virus (adjusted P < 0.05) (Fig. 4D, Supplementary Table S4). Furthermore, we taken corresponding analysis of transcriptomic data of IFN and ploy(I: C)-stimulated human-derived cells (accession numbers: PRJNA633674, PRJNA510831). Of all 43 key DEHERV-G pairs, 32 and 36 were found to be detected in IFN-β and ploy(I: C)-stimulated cells, respectively. Taken together, these results suggest that some HERVs are indeed closely associated with host immune response induced by viral infection and may have been integrated into the antiviral regulatory network underlying the IFN response.
RNA-Seq Datasets
Identification of DE Human Genes and HERVs
Identification of DEHERV-G Pairs in Each Dataset
Screening of Key DEHERV-G Pairs
Characteristics of the Components of Key DEHERV-G Pairs
-
HERVs account for a significant proportion of the human genome, far outnumbering all known protein-coding genes; therefore, their activation has considerable potential to influence physiological or pathological processes. Prior analysis of human cells by PCR or microarray methods had also indicated that transcription of different HERVs increases upon infection (Hsiao et al. 2009; Serafino et al. 2009; Liu et al. 2017). Considering the poor conservation and complex structure of HERVs, traditional methods cannot elucidate the expression profile of HERV loci in the whole genome, which is not conducive to the comparison of the similarities and differences between HERVs in different studies and to the exploration of the role of their activation in antiviral response. However, previous high-throughput sequencing studies on physiological innate immune responses of the host predominantly highlighted the responsiveness of gene transcription but lacked the widespread expression of HERVs. Therefore, in this study, we decided to fully use the published RNA-seq data on virus-infected cells to assess the modulation of species HERV transcription in innate immune.
In a previous study, we reported the transcription profile of HERVs in DENV-2 infected A549 cells using high-throughput sequencing for the first time and found the correlation between activated HERV sites and human genes (Wang et al. 2020). In this study, using the same pipeline, we reanalyzed the RNA-sequencing data associated with 11 viral infections, including those of Flu-A, Flu-B, ZIKV, HCV, CCHFV, RSV, SARS-CoV-2, WNV, RHV, MV, and EBV. We found that most expressed HERVs appeared to be up regulated in human cells upon infection, which is in line with that of human genes. Moreover, our PCA analysis showed that the expressed HERVs of EBV groups were far away from those of other viruses, suggesting that HERVs driven by DNA or RNA viral infection may be different. However, owing to the relative dearth of published RNA-seq data on DNA virus infection in human cells, follow-up experiments are needed to reveal the differences in HERV activation between DNA virus and RNA virus infection further.
Importantly, we observed overlaps between HERV activation induced by multiple viral infections and finally identified 43 key HERVs. Most of them were members of the older superfamily of ERV1 and ERV3, while only one HERV belonged to the younger ERV2 superfamily. Interestingly, these HERVs were mainly distributed near ISGs, and they were significantly up-regulated in all six different virus-infected cells. In fact, it has been reported that the MER41 elements, a subset of mouse ERVs, contributed to IRF1 (interferon regulatory factor 1) and STAT (signal transducer and activator of transcription 1) binding sites to affect the expression of adjacent IFN-induced genes, such as absent in melanoma 2 (AIM2), apolipoprotein L1 (APOL1), IFI6, and secreted and transmembrane 1 (SECTM1) (Chuong et al. 2016). Consistent with the report, we also detected that ERV_2446004 and ERV_2446045 were neighbored by APOL1, while ERV_0238545 was neighbored by IFI6; these ERVs were among the 43 pairs that were closely related to viral infections. Additionally, we identified three lncRNAs in the common DEHERV-G pairs: AL356414.1, AL445490.1, and AC116366.1. Indeed, AL445490.1, which is the antisense sequence of IFI6, has been described to regulate the expression of neighboring genes to affect HCV replication (Liu et al. 2019; Unfried and Fortes 2020). In addition, AL356414.1 was reported to be a prognosis-related lncRNA of laryngeal squamous cell carcinoma (Cui et al. 2019), while AC116366.1 could reflect the immune infiltrating status of breast cancer (Li et al. 2020), and they were found to be associated with viral infection in this study. Collectively, these results suggest that some particular old HERVs may play a role in the induction of innate immune response as well as in the evolution of host interferon regulatory network. We predicted that activated HERVs may act as enhancer elements to directly affect the expression of adjacent ISGs and may regulate the expression of nearby lncRNAs to affect the antiviral immune response network, although the mechanisms require further exploration.
Moreover, we observed differences in the activation of HERVs under different infection conditions, such as time after infection and cell type, as in the case of modulation of host genes (Eichelberg et al. 2019). Among them, the viral strains (e.g., two ZIKV strains) affected the induction of HERVs activation. Consistent with this finding, the inflammatory response against ZIKV_P was weaker than that against ZIKV_F (Lima et al. 2019); we found the number of DEHERVs that were activated by ZIKV_F infection was small, and almost all of them were included in the results of FSS13025 strain, with lower expression levels than the latter. In addition, based on the different distribution of key HERV-G pairs, i.e., 35 pairs in the ZKV-P group and 43 pairs in the ZIKV_F group, we speculated that the difference in the activation of HERVs induced by different strains may contribute to the difference in immune response. Further research is needed to verify this hypothesis. Considering that the datasets used in this study were collected from different experiments and that different operations may introduce some deviations, some of our findings require further molecular experimental verification, such as maintenance of uniform infection conditions to compare the impact of multiple viral infections.
In summary, we reanalyzed the expression profiles of HERVs and human genes in 11 virus-infected RNA-seq datasets. We found that exogenous viral infections can generally induce HERV expression, while the transcriptional activation of HERV showed similarities and differences between different datasets. In addition, we found 43 HERVs that were commonly expressed by several viral infections were closely related to ISGs. Further studies are needed to determine the molecular mechanism by which these HERVs are involved in the elicitation of innate immune response.
-
This work was supported by the China Ministry of Science and Technology Key Research & Development Program (No. 2016YFC1200800), the National Natural Science Foundation of China (No. 91631110), and the National Mega Project on Major Infectious Disease Prevention (No. 2017ZX10103005-005). We thank the Core Facility and Technical Support at Wuhan Institute of Virology for assistance with technology and platform.
-
DL conceived and designed the experiments. MW, LW, and HL performed the experiments and analyzed the data. MW drafted the manuscript. DL and JC finalized the manuscript. All authors read and approved the contents of the manuscript.
-
The authors declare that they have no conflict of interest.
-
This article does not contain any studies with human or animal subjects performed by any of the authors.
-
This article is licensed under a Creative Commons Attribution 4.0 International License, which permits use, sharing, adaptation, distribution and reproduction in any medium or format, as long as you give appropriate credit to the original author(s) and the source, provide a link to the Creative Commons licence, and indicate if changes were made. The images or other third party material in this article are included in the article's Creative Commons licence, unless indicated otherwise in a credit line to the material. If material is not included in the article's Creative Commons licence and your intended use is not permitted by statutory regulation or exceeds the permitted use, you will need to obtain permission directly from the copyright holder. To view a copy of this licence, visit http://creativecommons.org/licenses/by/4.0/.

 DownLoad: