


-
The diversity of Human Immunodeficiency Virus Type 1 (HIV-1) results from quick, high level viral replication [15] and the misincorporation of host RNA polymerase Ⅱ and viral reverse transcriptase [13, 16, 19]. Some mutations might have no effect on the fitness of HIV-1, but would accumulate during viral replication. Before the patients accepted high active antiretroviral therapy (HAART), some important drug resistance mutations might have existed with very low frequency in drug naÏve patients and variants with these mutations would become drug resistance strains [5].
Protease plays an important role during HIV-1 replication because it cleaves the long protein chains into small pieces for replacement into new virions as new virus particles begin budding off the cell membrane [3, 18]. Most primary PIs resistance mutations appeared to alter the structure of the substrate binding activity of protease by decreasing the PIs' binding ability but still allowing the natural substrate process [3, 10, 18].
Currently, the Chinese government freely provides drugs for HIV/AIDS treatment, including Lamivudine (3TC), Stavudine (D4T), Didanosine (ddI), Zidovudine (AZT), Efavirenz (EFV), Nevirapine (NVP) and Indinavir (IDV). First line drugs are D4T or AZT, ddI and NVP. IDV is used as an alternative drug, but with the increased resistance to first line drugs, IDV will be used more widely in China in the near future.
The generalized genotype drug resistance tests consist of obtaining bulk RT-PCR (reverse trans-cription-polymerase chain reaction) products from multiple viral molecules, sequencing, identification of mutations by submitting the sequences to the HIV-1 drug resistance database and interpretation of drug resistance mutations [9]. Although these methods provide a mixture of viral quasispecies sequences (consensus sequences), they only detect the major variant in viral population and cannot provide the proportion of the variants in vivo. Palmer and colleagues developed a new drug resistance analysis method based on serial dilution, single-genome amplification and sequencing (SGA/S) [14]. SGA/S reduced the quasispecies sequences to single molecules by more detailed approach and 20 to 40 single genome sequences could represent the quasispecies in each sample. Jesus and colleagues analyzed the changes of env gene during HIV-1 transmission by SGA [22]. In this paper we report the evolution of IDV resistance, and a rare mutation pattern M46I/ G73S/L90M revealed by SGA.
HTML
-
Plasma samples were obtained from one male patient with 6 serial times (XLF1 to XLF6). The patient (XLF) had good adherence, and had given written informed consents. The patient had accepted regimen 1 (AZT, ddI, and NVP) from January 2004 to October 2007, regimen 2 (D4T, 3TC, and NVP) from November 2007 to September 2008, and regimen 3 (D4T, 3TC, and IDV) from September 2008 to July 2009. The sample collection time were July 11th 2008, October 15th 2008, November 27th 2008, December 22nd 2008, February 26th 2009, and May 7th 2009 respectively (Fig. 1). At each time point, the information about the patient's health was collected through face to face interview, and 10mL EDTA anticoagulant venous blood was collected. The CD4+ T cells counts and viral load (VL) were tested, and the plasma samples were separated from venous blood.
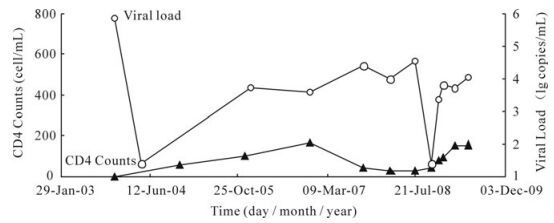
Figure 1. CD4 counts and plasma HIV-1 RNA levels (Viral Load, VL) of patient. The patient had accepted regimen 1 (AZT, ddI, and NVP) from January 2004 to October 2007, regimen 2 (D4T, 3TC, and NVP) from November 2007 to September 2008, and regimen 3 (D4T, 3TC, and IDV) from September 2008 to July 2009. The sample collection times were July 11th 2008, October 15th 2008, November 27th 2008, December 22nd 2008, February 26th 2009, and May 7th 2009 respectively (the last six time points in this figure). Abbreviations: Lamivudine (3TC), Stavudine (D4T), Didanosine (ddI), Zidovudine (AZT), Nevirapine (NVP) and Indinavir (IDV).
-
Viral RNA was extracted from 200μL plasma using a High Pure RNA Kit (Roche) according to the manufacture's protocol, and then viral RNA was stored at -80.0℃.
SGA means the template of polymerase chain reaction (PCR) comes from single copy template. By serial dilution of the complement DNA (cDNA) as template and setting up multiple PCR reactions, the product has a high probability of having been amplified from a single genome copy. In this case, according to Poisson's distribution [11, 12], no more than 30% of the products should be positive to ensure 6 of 7 amplified DNAs come from a single copy template [1, 24, 25]. The reverse transcription of viral RNA was performed using by the Superscript Ⅲ reverse transcriptase (SS Ⅲ RT, Invitrogen), which is an RNase H negative enzyme that protects the RNA template from destruction during the process. Its annealing temperature was high enough (50-55℃) to melt the RNA secondary structure. The viral cDNA was then serially diluted to obtain a single copy by means of a two-step "nested" PCR procedure. Due to variations in sample integrity, stability (such as problems caused by freeze/thaw cycles), and serum components, etc., it is necessary to repeat the PCR reactions at a lower or higher dilutions to achieve the desired results. To confirm single-genome amplification, the entire protease and reverse transcriptase genes were sequenced and the traces were checked to ensure they did not contain any double peaks.
An appropriate volume of primer DO2-1 (reverse, 5'-CTGTCCCTGTAATAAACCCGAAA-3', final 0.25μmol/L) and dNTP Mix (final 0.5mmol/L each) were added into 30μL RNA template, then distilled-sterilized water was added to bring final volume to 39μL. The mixture was incubated at 65℃ for 5 min, and then removed to ice for 1 min (or incubated at 0℃ for 1 min on a PCR cycler). Then 12μL 5× First strand Buffer (Invitrogen), 3μL RNAse OUT (Invitrogen, final 2U/μL) and 3μL SS Ⅲ RT (Invitrogen, final 10U/μL) were added into reaction mixture and mixed. The mixture was incubated at 50℃ for 1 hour, and then the temperature increased to 55℃ for 1 h followed by incubation at 70℃ for 15 min to inactivate the SS Ⅲ RT. Following the completion of the reverse transcription step, 3μL RNase H (Invitrogen, 3U) was added into the mixture for 20 min to remove the RNA template.
To obtain PCR products derived from single cDNA molecules, the resulting cDNA was serially diluted by sterilized-distilled water. Then nested-PCR was performed for each cDNA dilution as follows: First round reaction: 3μL 10 × High Platinum Buffer (Invitrogen), appropriate volume of MgCl2 (Invitrogen, final 2mmol/L), dNTP Mix (final, 0.2mmol/L each), primer MAW-26 (sense, 5'-TGGAAATGTGGAAA GGAAGGAC-3', final 0.4μmol/L) and DO2-1 (final 0.4μmol/L), High Fidelity Platinum Taq (Invitrogen, 0.02 U/μL) and 2μL cDNA template was added to each PCR reaction. Then the reaction mixture was adjusted to 30μL by adding distilled sterilized water. The PCR tubes were placed in a thermal cycler and run with following parameters: 94℃, 2min; 94℃, 30s, 55℃, 30s, 68℃, 3min, 3cycles; 94℃, 30s, 55℃, 30s, 68℃, 2.5min, 32cycles; 68℃, 10min; 4℃, hold. Second round reaction: 3μL 10 × High Platinum Buffer, appropriate volume of MgCl2 (final, 2mmol/L), dNTP Mix (final, 0.2mmol/L each), primer PRO-1 (sense, 5'-CAGAGCCAACAGCCCCACCA-3', final 0.4μmol/L) and RTO-2 (antisense, 5'-TAAAATCAC TAGCCATTGCTCTCC-3', final 0.4μmol/L), High Fidelity Platinum Taq (0.02 U/μL) and 2.0μL cDNA template were added to each PCR reaction. Then the reaction mixture was adjusted to 30μL by adding distilled sterilized water. The PCR tubes were placed in a thermal cycler and run with following parameters: 94℃, 2min; 94℃, 30s, 55℃, 30s, 68℃, 2.5min, 35cycles; 68℃, 10min; 4℃, hold. The products were detected by agarose gel electrophoresis.
-
The maximum dilution with PCR positive ratio less than 30% was taken as the proper dilution for further study. The best dilution might be floated at this dilution. Generally, 20 to 40 single genome sequences were enough to represent one sample, and the number of sequences was diminished accordingly when the viral load (VL) was less than the lowest detection limit (LDL) or when the volume of plasma samples was small.
-
All PCR products derived from cDNA dilutions yielding less than 30% PCR positivity were sequenced at Invitrogen (Shanghai, China). The entire viral protease and reverse transcriptase genes were sequenced using BigDye terminator chemistry and protocols recommended by the manufacturer (Applied Biosystems; Foster City, CA). Both strands of DNA were sequenced, with the sequencing primers SEQ_F1 (sense, 5'-CAGAGCCAACAGCCCCACCA-3'), SE Q_R3 (antisense, 5'-CTTCTGTATATCATTGACAG TCCAGCT-3'), SEQ_F4 (sense, 5'-CCTAGTATAA ACAATGAGACAC-3'), SEQ_R6 (antisense, 5'-TAA AATCACTAGCCATTGCTCTCC-3') and SEQ_F7 (sense, 5'-CTTTGGATGGGTTATGAACT-3'). All chro-matograms were carefully inspected for sites of mixture mutations (double peaks), and those that contained one or more mixed bases were excluded from further study. All sequences were spliced by the ContigExpress program (Invitrogen, Cat. 12605-062).
-
All genes of protease and reverse transcriptase were aligned by CLUSTAL W using Kimura's correction. The genome sequences were submitted to the Stanford HIV Drug Resistance Database (SHDB), and analyzed for drug resistance mutations.
-
Counts of CD4+ T cell were performed by BD FACSCalibur flow cytometers (Cat. 343020) with the reagents BD Multiltes (Cat. 340499). Viral load of samples was detected by Nuclisens® EasyQ Analyzer (Biomerieux, France).
Specimens
RNA extraction and single-genome amplification
Enlargement of PCR at proper dilution of cDNA
DNA sequencing
Drug resistance analysis and sequences submitting
CD4 counts and Viral load Tests
-
The treatment regimens, viral load and CD4+ T cell counts were shown in Fig. 1. The results of viral load indicated that the therapy at the beginning was effective, but the occurrence of IDV resistance variants resulted in viral rebound at XLF3. The numbers of protease genes obtained from each time point were 33, 11, 15, 28, 10, and 52 respectively. The numbers of reverse transcriptase genes obtained from each time point were 46, 16, 16, 29, 10, and 54 respectively. All the sequences were submitted to GenBank and the accession numbers range from GU328709 to GU328846 and GU345711 to GU345744.
-
Before the IDV treatment (XLF1), there were no PI-resistance mutations. But there were some represented polymorphisms, such as A71V, and unrepresented polymorphisms in the protease gene, such as N37D, I62V, L63P, H69Y, I72E, V77I, and I93L (Fig. 2). At XLF2, NVP was discontinued, and replaced by IDV. The proportion of A71V declined from 93.9% to 72.7%, and the proportion of wild type variants rose from 6.1% to 27.3%. Other unre-presentative mutations changed as well as A71V.
The PI-resistance mutations G73S, M46I and L90M appeared after 3 months (at XLF3). The proportion of variants with the G73S mutation was 93.3% and higher than the other two mutations (Fig. 3). G73S appeared as two patterns. First, G73S occurred alone (Fig. 4), and it was sensitive to IDV. Secondly, it occurred together with mutations M46I, L90M to form the G73S/M46I/L90M pattern. This pattern caused intermediate resistance to IDV. However variants with the G73S/M46I/L90M pattern were only present in 13.3% of the viral population.
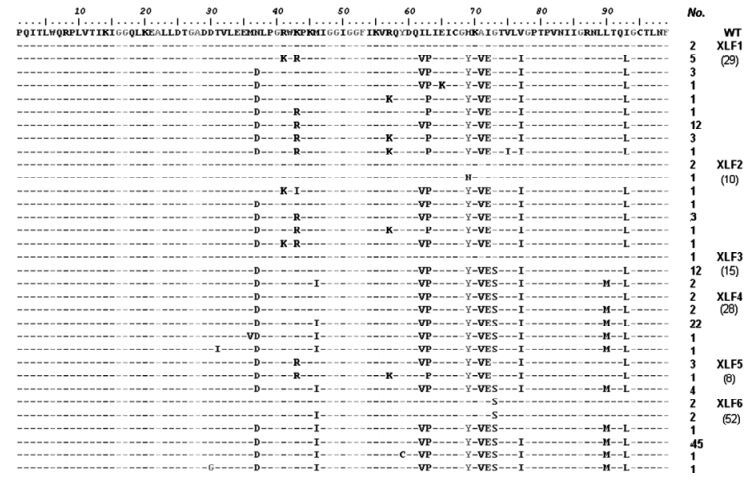
Figure 2. Detailed information of mutations in protease quasispecies sequences. The WT sequence was obtained from SHDB and the sequences of XLF were obtained from six serial time points. Some sequences which did not contain entire protease sequence were excluded from this figure.
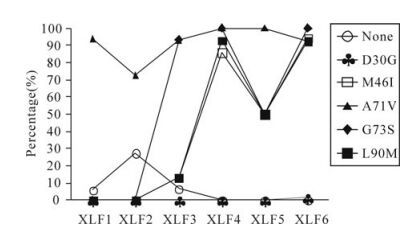
Figure 3. The changes of PI-resistance mutations in this patient. Each line with different shape represents different PI-resistance mutations.
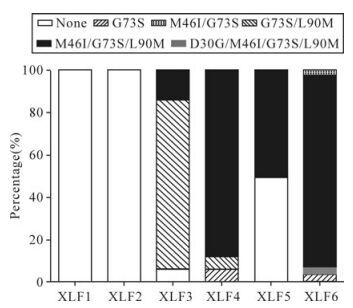
Figure 4. The evolution of PI-resistance patterns in this patient. Each block with different shading represents one mutation pattern for IDV. The x-axis represents these serial samples collected from each time point in this follow-up study. The y-axis represents the percentage of variants with each mutation pattern in the viral populations.
At the next time point (XLF4), the proportion of variants with G73S/M46I/L90M pattern rose from 13.3% to 85.7%. And variants with G73S alone declined from 80.0% to 7.14%. Half a year later (XLF5), there was only one drug resistance pattern, G73S/M46I/L90M. The G73S variants declined and were less than 10%. At the last time point (XLF6), IDV-resistance mutation patterns included G73S, G73S/M46I, D30G/G73S/M46I/L90M and G73S/ M46I/L90M. The former three patterns were rare and the proportions were 3.85%, 3.85%, 1.92% respectively. The latter was 90.4%.
Before the patient accepted IDV, the viral population did not have any drug resistance mutations for IDV, but had one representative polymorphism (A71V) in the protease gene. In untreated patients, A71V is a polymorphism, but will be turned to a non-polymorphism with multiple-resistance mutations. After receiving IDV, the percentage of variants with A71V declined, and the variants with transitional drug resistance mutation G73S became the dominant variants (Fig. 3). At the same time, the mutation pattern G73S/M46I/L90M occurred (ratio was 13.3%). Along with the therapy, G73S turned to G73S/M46I/ L90M, and variants with this pattern became the dominant variants. When the dominant resistance variants had been established, some new drug resistance mutations like D30G in protease occurred based on the G73S/M46I/L90M mutation pattern (Fig. 4).
-
Because SGA can obtain quasispecies sequences, it could be used for the linkage analysis of special drug resistance mutations, whereas the general genotype drug resistance assay could not [14]. Four protease inhibitor (PI) resistance mutations (major resistance mutations: M46I, L90M. minor resistance mutations: A71V, G73S) in 6 serial samples of XLF had been found. A71V occurred prior to the patient receiving IDV. At XLF3, G73S emerged and was presented as two patterns, A71V/G73S (80.0%) and A71V/M46I/ G73S/L90M (13.3%). M46I/L90M also appeared at XLF3, and all of M46I/L90M appeared with A71V/ G73S (Table 1). When the regimen 3 was sustained for 4 months, variants with the A71V/M46I/G73S/ L90M pattern became the major population with a proportion higher than 90.0%. Because A71V was a polymorphism and occurred with multiple PI-resistance mutations in this case, it was not included in this mutation pattern. The rare mutation pattern was defined as G73S/M46I/ L90M.

Table 1. G73S, M46I and L90M Linkaged in protease in 9 sequences of XLF5
-
During the occurrence and development of IDV resistance, the variants with RTIs resistance mutations in reverse transcriptase maintained a high proportion.
Because this patient had received nucleotide reverse transcriptase inhibitors (NRTIs) (AZT, ddI, 3TC, D4T) when changing from regimen 2 to regimen 3 (Fig. 1), the frequency of TAMs (Thymidine Analog Mutations) (M41L, D67N, K70R, L210W, T215Y, K219Q) was very high (more than 80.0%, Table 2). TAMs were very stable, and always maintained a high proportion. The proportion of TAMs at each time point were 91.3%, 81.3%, 93.8%, 96.6%, 80.0%, 92.6% respectively. M184I causes high-level resistance to 3TC and low-level resistance to ddI. M184I increases the susceptibility to AZT and d4T. M184I was very stable and was maintained as a high proportion (higher than 80.0%) at all 6 time points. N348I was a newly defined drug resistance mutation that occurred at a reverse transcriptase connection domain, and would cause low-level resistance to AZT and NVP [26]. N348I was also stable, and the proportion at each time point were 91.3%, 81.3%, 87.5%, 100.0%, 80.0%, 90.7%. Combined with TAMs, E44D could cause low-level resistance to 3TC and almost all NRTIs. In this patient, E44D occurred with TAMs all the time and with a high percentage. L74I and V118I would cause low-level resistance to NRTIs when occurring with TAMs.

Table 2. The number (percentage) of NRTI-resistance mutations at each time point
When the therapy regimens changed from 2 to 3, NVP was discontinued. Mutation K101E in the reverse transcriptase could cause intermediate resistance to NVP and G190A could cause high-level resistance to NVP. The frequencies of these two mutations was very high, more than 80% at each time points. The percentage at each time point was 95.7%, 81.3%, 93.8%, 93.1%, 80.0%, and 92.6% respectively for the K101E mutation, and 93.5%, 81.3%, 93.8%, 100.0%, 80. 0%, and 92.6% for the G190A mutation. V179M was an unusual mutation and had a high percentage (higher than 80% at each time point). In this case, V179M occurred with K101E and G190A. M230I was also an unusual mutation (Table 3).
At the first four time points of this study, the PI-resistance mutations increased quickly, from 0.0% to 85.8%. But RTI-resistance mutations were always present in high proportions (more than 80.0%, Table 2 and 3). From XLF3 to XLF6, the PI-resistance mutations generally maintained a high percentage as well as RTI-resistance mutations (more than 80.0%, Fig. 2).

Table 3. The number (percentage) of NNRTI-resistance mutations at each time point
-
Some mutations, which were present less than 20% of the time but which could cause drug resistance during HAART, were described as low-level drug resistance mutations. The detection of low-level drug resistance mutations is very important for understanding the evolution of drug resistance. Drug resistance is not an all-or-no phenomenon and low-level drug resistance could increase and become a major population under the drug selection pressures and so drug resistance phenomenon should be described as minor or major, low-level or high-level. At XLF3, mutations M46I and L90M occurred, but the ratio was very low (13.3%, Table 4). The information about these two PIs mutations would be missed by a general genotypic drug resistance assay [23]. As treatment was prolonged, variants with these two mutations became the major population and caused resistance to IDV. So the detection of these two mutations provided detailed, precise information for the evolution of IDV resistance.

Table 4. Detection of low-level resistance mutation
-
Some polymorphism in protease declined while the resistance mutations increased. Percentages of K43R, R41K and R57K decreased as the treatment continued (Table 5). K43R rebounded at XLF5. N37D, I62V, L63P, H69Y, I72E and V77I always maintained high proportions in the viral population. T31I, M36V, K43I, Y59C and E65K occurred only once in viral population during therapy. There were two interesting phenomenon (Fig. 2). K43R occurred when G73S disappeared. When G73S occurred and became dominant variants, K43R disappeared and only appeared when G73S was absent. R57K and I62 V had a negative correlation similar to as K43R and G73S.

Table 5. Proportions of polymorphism in protease gene.
Evolution of IDV-resistance mutations
Linkage analysis of IDV-resistance mutation pattern
The changes of reverse transcriptase inhibitors (RTIs) resistance mutations
The low-level mutations
Changes of polymorphism during the evolution of drug resistance
-
Before the establishment of SGA, the general methods to analyze HIV-1 quasispecies from bulk RT-PCR products consisted of multiple or near-endpoint dilution PCR from proviral DNA or plasma viral RNA, cloning, sequencing and linkage analysis of mutations. The other drug resistance test assay, Heteroduplex tracking assay (HTA), could analyze special mutations and acute infection [8]. Although these methods provide some information about the drug resistance population of HIV-1, they had significant limitations. HTA only provides a fraction of the gene of interest, not the entire sequence, and it gives a qualitative description about the drug resistance. The cloning and sequencing from bulk or near-endpoint dilution PCR lacked Taq polymerase-mediated template switching. This switching can result in recombination and introduce Taq polymerase errors into clones, and the process of cloning and sequencing might introduce bias of clone and amplification. Keele et al. suggested the end-point dilution cDNA (SGA) could diminish the PCR-mediated recombination and had good proportional representation. [20].
Depending on the products from single-genome template, SGA has the following advantages. First, most of the misincorporation introduced by PCR could be avoided, and the misincorporation in SGA mostly was introduced during reverse transcription. Second, recombination based on PCR should not appear, but it was more likely occurring using multiple cDNA as template. Third, the problem of resampling is impossible during SGA, because the template of it is a single genome, but the resampling problem exists in bulk PCR[14].
The drugs currently used to treat HIV infection include five distinct classes: nucleoside and nucleotide analogues (NRTIs); nonnucleoside reverse-trans-criptase inhibitors (NNRTIs); protease inhibitors (PIs); integrase inhibitor (INs); and entry inhibitors. Each class of drugs has independent mechanism of prevent viral replication, so the drug resistance mechanisms are different within the five classes of antiviral drug. The cross-resistance usually occurred in the same class, and would impact the selection of drugs [4].
PIs had better affinity to binding the protease active site than natural substrates, which results in the inhibition of the cleavage function of protease. Currently, the PIs approved by food and drug administration (FDA) include Amprenavir (APV), Fos-amprenavir (fAPV), Atazanavir (ATV), Indinavir (IDV), Loprinavir/ ritonavir (LPV/r), Nelfinavir (NFV), Ritonavir (RTV), Saquinavir (SQV), Tipranavir (TPV), Darunavir (TMC114, DRV).
Some mutations correlate with the selection of PIs, indicating the PIs' target sites are specific and different among these PIs. However, the mutations in protease are always combined together to confer resistance to PIs and there is an overlap between these mutations. This overlap of mutations is the reason for cross-resistance within PIs. [4].
IDV belongs to protease inhibitor class of drugs, but is not ordinarily used for salvage therapy because of its high toxicity. Many different protease mutations have been reported in patients receiving IDV (like V82A/T/F/S/M, M46I/L, I54V/T/A, I84V, L90M). V32I, I47V, G48V, L76V and N88S; each occurred in a small proportion of patients receiving IDV with virological failure and caused low-level IDV resistance. L24I, F53L, and G73S/C/T/A were selected by IDV and contribute to reduced IDV susceptibility [2, 6, 7, 17]. Condra et al analyzed the viral resistance to IDV in vivo, and found that the occurrence of L10V/R, L24I, M46I, I54V, A71V, V82A, I84V, and L90M were significantly correlated with phenotypic resistance. In 21 samples of 57 patients, only one sample had the M46I/G73S/L90M mutation pattern by genotype analysis, but this sample also had V32I and I47V mutations[6]. Descamps et al analyzed 27 patients from a randomized comparative trial (Novavir ANRS 073) failing an IDV containing regimen, none of these samples contained the M46I/G73S/L90M mutation pattern [7].
Although IDV had been used as an antiretroviral drug for a long time, all the analysis about IDV resistance were performed by the general genotype method, and only gave a consensus sequence about one sample. So the analysis of resistance quasispecies evolution by SGA might reveal the resistance evolution more clearly, and it could give a clearer understanding about the drug resistance mutations, including occurrence, disappearance, increase and decrease in viral population. The enzymes used in our study had high-fidelity, like Superscript Ⅲ reverse transcriptase (Invitrogen) and High-fidelity Platinum DNA polymerase (Invitrogen). Palmer et al. analyzed the properties of SGA and found that the assay error was less than 0.011% [14].
In our study, the amplicons selected for the SGA were approximately 2, 100-bp, flanked by highly conserved primer sites, extending from the p6 region of gag through entire protease and reverse trans-criptase. This region included the sites of all mutations giving rise to PI-resistance as well as RTI-resistance.
Some mutations detected only by SGA were primary mutations that appeared early in the evolution of resistance to a particular inhibitor, and might lead to the failure of subsequent treatment. The results of our study on patient XLF showed that SGA was more sensitive than standard genotype analysis for detection of a broad range of clinically important drug resistance mutations in protease and reverse transcriptase. In the 6 serial plasma samples of XLF, 4 of the plasma samples contained 1 or 2 drug resistance mutations identified by SGA that could not be detected by standard genotype assay (Table 4). At XLF3, percentage of M46I and L90M was less than 20% (13.3%) and would be missed by standard genotype analysis. In the latter three samples, these two mutations, M46I and L90M, increased to a high level to become the dominant variants. So the detection of these two mutations gave us detailed information about the evolution of IDV resistance.
There were complex patterns of major and minor drug resistance mutations detected by standard genotype assay in plasma samples from treatment-experienced patients. Due to the lack of a standard genotype assay, we could not know detailed information about the linkage of drug resistance mutations when more than one dual peak appeared in one consensus sequence. The analysis of multiple single genomes from an individual patient by SGA can reveal patterns of linkage that cannot be discerned in standard genotype analysis. Four of six serial XLF samples analyzed by SGA showed distinct linkage of multiple mutations, and the proportion increase to encompass all of the samples except the former two samples. The third sample (XLF3) contained three linked protease inhibitor mutations in 2 of 15 genomes sequenced. Two of the linked mutations were major PIs resistance mutations (M46I and L90M), and the other one was minor mutations (G73S). The mutation pattern was defined as M46I/G73S/L90M, which have not been reported before through linkage analysis.
In all of these six samples, the proportion of wild variants was 33.56% and most appeared at XLF1 and XLF2. All resistance variants contained the G73S mutation, and also included M46I/G73S, G73S/L90M, M46I/G73S/L90M, D30G/M46I/G73S/L90M with the proportons 16.2%, 2.0%, 2.0%, 78. 8% and 1.0% respectively. From the analysis, we could determine that the variants with M46I/G73S/L90M pattern were the dominant variants (78.8%), and the following were variants with G73S mutation pattern. 96.3% of variants with the M46I mutation were M46I/G73S/ L90M, as well as variants with L90M. Saah et al. made a study of 43 patients treated with IDV, EFV, and Adefovir after failure of Nelfinavir (NFV) therapy by cloning. M46I, G73S, L90M appeared in 4, 4 & 11 samples respectively, and they did not detect any samples with M46I/G73S/L90M mutation pattern alone [21].
The variants with none of these three mutations did not confer resistance to IDV, and the variants with A71V did not confer resistance to IDV either. Variants with A71V and G73S only confer potential low-resistance to Atazanavir/r (ATV/r), Nelfinavir (NFV) and Saquinavir/r (SQV/r). Variants with G73S/ M46I/L90M confered high-level resistance to NFV, intermediate resistance to ATV/r, Fosamprenavir/r (FPV/r), IDV/r and SQV/r (data from SHDB).
Before the receiving IDV, XLF had received RTIs for more than four and a half years. From the analysis of XLF1, the RTI-resistance mutations persisted. During the occurrence of IDV resistance, the RTI-resistance mutations were maintained in high proportional. The occurrence of IDV resistance had no effect on the proportional of variants with RTI-resistance mutations. This confirmed that different classes of drugs had different mechanisms of resistance and one class of drug resistance would not impact the other class of drug resistance. This finding provides evidence for the replacement of drugs when the resistance for one drug of the current regimen occurs.
In conclusion, we developed a new method that could analyze the entire protease and reverse transcriptase sequences, and have high fidelity to confirm the validity of sequences. Before this study, most research about drug resistance only detected the protease and part of reverse transcriptase. By using SGA, the evolution of IDV resistance was analyzed and a rare PIs mutation pattern (M46I/G73S/L90M) was found. Further study is necessary for the necessary verification of this new PI-resistance mutation pattern, such as phenotypic assays. This new method provides a useful approach to analyze the drug resistance to PIs and RTIs, including the domain located at 300 to 560aa of reverse transcriptase.


 DownLoad: