


HTML
-
Since the severe acute respiratory syndrome(SARS)epidemic in 2003(Peiris et al., 2003), there has been a boost in the interest in the identification of novel coronaviruses(CoVs). Human coronavirus NL63(HCoV-NL63) was discovered in the Netherl and s in 2004(Fouchier et al., 2004; van der Hoek et al., 2004) and HCoV-HKU1 was identified from two patients with pneumonia in Hong Kong in 2005(Woo et al., 2005a). Another novel CoV, Middle East Respiratory Syndrome CoV(MERS-CoV), which first emerged in the middle east region in 2012(Assiri et al., 2013), can cause severe respiratory distress in patients with high mortality rate of 40%(Zumla et al., 2015). A recent outbreak of MERS-CoV occurred in health care facilities in South Korea due to a superspreading event(Oh et al., 2015). Thus, the impact of coronaviruses on public health cannot be ignored and continuous surveillance is required to monitor diseases caused by newly emerging coronaviruses and the changes in the epidemiology of known human coronaviruses.
HCoV-229E and HCoV-OC43 were responsible for 5% 30% of human respiratory tract infections(Hu et al., 2014; McIntosh et al., 1970), while HCoV-NL63 was found to be present in 1.2% 9.3% of the respiratory samples in several studies(Arden et al., 2005; Bastien et al., 2005; Chiu et al., 2005; Ebihara et al., 2005; Koetz et al., 2006; Moes et al., 2005; van der Hoek et al., 2006). We have previously reported the prevalence of HCoV-HKU1 among patients with community-acquired pneumonia in Hong Kong during a one-year period and HCoV-HKU1 was detected in the nasopharyngeal aspirates(NPAs)of 10(2.4%)of 418 patients with community-acquired pneumonia(Woo et al., 2005b). Subsequently, we also compared the epidemiology and clinical spectrum of disease of HCoV-HKU1, HCoV-OC43, HCoV-229E and HCoV-NL63 infections in patients hospitalized for acute respiratory illness during a one-year period, which showed that 87(2.1%)of 4181 NPAs were positive for various HCoVs (Lau et al., 2006).
To date, most of the epidemiological studies of HCoV infections have included specimens from children only(Chung et al., 2007; Esposito et al., 2006; Kaplan et al., 2008; Kuypers et al., 2007; Pierangeli et al., 2007; Prill et al., 2012; Theamboonlers et al., 2007; Vabret et al., 2008; van der Hoek et al., 2006; Woo et al., 2009). In addition, longitudinal studies of HCoV epidemiology are lacking(Kuypers et al., 2007; Lau et al., 2006). In the present study, we report a six-year longitudinal epidemiological study of HCoV infections in patients across all ages in Hong Kong.
-
During the 6-year period(September 2008 August 2014), a total of 8275 nasopharyngeal samples from patients with acute respiratory tract infections admitted to two public hospitals(Queen Mary Hospital and Pamela Youde Nethersole Eastern Hospital)in Hong Kong were included in the present study. All nasopharyngeal samples were negative for influenza A and B viruses, parainfluenza virus types 1, 2 and 3, respiratory syncytial virus, adenovirus and metapneumovirus by direct immunofluorescence(van den Hoogen et al., 2001; Woo et al., 1997), and these samples were further tested for human coronaviruses(HCoVs)by reverse transcription -polymerase chain reaction(RT-PCR).
-
Viral RNA was extracted from the nasopharyngeal samples using EZ1 Virus Mini Kit v2.0(QIAgen, Hilden, Germany). The RNA was eluted in 60 μL of AVE buffer and was used as a template for RT-PCR.
-
RT was performed using r and om hexamers and the SuperScript III kit(Invitrogen, San Diego, USA)as described previously(Woo et al., 2005a; Woo et al., 2005b). PCR for HCoVs was performed using a primer set(forward primer: 5'-GGTTGGGACTATCCTAAGTGTGA -3' and reverse primer: 5'-CCATCATCAGATAGAATCATCATA -3')targeting a 440-bp RNA dependent RNA polymerase(RdRp)region of HCoVs(Woo et al., 2005a). The PCR mixture(25 μL)contained cDNA, PCR buffer, 200 μmol/L of each dNTPs and 1.0 U Taq polymerase(Boehringer Mannheim, Germany). The mixtures were amplified in 60 cycles of 94 C for 1 min, 48 C for 1 min and 72 C for 1 min, and a final extension at 72 C for 10 min. The amplified products were detected by agarose gel electrophoresis as described in our previous publication(Woo et al., 2005a). Both str and s of all PCR products were sequenced twice with an Applied Biosystems 3130xl DNA Analyzer(Applied Biosystems, Foster City, USA), using the PCR primers. The sequences of the PCR products were compared with the sequences of the RdRp genes of coronaviruses in the GenBank database.
-
The partial RdRp sequences of HCoV strains from 77 nasopharyngeal samples were used for phylogenetic tree construction, which was performed using maximum likelihood(ML)method in MEGA5 with the best model GTR+G(Tamura et al., 2011), with bootstrap values calculated from 1000 trees.
-
Statistical analysis was confirmed by IBM SPSS statistics software version 23. Comparisons between patients aged > 80 years and those of other age groups infected with HCoV-OC43 were performed using chi-square test. P < 0.05 was regarded as statistically significant.
Patients and microbiological methods
RNA extraction
RT-PCR for coronaviruses and DNA sequencing
Phylogenetic analysis
Statistical method
-
During the 6-year period, 8275 nasopharyngeal samples from patients(male:female = 1.03:1, age(mean SD)= 49 36 years)with acute respiratory tract infections were collected from the 2 public hospitals for the present study. HCoVs were detected in 77(0.93%)nasopharyngeal samples from patients with the median age of 79.5 years(range, 22 days to 95 years). Thirty-seven were males and 40 were females.
-
The partial RdRp genes of 77 HCoV strains detected from the nasopharyngeal samples were amplified and sequenced. The phylogenetic tree was shown in Figure 1. The nucleotide sequences of the 12 HCoV strains showed 99.5% 100% nucleotide identities to HCoV-229E, those of the 6 HCoV strains showed 98.9% 100% nucleotide identities to HCoV-NL63, those of the 48 HCoV strains showed 98.6% 100% nucleotide identities to HCoV-OC43 and those of the 11 HCoV strains showed 97% 100% nucleotide identities to HCoV-HKU1. Accordingly, the most frequently detected HCoV species was HCoV-OC43(48/8275, 0.58%), followed by HCoV-229E(12/8275, 0.15%), HCoV-HKU1(11/8275, 0.13%) and HCoV-NL63(6/8275, 0.07%)by RT-PCR(Table 1).
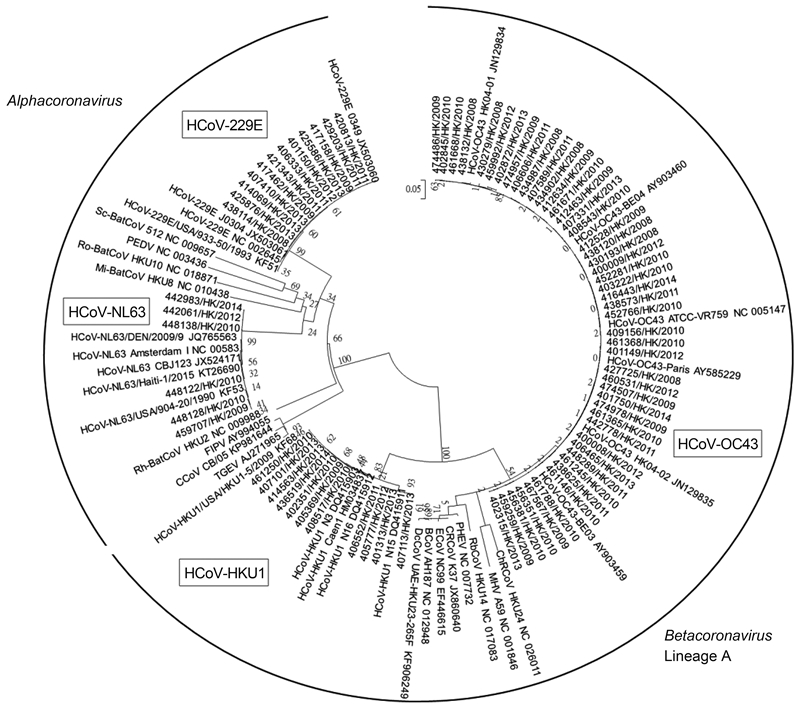
Figure 1. Phylogenetic trees of partial RdRp gene sequences of 77 HCoV strains detected from the nasopharyngeal samples. The tree was inferred from the partial RdRp gene data by ML method, with bootstrap values calculated from 1000 trees. CCoV, canine coronavirus; FIPV, feline infectious peritonitis virus; HCoV-229E, human coronavirus 229E; HCoV-NL63, human coronavirus NL63; Mi-BatCoV HKU8, Miniopterus bat coronavirus HKU8; PEDV, porcine epidemic diarrhea virus; Rh-BatCoV HKU2, Rhinolophus bat coronavirus HKU2; Ro-BatCoV HKU10, Rousettus bat coronavirus HKU10; Sc-BatCoV 512, Scotophilus bat coronavirus 512; TGEV, porcine transmissible gastroenteritis virus; BCoV, bovine coronavirus; ChRCoV HKU24, China Rattus coronavirus HKU24; CRCoV, canine respiratory coronavirus; DcCoV UAE-HKU23, dromedary camel coronavirus UAE-HKU23; ECoV, equine coronavirus; HCoV HKU1, human coronavirus HKU1; HCoV-OC43, human coronavirus OC43; MHV, murine hepatitis virus; PHEV, porcine hemagglutinating encephalomyelitis virus; RCoV, rat coronavirus; RbCoV HKU14, rabbit coronavirus HKU14.
-
Analysis of age distribution among patients positive for HCoVs showed that HCoVs mainly infected the elderly, with the highest detection frequency(36/2380, 1.51%)in those > 80 years and the majority of cases infected by HCoV-OC43(26/36, 72%)(Table 1). HCoVs also commonly infected children, with the detection rate of 0.91%(23/2529) in the age group of 0 10 years and about half of the cases infected by HCoV-OC43(12/23, 52%). Interestingly, the detection rate of HCoV-OC43 in the age group of > 80 years(26/2380, 1.09%)was significantly higher than the rates in the age groups of 0 10 years(12/2529, 0.47%) and 71 80 years(3/1237, 0.24%)(P < 0.05)(Table 2). No significant differences were noted between the detection rate of HCoV-OC43 in the age group of > 80 years and the rates in other age groups from 11 to 70 years(P > 0.05)(Table 2). None of the samples from patients aged between 11 and 30 years were positive for HCoVs. However, an increasing trend in the detection frequency of HCoVs with age was noted among other age groups, from 0.42%(1/238) in the age group of 31 40 years to 0.65%(4/617) in the age group of 61 70 years and 0.57%(7/1237) in patients aged between 71 80 years.
Age group (years) Number of samples No. (%) of positive samples HCoVs HCoV-229E HCoV-NL63 HCoV-OC43 HCoV-HKU1 0–10 2529 23 (0.91) 5 (0.2) 2 (0.08) 12 (0.47) 4 (0.16) 11–20 307 0 (0) 0 (0) 0 (0) 0 (0) 0 (0) 21–30 177 0 (0) 0 (0) 0 (0) 0 (0) 0 (0) 31–40 238 1 (0.42) 0 (0) 0 (0) 1 (0.42) 0 (0) 41–50 323 2 (0.62) 1 (0.31) 0 (0) 1 (0.31) 0 (0) 51–60 465 3 (0.65) 0 (0) 1 (0.22) 2 (0.43) 0 (0) 61–70 617 4 (0.65) 1 (0.16) 0 (0) 2 (0.32) 1 (0.16) 71–80 1237 7 (0.57) 2 (0.16) 1 (0.08) 3 (0.24) 1 (0.08) > 80 2380 36 (1.51) 3 (0.13) 2 (0.08) 26 (1.09) 5 (0.21) Unknown 2 1 - - 1 - Total 8275 77 (0.93) 12 (0.15) 6 (0.07) 48 (0.58) 11 (0.13) Table 1. Age distribution of nasopharyngeal samples positive for human coronaviruses.
Age groups (years) Number of samples No. (%) of samples positive for HCoV-OC43 P value * 0–10 2529 12 (0.47) 0.014 11–20 307 0 (0) 0.066 21–30 177 0 (0) 0.162 31–40 238 1 (0.42) 0.328 41–50 323 1 (0.31) 0.184 51–60 465 2 (0.43) 0.186 61–70 617 2 (0.32) 0.077 71–80 1237 3 (0.24) 0.007 > 80 2380 26 (1.09) - Note: * Using > 80 years old as the reference age group; P < 0.05 was considered to be statistically significant. Table 2. Comparisons between patients aged > 80 years and those of other age groups infected with HCoV-OC43
-
HCoVs were detected over the 6-year study period, with the highest and lowest detection rates of HCoVs noted in the periods of September 2010 August 2011(22/1500, 1.47%) and September 2013 August 2014(4/1200, 0.33%), respectively(Figure 2). HCoVs were most frequently detected in the fall and winter during the 6-year period, but each HCoV species displayed different seasonal patterns(Figure 3). HCoV-OC43 was the most frequently detected species throughout all years, with the highest detection rate in the period of September 2010 August 2011(13/1500, 0.87%). HCoV-OC43 was predominant in the fall and winter. HCoV-HKU1 was also detected throughout all years, with the highest detection rate in the period of September 2012 August 2013(4/1300, 0.31%). HCoV-HKU1 infections mainly occurred in winter. HCoV-229E was detected in alternate years [except in September 2011 August 2012, but with very low detection rate(1/1400, 0.07%)], with the highest detection rate in the period of September 2012 August 2013(4/1300, 0.31%). HCoV-229E infections mainly occurred in winter and spring, with a few cases occurred in summer in 2011. HCoV-NL63 was the least frequently detected HCoV species, with the highest detection rate during September 2010 August 2011(3/1500, 0.2%). HCoV-NL63 was predominant in the summer and fall.
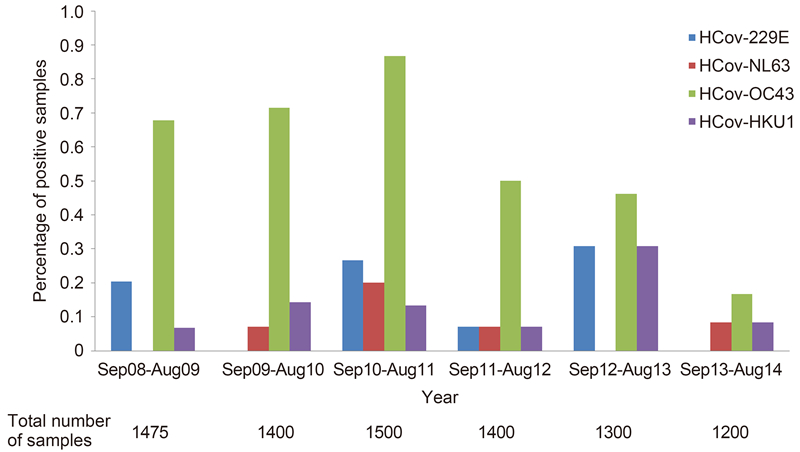
Figure 2. Detection frequency of human coronaviruses identified from the nasopharyngeal samples of patients hospitalized for acute respiratory tract infections during the 6-year period.
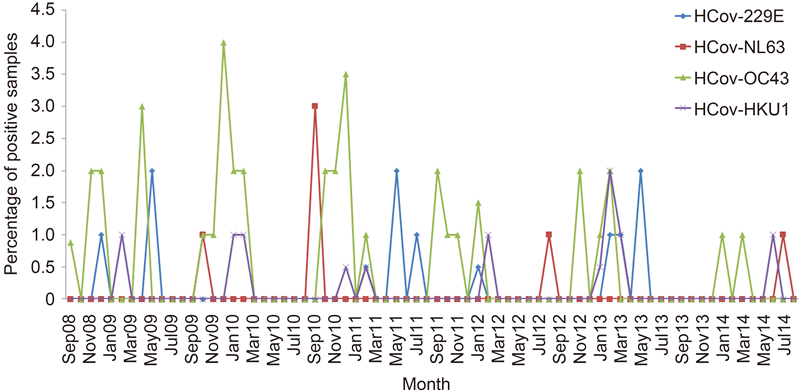
Figure 3. Seasonality of human coronavirus infections in Hong Kong during the study period.
Respiratory virus detection in nasopharyngeal samples
RT-PCR and sequencing of the partial RNA-dependent RNA polymerase(RdRp)genes of human coronaviruses and phylogenetic analysis
Age distribution
Seasonal distribution
-
The present study describes the epidemiology of HCoV infections in Hong Kong over a 6-period. HCoVs are circulating globally and have been detected in 2.1% 18% of respiratory samples in previous studies(Cabeça et al., 2012; Chung et al., 2007; Dare et al., 2007; Esposito et al., 2006; Gaunt et al., 2010; Lau et al., 2006; Mackay et al., 2012; Njouom et al., 2012; Pierangeli et al., 2007; Prill et al. 2012; Regamey et al., 2008; Sloots et al., 2006; Vabret et al, 2008; Woo et al., 2009). In this study, HCoVs were detected in 0.93% of the nasopharyngeal samples from patients with acute respiratory illness in all age groups. The incidence of HCoV infections in this study was apparently lower than those in several other reports(Arden et al., 2005; Bastien et al., 2005; Chiu et al., 2005; Ebihara et al., 2005; Dare et al., 2007; Gaunt et al., 2010; Liu et al., 2014; Moes et al., 2005; Prill et al., 2012), which may be due to different reasons. First, different sampling strategies may have led to different detection rates. HCoVs are well known to predominate in winter and commonly infect infants and children(Woo et al., 2009). Therefore, studies that include infants or young children only and /or during winter months could result in higher incidence of HCoV infections. For example, HCoVs were detected in 20(18%)of 112 infants with acute respiratory infections in Switzerl and (C and ucci et al., 2008; Esposito et al., 2006; Mackay et al., 2012; Regamey et al., 2008; Sloots et al., 2006). In this study, only hospitalized patients who may have more severe infections were included, which may have under-estimated the overall incidence among all respiratory illnesses. Second, various detection methods may show different sensitivities towards virus detection. Nested PCR and real-time PCR have shown to be more sensitive in detecting HCoV-OC43 and 229E when compared to conventional detection assays(Myint et al., 1994; Vijgen et al., 2005). Third, HCoVs may exhibit different geographical variations in incidence. In our previous study, HCoV was responsible for 2.1% of admissions for all acute respiratory tract infections during April 2004 to March 2005(Lau et al., 2006). The apparent lower incidence in the present study may be due to different study periods. Year-to-year variations in the frequency of HCoV infections have been reported(Lai et al., 2007). In this study, the detection frequency of HCoVs varied over different years, with the lowest rate of 0.33% during September 2013 to August 2014, which also reduced the overall detection frequency of HCoVs. Although low prevalence of HCoVs was shown, they can result in severe diseases, such as pneumonia and even death(Patrick et al., 2006; Woo et al., 2005b). The detection of other pathogens in HCoV-positive nasopharyngeal samples is needed to investigate if the co-infections contribute to disease severity in the future. Thus, the impact of HCoVs on public health cannot be neglected. Further study is warranted to examine the seroepidemiology of HCoV infections in our local population.
HCoV-OC43 was the most prevalent among the four HCoV species during the study period, followed by HCoV-229E and HCoV-HKU1 with similar incidence, and HCoV-NL63 of the least importance. Other studies also showed that HCoV-OC43 was the most prevailing HCoV species circulating in China, Thail and, Australia, United Kingdom and the United States (Dare et al., 2007; Gaunt et al., 2010; Lau et al., 2006; Liu et al., 2014; Prill et al., 2012; Sloots et al., 2006), while some studies demonstrated that the prevalence of HCoV-NL63 was similar to or even higher than that of HCoV-OC43 in Korea, the Netherl and s, Cameroon and Brazil(Cabeça et al., 2013; Chung et al., 2007; Dijkman et al., 2012; Njouom et al., 2012). Dijkman et al. hypothesized that HCoV-OC43 and HCoV-NL63 might elicit immune response that protects against subsequent infections caused by HCoV-HKU1 and HCoV-229E, respectively, which may explain why HCoV-OC43 and HCoV-NL63 were the most frequently detected HCoV species(Dijkman et al., 2012). However, HCoV-NL63 was rarely detected in Hong Kong when compared to some other countries(Cabeça et al., 2013; Dijkman et al., 2012), which may be related to geographical variation.
The present study revealed different seasonal patterns of each HCoV species. It has been reported that HCoV-OC43 and HCoV-HKU1 were predominant in winter months in temperate regions, whereas HCoV-NL63 and HCoV-229E demonstrated different patterns in various geographical regions(Cabeça et al., 2013; Chiu et al., 2005; Gaunt et al., 2010; Lau et al., 2006; Vabret et al., 2003). In the present study conducted in Hong Kong which is a subtropical city, HCoV-OC43 mainly occurred in the fall and winter, whereas HCoV-HKU1 infections peaked in winter, with a few cases occurred in spring and summer, which are consistent with those in other temperate regions(Cabeça et al., 2013; Lau et al., 2006; Mackay et al., 2012). HCoV-NL63 displayed peak activity in winter in the Netherl and s(Dijkman et al., 2012; Vabret et al., 2003; van der Hoek et al., 2004), but in Hong Kong, HCoV-NL63 showed summer-autumn predominance, which was in line with our previous findings(Lau et al., 2006). HCoV-229E was usually detected in low levels throughout the year in previous reports(Dare et al., 2007; Lau et al., 2006), and thus, the peak activity of HCoV-229E could not be determined. A few studies showed that HCoV-229E was predominant in winter in Guangzhou and Edinburgh(Gaunt et al., 2010; Liu et al., 2014), while a marked autumn seasonality of HCoV-229E was shown in Brazil(Cabeça et al., 2013). In the present study, HCoV-229E was found to be predominant in winter and spring.
The elderly and young children are usually considered more vulnerable to respiratory infections because of their weakened immune system and immature immunity, respectively. In the present study, HCoVs were shown to be most prevalent among the elderly aged > 80 years, followed by young children 10 years(Table 1). Interestingly, HCoV-OC43 had a significantly higher detection rate in the elderly aged > 80 years compared to children aged 0–10 years(P < 0.05)(Table 2), which was not observed for other HCoV species. This finding was in contrast to those in other studies(Dare et al., 2007; Gaunt et al., 2010), in which HCoV-OC43 was more frequently detected in young children than in the elderly. HCoV-OC43 is the most prevalent HCoV species circulating globally and the elderly died of HCoV-OC43 infection in an outbreak was reported(Patrick et al., 2006). Recently, we have also reported the emergence of a recombinant HCoV-OC43 genotype D which was associated with pneumonia in the elderly(Lau et al., 2011). Therefore, continuous surveillance would be required to ascertain if HCoV-OC43 poses a significant public health impact on the elderly, particularly those aged > 80 years and institutionalized in elderly homes in Hong Kong. Moreover, further studies should be performed to underst and the evolution of these HCoVs and potential for re-emergence.
-
We thank Dr. Wing-Man Ko, Secretary for Food and Health Bureau and Dr Constance Hon-Yee Chan, Director of Health for facilitation and support. Views expressed in this paper are those of the authors only, and may not represent the opinion of the Government of the HKSAR. This work is partly supported by the Theme-Based Research Scheme, University Grant Council; Strategic Research Theme Fund and University Development Fund, The University of Hong Kong; Health and Medical Research Fund of the Food and Health Bureau of HKSAR; and Consultancy Service for Enhancing Laboratory Surveillance of Emerging Infectious Disease for the HKSAR Department of Health.
-
Additional informed consent was obtained from all patients for which identifying information is included in this article.
-
CCYY, KYY, PCYW and SKPL designed the study. CCYY, CSFL, HKHL, EYMW and SKPL performed research and analyzed data. RAL, LYS, KHC, VCCC, KYY, PCYW and SKPL provided materials and data. CCYY and SKPL wrote the manuscript. All authors read and approved the final manuscript.


 DownLoad: