


HTML
-
Echovirus 18 (E18), a serotype of species Enterovirus B (EV-B) within the Enterovirus genus, was first identified in 1955 in the United States of America (USA). E18 infection is associated with diarrhea, encephalitis, aseptic meningitis, exanthema, acute tonsillitis, and herpangina in children and has morbidity and mortality rates of approximately 5.6% and 1.8%, respectively (Abedi et al. 2015). E18 is an important pathogen of aseptic meningitis (Miyamura et al. 1990; Turabelidze et al. 2009; Wang et al. 2011; Krumbholz et al. 2016). We previously reported an outbreak of encephalitis/meningitis caused by E18 infection in children in Hebei province, China in 2015 (Chen et al. 2017).
E18 is a nonenveloped, single-stranded, positive-sense RNA virus, and the genome contains approximately 7410 nucleotides with a single open-reading frame (ORF). The 50- and 30-untranslated regions (UTRs) of the genome are essential for viral replication and expression. The ORF, which contains 6570 nucleotides, encodes a polyprotein of 2189 amino acids composed of three protein precursors: P1, P2, and P3. The P1 polyprotein precursor is ultimately cleaved into four structural proteins, VP1–VP4, whereas P2 and P3 are processed into seven nonstructural proteins, including 2A–2C and 3A–3D (Andersson et al. 2002). Genetic recombination and amino acid mutations play important roles in enterovirus evolution and epidemics (Zhang et al. 2011; Zheng et al. 2016). However, little information is available concerning the molecular epidemiology of E18 owing to a lack of complete genome sequences.
Accordingly, in this study, we reported 16 VP1 sequences and six whole genome sequences of E18 strains isolated from children with viral encephalitis (VE) and hand, foot, and mouth disease (HFMD) in China after 2015. Combined with the sequences from the GenBank database, we further performed an extensive genetic analysis to elucidate the molecular epidemiology and genetic characteristics of E18 in mainland China.
-
Sixteen throat swabs from patients with HFMD were collected from different provinces in China between 2015 and 2016. Eighteen cerebrospinal fluid specimens were collected from pediatric patients who were hospitalized with VE or viral meningitis (VM) in 2015. All specimens identified as enterovirus infection by real-time PCR (BioPerfectus Technologies, China; cat. no. JC20101) were cultured in rhabdomyosarcoma cells for virus isolation.
-
Viral RNA was extracted using a QIAamp MinElute Virus Spin Kit (Qiagen, Hilden, Germany). The genome and VP1 gene were amplified using segmented primers and sequenced. Primers for amplifying the complete genome of E18 were designed using the published sequence of the E18-314 (KX767786) strain. Positive PCR products were sequenced using an ABI 3730XL DNA Analyzer (Applied Biosystems, Foster City, CA, USA) at Sinogenomax Company. Primers for PCR amplification and sequencing are listed in Supplementary Table S1.
-
Overall, 129 complete VP1 coding sequences and 18 complete genome sequences of E18 were downloaded from GenBank before January 1, 2018. Eighty-four VP1 gene sequences and 11 genome sequences (Supplementary Table S2) were chosen for analysis after rejection of some similar sequences. These 11 genome sequences of E18 from the GenBank database included six from Germany (2010) (Krumbholz et al. 2016), one from Korea (2005) (Park et al. 2011), one from the USA (1955) (Andersson et al. 2002), and three from China(2015, 2016) (Chen et al. 2017; Zhang et al. 2017). The genome sequences of the EV-B prototypes strains were used as references in the phylogenetic and recombination analysis.
-
Sequence assembly was performed using the Sequencher program (version 5.0; Gene Codes Corporation, USA). Alignment of the VP1 gene and complete genome sequences was performed with the ClustalW package in the MEGA program (version 5.0; Sudhir Kumar, Arizona State University, Tempe, AZ, USA) (Tamura et al. 2011).
Phylogenetic trees based on the alignments of the VP1 gene sequences were constructed with Bayesian Evolutionary Analysis Sampling Trees (BEAST, version 1.7) software using a constant size tree prior and a lognormal relaxed clock (Drummond et al. 2012). The evolution rates of Chinese E18 were also determined based on VP1 gene sequences by BEAST software. A GTR + Γ substitution model was selected as the best-fit model by jModelTest (version 2.1) according to Akaike information criterion (Posada and Crandall 1998). Each Bayesian MCMC analysis was run for 100 million generations. Posterior probabilities were calculated using Tracer software (version 1.5).
Phylogenetic analysis based on the complete genome sequences and mature protein encoding regions was performed using the MEGA program (version 5.0; Sudhir Kumar, Arizona State University, Tempe, AZ, USA), using the Kimura 2-parameter substitution model and neighborjoining method. Bootstrap testing with 1000 replicates was used to estimate the strength of the phylogenetic trees. Bootstrap values > 80% were considered to be a strong support for the tree topology. The genetic distance and identity matrices were determined by group mean and pairwise estimations of the sequence divergence with MEGA and BioEdit programs, respectively (Thompson et al. 1997).
-
Potential recombination analysis within the complete genome sequences of E18 was performed using the similarity plot and bootscan method (version 3.5.1; Stuart Ray, Johns Hopkins University, Baltimore, MD, USA) (Lole et al. 1999). The neighbor-joining method and Kimura 2-parameter substitution model were used in this analysis, with a window size of 500 nucleotides (nt) and a step size of 20 nt. The value of the permuted trees > 80% suggested the potential recombination events.
Sample Collection and Virus Isolation
Determination of the VP1 Gene Sequence and Full Genome Sequence
Sequences from GenBank
Phylogenetic and Evolutionary Analysis
E18 Recombination Analysis
-
Totally thirty-four E18 strains were isolated. Eighteen E18 strains were obtained from patients with VE and VM in Hebei Province during 2015. Sixteen E18 strains were obtained from patients with HFMD in Shandong, Hebei, Shaanxi, Heilongjiang, Jiangsu, and Yunnan provinces in China between 2015 and 2016. The VP1 gene sequences of all E18 strains isolated from patients with HFMD were determined. Two E18 strains isolated from patients with HFMD and four E18 strains isolated from patients with VE were chosen for complete genome sequencing.
-
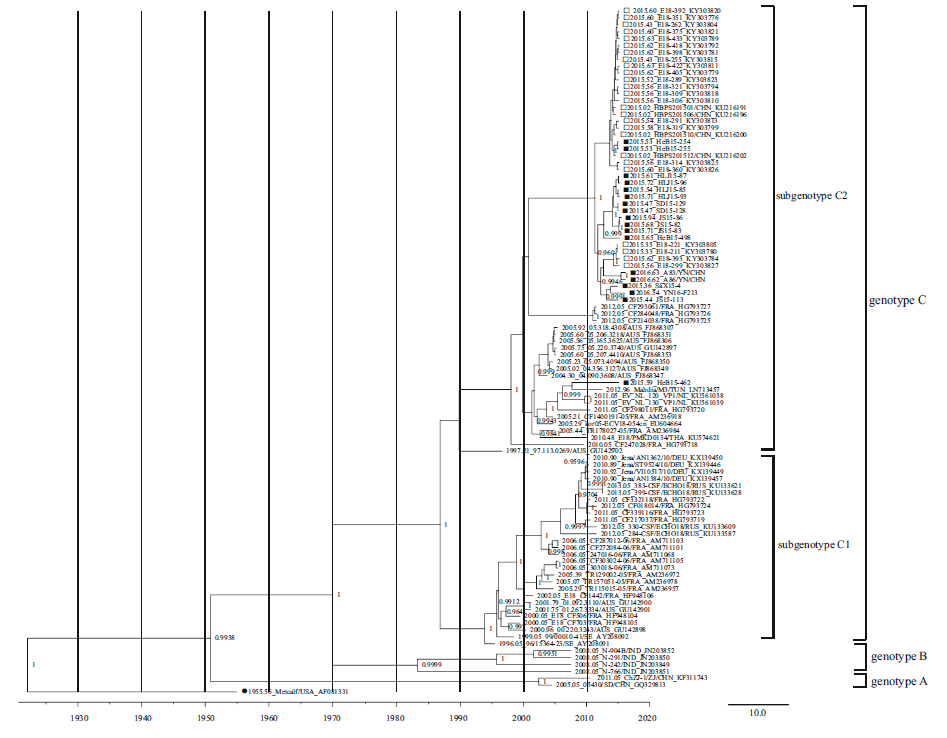
In total, 16 complete VP1 gene sequences and six genome sequences were acquired and submitted to the GenBank database (Table 1). In total, 100 complete VP1 gene sequences from E18 were used for analysis, including 84 retrieved from public databases dated before January 1, 2018. As indicated in our previous study, the phylogenetic tree revealed that E18 strains could be divided into genotypes A, B, and C with the support of the high confidence values (posterior value > 99%). Genotype C can be divided into subgenotypes C1 and C2. All E18 VP1 sequences obtained from patients in China after 2015 belonged to the subgenotype C2 branch (Chen et al. 2017). Except for HeB15-54462, all E18 VP1 sequences obtained from China after 2015 clustered together. There were no evident differences in phylogenetic analysis of the VP1 sequences between HFMD and VE/VM strains (Fig. 1).

Table 1. Sequences of the VP1 gene and complete genome of E18 strains in this study.
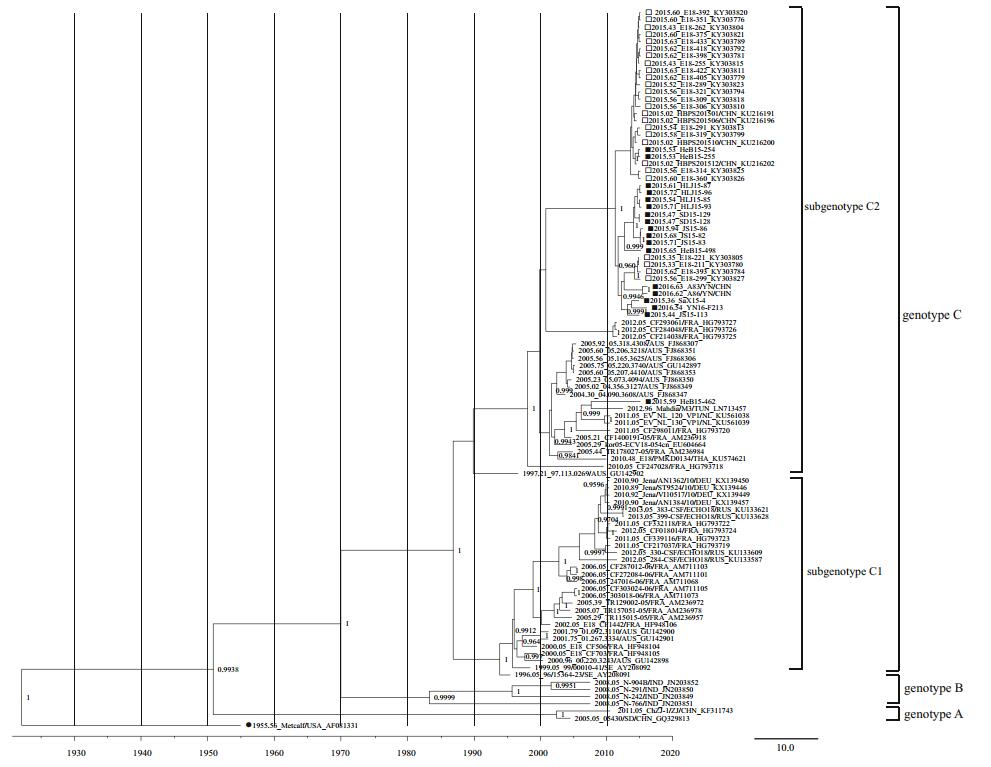
Figure 1. Phylogenetic tree (PT) based on the complete VP1 gene sequences of echovirus 18 (E18). The PT was constructed with BEAST software (100 million generations) using a lognormal relaxed clock, a constant size tree prior, and the GTR + G substitution model. The posterior probabilities from the MrBayes analyses supporting the trees are indicated at the nodes; only values over 95% are shown. Squares indicate China E18 strains after 2015. The filled squares indicate sequences of E18 isolated from HFMD cases, whereas the hollow squares indicate sequences of E18 isolated from VE/VM cases. Filled circles indicate the E18 prototype strain Metcalf. The scale bar indicates years. The strain name, year of sampling, and GenBank accession numbers are shown.
As shown in Supplementary Table S3, there were 72 amino acid substitutions between the prototype strain (Metcalf) and the clinical strains of subgenotype C in this study. Three amino acid substitutions (M104L, Y215F, and I216V) were only found in Chinese strains. The substitution of M104L occurred only in the Hebei strains, including strains from VE/VM and HFMD cases. For amino acids 6, 10, 262, and 275, almost all Chinese strains were consistent with the prototype strain, whereas most of the strains from other countries changed (R6K, N10D, V262T/A, and D275E). However, no significant differences between HFMD strains and VE/VM strains were found. Compared with the prototype strain Metcalf, as the E18 strains from VE/VM, one amino acid substitution at residue 84 (R→N/S) in the BC loop was also found in all the strains from HFMD. Further investigations are required to determine whether these amino acid changes significantly affected the prevalence of E18.
-
In total, 17 complete genome sequences of E18 were used for genomic analysis, including six from this study and 11 retrieved from the GenBank database. Phylogenetic analysis showed that these isolates were grouped into subgenotypes C1 (Germany) and C2 (one from Korea and nine from China) based on the complete VP1 region, except the prototype strain Metcalf. Eight of nine Chinese complete genome sequences were clustered together closely, whereas the HeB15-54462 strain had a closer phylogenetic relationship with the kor05-ECV18-054cn strain from Korea (Fig. 1).
No deletions or insertions were observed in the coding regions. Nucleotide substitutions in the clinical E18 strains were scattered all over the genome. For complete genomes of the genotype C strains, pairwise nucleotide sequence identities were 81.6%–99.9% among the 16 isolates and 98.8%–99.9% and 83.5%–99.7% within groups C1 and C2, respectively. A comprehensive comparison of nucleotide sequences based on each gene was also performed (Table 2). The sequences of structural protein-encoding regions (VP1–4) were highly conserved, whereas the P1 gene nucleotide sequence identities within the genotype C were more than 86.5%. Comparatively, nonstructural genes (2A, 2B, 2C, 3A, 3B, 3C, and 3D) exhibited much more diversity, particularly in the 2B region, with the lowest identity of 74.7% (Table 2).

Table 2. Pairwise nucleotide sequence identities based on corresponding regions of 17 complete genomic sequences of E18.
-
Phylogenetic relationship analyses based on protein-coding regions were performed with MEGA 5.0 software. The grouping of the strains in phylogenetic dendrograms based on P1, P2, and P3 regions was different (Fig. 2), suggesting that potential intratypic recombination had occurred between C1 and C2 strains.
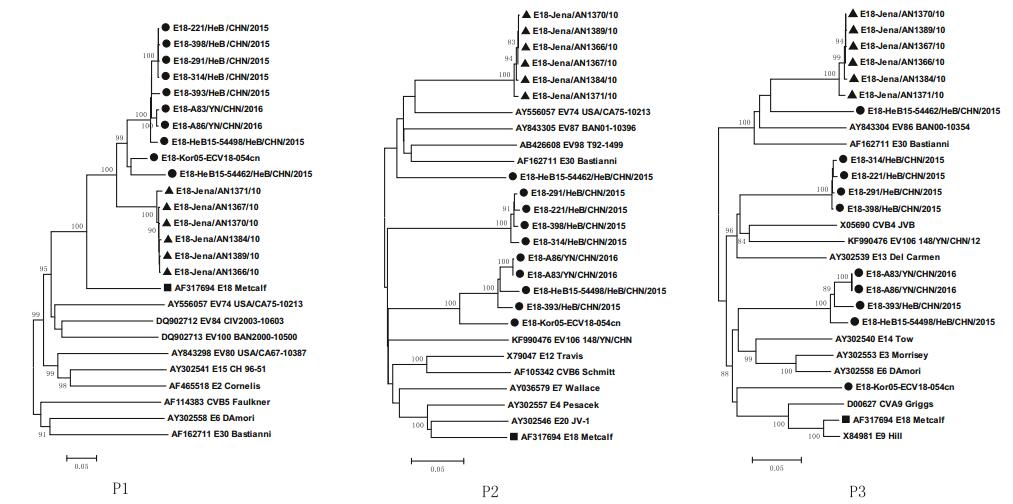
Figure 2. Phylogenetic trees (PTs) showing the relationships between the E18 isolates and EV-B prototype strains. These PTs were constructed by the different genomic regions of 16 complete E18 genomic sequences and EV-B prototype sequences. The neighborjoining trees were reconstructed based on the P1, P2, and P3 regions. Triangles indicate the subgenotype C1. Filled circles indicate the subgenotype C2. Squares indicate the E18 prototype Metcalf strain. The percentages of bootstrap replicates (percentage of 1000 pseudoreplicate datasets) supporting the trees are indicated at the nodes; only values over 80% are shown.
In addition, potential multiple intertypic recombination events between the genome sequences of these E18 strains and other serotypes of species EV-B were also observed. Phylogenetic analyses based on nucleotide sequences of P1 showed that all 16 sequences exhibited the closest phylogenic relationship with the E18 prototype strain Metcalf (Fig. 2). However, based on the 5' UTR, 3' UTR, P2, and P3 regions, subgenotype C1 and C2 sequences clustered with different EV-B serotypes, but not near the E18 prototype strain (Fig. 2, Supplementary Figure S1). The different topologies of the phylogenetic trees between P1 and P2–3 regions suggested that multiple intertypic recombinations of these circulating E18 strains with other EV-B serotypes may have occurred in noncoding or nonstructural protein-coding regions.
-
To further depict the recombination events, similarity plots and bootscan analyses were performed using Simplot software v3.5.1 with the EV-B prototype strain as reference sequences. All the strains in this study were analyzed (Fig. 3). The results revealed that multiple recombination events occurred between the genomic sequences of representative strains and other EV-B serotypes. As indicated in the results, these sequences showed highest similarity and the closest phylogenetic relationship with the E18 prototype strain Metcalf in the P1 region. However, in some segments of the 5' UTR, P2, and P3 regions, the representative strains showed lower similarity with E18 Metcalf (Fig. 3A, 3C, 3E, and 3G). The bootscanning results further confirmed the phylogenetic relationships (Fig. 3B, 3D, 3F, and 3H). As illustrated in our previous study (Chen et al. 2017), two apparent crossing sites in the 5' UTR and 2A gene regions revealed intertype recombination events that were consistent with the deduction described above. According to the bootscanning results, it was hard to confirm the donor sequences.
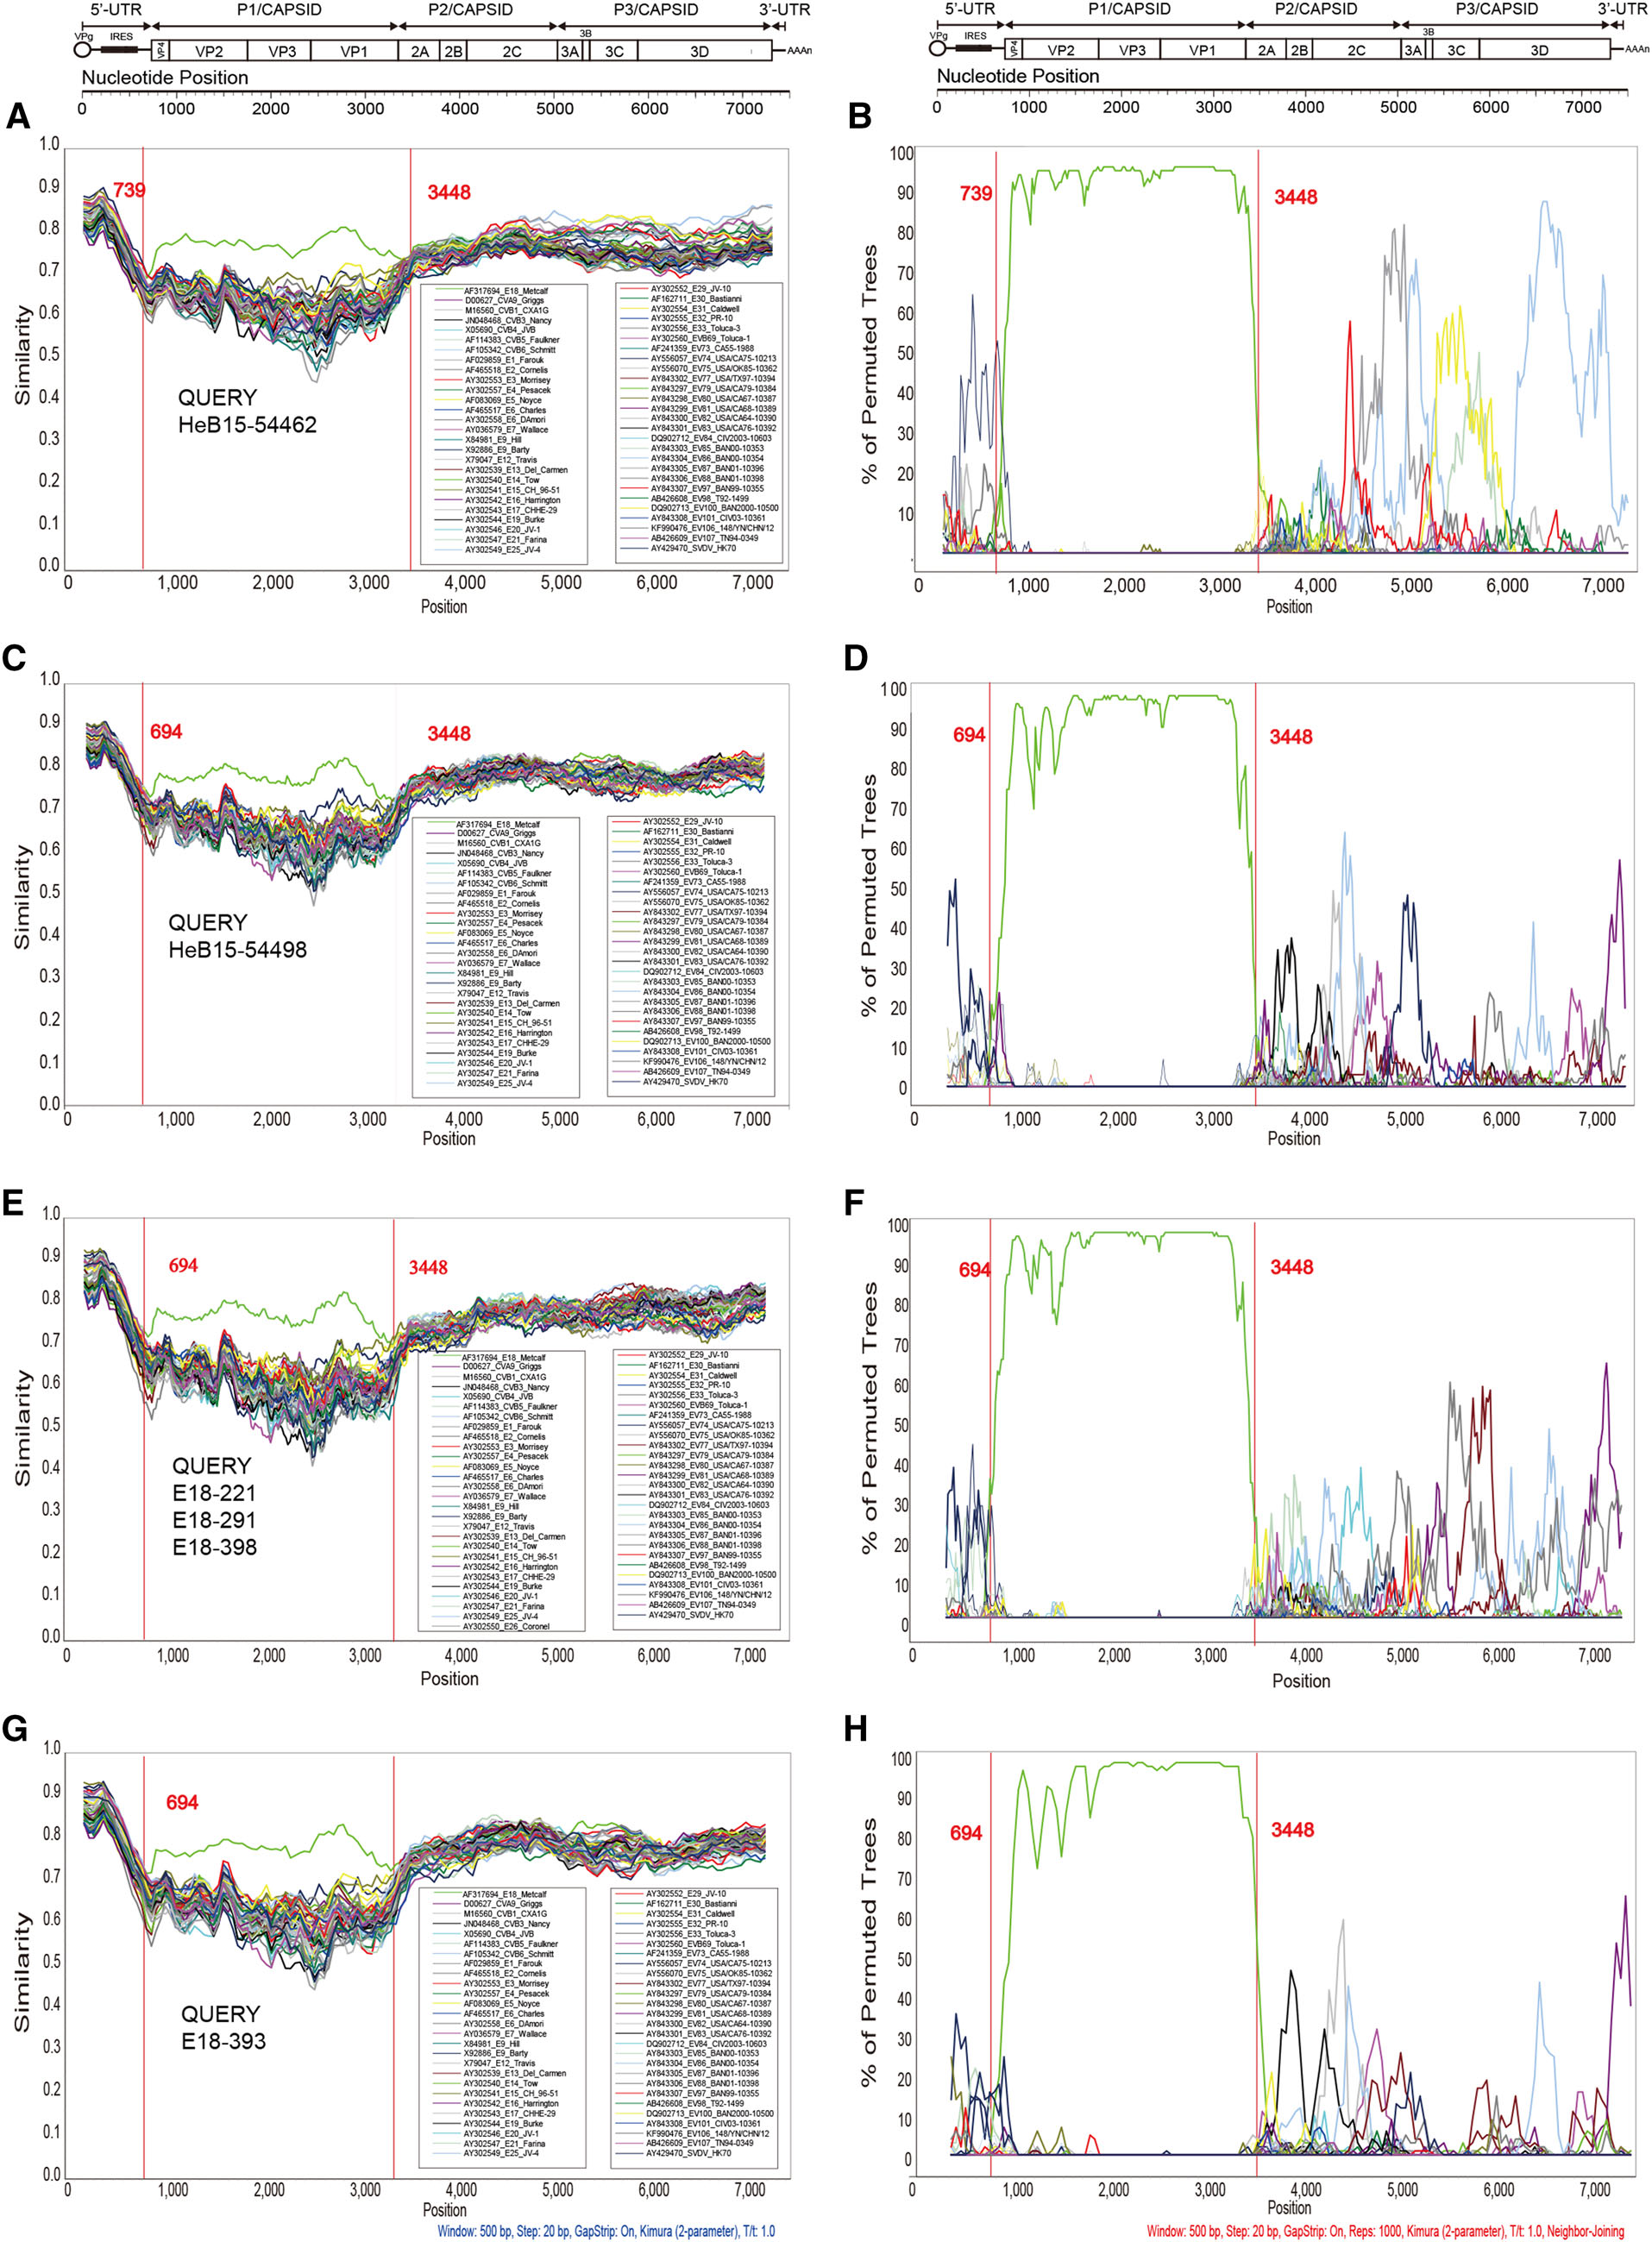
Figure 3. Similarity plot and results of bootscanning analyses of all C2 genotypes of E18 and other EV-B prototype strains based on the fulllength genomes. Six strains in this study were chosen as representative strains. A sliding window of 500 nucleotides moving in 20-nucleotide steps was used in this analysis. A, B HeB15-54462; C, D HeB15-54498; E, F E18-221, E18-291, and E18-398; G, H E18-393. A, C, E, G Results of similarity plot analyses; B, D, F, H results of bootscanning analyses.
Virus Isolation
VP1 Sequence Analysis
Complete Genome Analysis
Phylogenetic Analysis of P1, P2, and P3 Coding Regions
Recombination Analysis
-
In a previous study, we reported an outbreak of E18-associated encephalitis/meningitis in children in Hebei province, in the central part of China during 2015. E18 was responsible for about 75% of all the confirmed enterovirus infections among these VE/VM cases and became the predominant virus pathogen of VE/VM in Hebei province for the first time, surpassing E6, E30, and CV-B5 (Chen et al. 2017). In this study, the 16 E18 strains were from patients with HFMD, confirming the connections between E18 infections and HFMD. Thus, our findings suggested that attention must be paid to E18 during further HFMD surveillance in China.
In this study, molecular epidemiology analysis of E18 was conducted using the complete VP1 gene and complete genome sequences. The global distribution and genetic characteristics of E18 genotypes were clarified. As previously reported, all E18 strains could be divided into genotypes A, B, and C except the E18 prototype strain Metcalf, which was a unique strain. The genotype A strains were from China and included two strains from patients with diarrhea and acute flaccid paralysis. The strains of genotype B were all collected from India in 2008 (Chen et al. 2017). The subgenotypes C1 and C2 strains were the predominant subgenotypes circulating globally in recent years (Chen et al. 2017). All E18 strains obtained after 2015 in China belong to the C2 genotype, and all strains clustered into one branch, except HeB15-54462.
Genetic recombination was evolutionarily important for EVs and could lead to changes in the virulence of enterovirus and trigger serious public health problems (Lukashev et al. 2005; Zhang et al. 2011; Lukashev et al. 2014). The results of this study suggested that the current E18 strains were potential multiple-recombinant viruses containing many other EV-B donor sequences. Recombination was frequently detected in the 5' UTR, P2, and P3 regions, for which it was hard to confirm the donor sequences. However, the sequences of the P1 region were relatively conserved because this structural protein is important for proper assembly of the viral capsid by the virus (Oberste et al. 2004; Lukashev 2005). The P1 region is also important for receptor recognition, which is associated with the tropism of enterovirus (He et al. 2002; Rezaikin et al. 2009; Chen et al. 2012).
Based on each of the analyzed regions (P1, P2, and P3), phylogenetic analysis also revealed that these nine Chinese E18 strains (seven strains from Hebei province during 2015 and two strains from Yunnan province during 2016) clustered into different branches with other EV-B prototype strains. They exhibited much more diversity with the current European endemic strains in genome sequence identities; however, the recombinational patterns were also different among China E18 strains. Zhang et al. (2017) reported that the E18 strains A83 and A86 recombined with the swine vesicular disease virus strain HK70 in the 3B region. In contrast, similar results were not observed among the strains in this study. Thus, these E18 sequences had obviously intra- and intergenotype differences, suggesting that these E18 strains may have evolved independently, through several different transmission chains, in China.
The causes of the outbreak of E18-associated encephalitis/meningitis in children in Hebei province are multifactorial. Changes in the virus are likely to contribute to or exacerbate the outbreak. VP1 protein from enterovirus contains many significant neutralizing antigenic determinants. Mutations at critical sites may cause escape from the neutralization immunity, which then may lead to the prevalence of this strain. In this study, three amino acid substitutions (M104L, Y215F, and I216V) were only found in Chinese strains. However, most of the strains from other countries had changes at amino acids 6 (R → K), 10 (N → D), 262 (V → T/A), and 275 (D → E), and almost all Chinese strains were consistent with the prototype strain Metcalf. Further studies are needed to determine the potential effects of these mutations in China epidemic strains. The B-C loop located at amino acids 78–89 in the E18 VP1 region forms a part of the epitope on the surface of the virion, which is important for the reactivity of typespecific neutralizing antibodies (Reimann et al. 1991). There was one amino acid change located at residue 84 (R → N) of the BC loop. The V152S amino acid change in the DE loop structure of the VP1 protein was reported in Taiwan E18 isolates during an associated outbreak of aseptic meningitis in 2006 (Tsai et al. 2011). However, this amino acid substitution was not found in this study. Genetic variations in the E18 strains suggested antigenic drift, which may have contributed to this outbreak (Chen et al. 2017). Additional studies are required to confirm whether these amino acid changes play significant roles in mediating the prevalence of E18.
In summary, in this study, we found that current China E18 strains were potential multiple-recombinant viruses, which is consistent with previous studies (Chen et al. 2017; Zhang et al. 2017). Furthermore, these China E18 strains can cause HFMD, VE, and meningitis, although there were no significant associations between clinical features and viral genomic characteristics. Currently, there are not enough E18 genome sequences to elucidate the associations between genetic characteristics and clinical manifestations. Accordingly, more studies are needed to determine the detailed evolutionary and genetic characteristics of E18 strains in mainland China.
-
This work was supported by the National Science and Technology Major Project of the Ministry of Science and Technology of China (Grant Nos. 2017ZX10104001-005-010 and 2017ZX10103004-004); Beijing Natural Science Foundation (Grant No. 7184208); Capital Clinical Feature Project of Beijing Technology Program (Grant No. Z151100004015046); Basic and Clinical Research Cooperation Project of Capital Medical University (Grant No. 17JL11); and Research Training Fund of Capital Medical University (Grant No. PYZ2017012). The sponsors had no role in the study design, data analysis, manuscript preparation, or publishing decision.
-
XC, ZX, and WX conceived and designed the experiments; XC, TJ, and JG performed the experiments; XC and WW analyzed the data; XC and ZX contributed to the writing of the manuscript. All authors reviewed and approved the final manuscript for submission.
Acknowledgements
Author Contributions
-
The authors declare that they have no conflict of interest.
-
The study was approved by the Medical Ethics Committee of Beijing Children's Hospital, Capital Medical University (Permit No. 2015-8). Informed consents were obtained from legal guardians of all patients prior to the collection of CSF and throat swab samples.
Conflict of interest
Animal and Human Rights Statement
-

Table S1. List of nucleotide sequences of primer for amplification of the whole genome sequences of E18

Table S2. List of the 84 complete VP1 encoding sequences and 11 complete genome sequences of E18 downloaded from GenBank.

Table S3. Amino acid changes in VP1 gene of E18 strains belonged to subgenotypes C1 and C2 comparing with the prototype strain Metcalf.
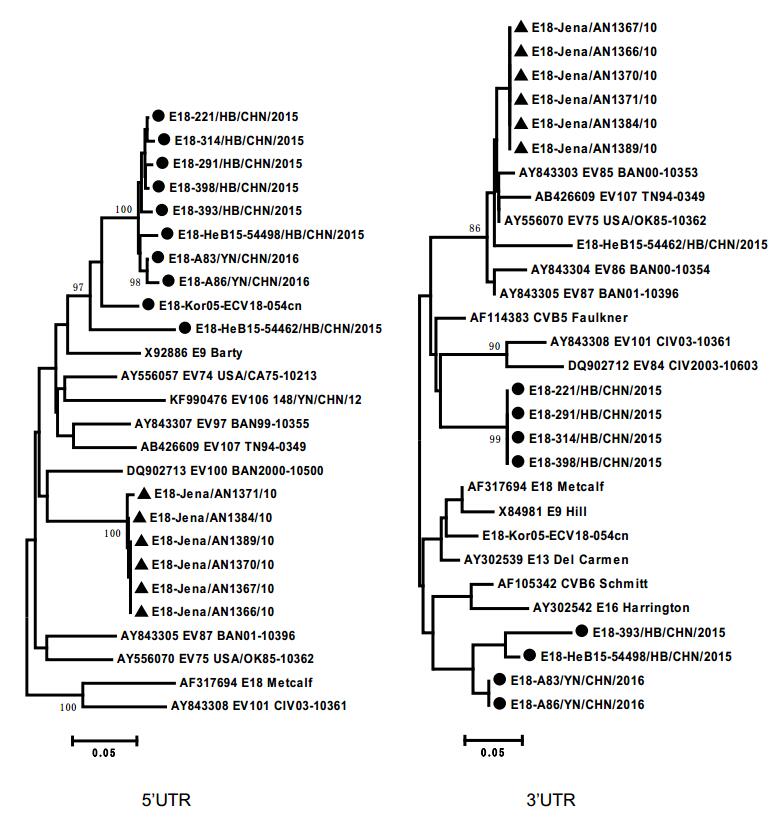
Figure S1. Phylogenetic trees showing the relationships between the E18 isolates and EV-B prototypes. These were constructed by the different genomic regions of 17 complete E18 genomic sequences and other EV-B prototype sequences. The neighbour-joining trees were reconstructed based on the 5′ UTR and 3′ UTR regions, respectively. Triangles indicated the subgenotype C1. Filled circle indicated the subgenotype C2. Squares indicated the E18 prototype Metcalf strain. The percentage of bootstrap (percentage of 1000 pseudoreplicate datasets) replicates supporting the trees are indicated at the nodes.


 DownLoad: