


HTML
-
Since the early twenty-first century, human beings have experienced several serious public health events caused by pathogens shared with wild or domestic animals, such as severe acute respiratory syndrome coronavirus (SARS-CoV), Middle East Respiratory Syndrome coronavirus (MERS-CoV), and influenza A (H1N1) virus et al. Emerging zoonoses pose a growing threat to global health, having caused hundreds of billions of dollars in economic losses in the past two decades (Karesh et al. 2012). The severe acute respiratory syndrome coronavirus 2 (SARS-CoV-2) which can be deadly was first identified in Wuhan, China in December 2019 (Cheng and Shan 2020; Wu P et al. 2020b).
It evolved from wildlife and can cause fever and severe respiratory syndrome in human being which were named COVID-19 by the World Health Organization (WHO) (Huang et al. 2020; Xu et al. 2020). As of March 27, 2020, the still ongoing outbreak of around 82, 098 confirmed cases and 3298 deaths in mainland China (http://2019ncov.chinacdc.cn/2019-nCoV/), and Most new coronavirus cases are now outside of China, with 200 countries reporting cases up to now. On January 30, 2020, the WHO announced that the epidemic constituted a public health emergency of international concern. These vulnerabilities emphasize the need for a systematic, preemptive approach that aims to prevent the spread, or even the initial emergence of pandemics. The systematic preemptive approach refers to the rapid assessment and an early warning of outbreaks of infectious diseases.
Early warning is an important measure to control and prevent outbreaks and epidemics of infectious diseases. The core is to find the abnormal distribution of infectious diseases and then estimate the risk of an outbreak. Its main work is to collect and analyze relevant information and data on the incidence of infectious diseases, and to explore the spatiotemporal transmission and epidemic laws of infectious diseases by using genomics, statistics and mathematical methods. It is indispensable to use mathematical methods to establish appropriate warning models in the early epidemic stage so that relevant departments can take timely response measures to prevent the development into a malignant state and reduce the degree of harm as far as possible. As recognized by the WHO, mathematical models, especially those that are timely, play a key role in informing evidence-based decisions by policy-makers (Morgan 2019).
-
Whenever a new pathogen appears, its origin always causes widespread concern. Most of the emerging infectious diseases that affect humans are zoonotic, which can be traced back to some specific wildlife, but there have been few analytical tools to determine which host species may carry the next virus that will infect humans, or which viruses may cross species boundaries directly. However, with the advent of the era of big data, it no longer seems to be a difficult problem (Fig. 1).
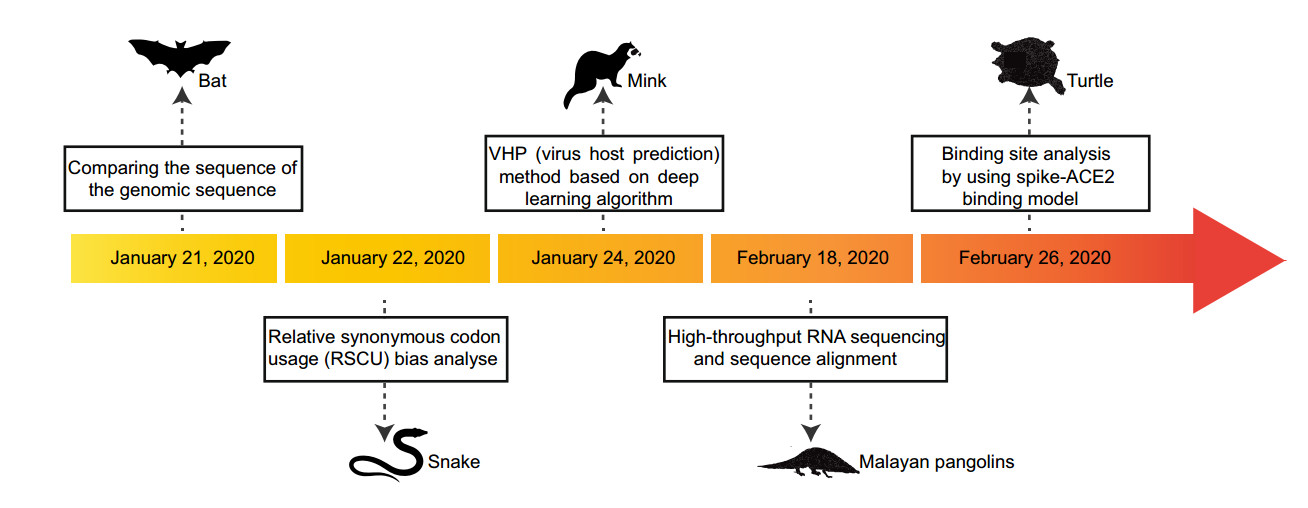
Figure 1. Prediction of susceptible hosts, and date refers to the publication date of the preprint article.
-
In order to understanding patterns of viral diversity in wildlife and determinants of successful cross-species transmission, or spillover, Kevin et al. created a database of 2805 mammal-virus associations, including 754 mammal species (14% of global mammal diversity) from 15 orders and 586 unique viral species (recognized viruses found in mammals) from 28 viral families. They used generalized additive models to identify and rank host-specific predictors of the number of total and zoonotic viruses in mammals. The model showed that bats are host to a significantly higher proportion of zoonoses than other mammalian orders (after controlling for reporting effort and the other predictor variables). Moreover, the phylogenetic host breadth and other viral traits are significant predictors of zoonotic potential, providing a novel framework to assess if a newly discovered mammalian virus could infect people (Olival et al. 2017).
-
Identifying the origin of the virus can help health authorities carry out accurate health surveillance. Undoubtedly, the development of genome sequencing technology has contributed a great deal to SARS-CoV-2 traceability. Wassenaar and Zou (2020) demonstrated that the non-coding flanks of the viral genome can be used to correctly separate the recognized four Betacoronavirus subspecies by whole-genome sequence comparisons, which has implications for rapid classification of new viruses. Comparing the sequence of the genomic sequence obtained with various mammalian coronavirus sequences suggests that bats may be a natural reservoir for SARS-CoV-2 (Paraskevis et al. 2020; Zhou et al. 2020), and Pangolins are potential intermediate hosts (Wong et al. 2020; Zhang et al. 2020).
Chen et alal. (2020) used a low-input metagenomic next-generation sequencing (mNGS) approach on RNA extracted from bronchoalveolar lavage fluid (BALF) from two patients. The mNGS methodology used to investigate infectious microorganisms from original clinical samples is currently achievable (Gu et al. 2019). Firstly, they found that a majority of the viral reads (99.9% and 99.7% respectively for sample 1 and 2) were associated with coronaviruses and identified SARS-CoV-2 as the sole pathogen. The genome comparisons indicated that SARS-CoV-2 shared a 98.7% nucleotide identity with bat coronavirus strain BtCoV/4991 while it was quite divergent from SARS-CoV (79.7%). Furthermore, phylogenetic trees were reconstructed based on the nucleotide alignment of key viral genes by using the maximum likelihood method, employing a best fit substitution model and a SPR branch swapping algorithm. An understandable phylogeny showed SARS-CoV-2 has the most recent common ancestor with the neighboring bat coronaviruses, supporting the bat origin.
Another way to help identify the origin and evolutionary trends of viral hosts is to study codon usage bias given that the use of viral codons is subject to different selection pressures in different host environments. Ji et alal. (2020) found that the codon usage bias of SARS-CoV-2 is most similar to that of snakes by using relative synonymous codon usage (RSCU) analyses. In fact, there are two levels of codon usage biases, one is at the amino acid level and the other is at the synonymous codon level. Amino acid composition can also introduce confounding effects if we only focus on the variation of synonymous codon usage. In order to overcome the above problem, another research team performed global correspondence analysis (CA), within-group correspondence analysis (WCA) and between-group correspondence analysis (BCA) among different genes in the coronavirus viral sequences (Gu et al. 2020). The results showed that the SARS-CoV-2 had amino acid usage similar to bats, but the synonymous codon usages were relatively different, which indicated similar protein characteristics but maybe different evolutionary histories. However, these analytic approaches have not been used in studying viral sequences widely, so the information only provided some insights into wildlife reservoirs and that the further validation by animal model experiments is indispensable. Moreover, as a potential intermediated mammal, virus in civets share ~ 99.8% genome identity to SARS-CoV in humans. As the origin for SARS-CoV-2 is most possibly the bats, and we should also be concerned about other mammals, while are likely to be predicted as intermediate hosts.
Prediction of the Potential of the Virus to Infect People
Prediction of Origin and Intermediate Hosts
-
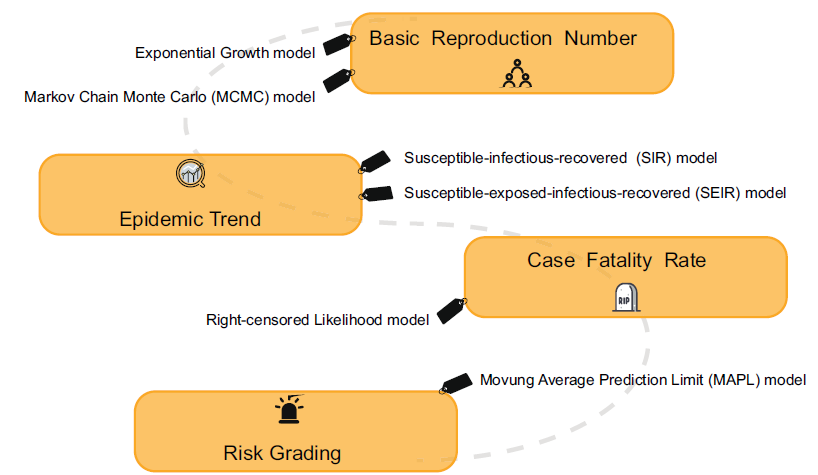
In the case of a gradually improved infectious disease surveillance system, the research on forecasting and early warning of epidemics based on models has become the focus of the public health system. The principle aim is to establish a suitable mathematical model based on the dynamic characteristics of infectious disease transmission, and to conduct qualitative as well as quantitative analysis and computer simulations of the transmission process. Currently, the models used for forecasting and warning at home and abroad mainly include the time series model, the linear regression model, the grey dynamics model, the artificial neural network model, the Markov model, the Bayesian model and the Complex network model (Jennings et al. 2008; Zhu et al. 2011; Wesolowski and Suchacz 2012; Aghdam et al. 2013; Shen et al. 2013). Practice has proved that in public health emergencies, it is important to establish suitable prediction models to change passive prevention into active prevention. For example, during the outbreak of foot and mouth disease in the UK, the politicians relied heavily on mathematical modeling in their selection of epidemic control measures with great success (Ferguson et al. 2001; Keeling et al. 2001). In response to the current epidemic of SARS-CoV-2, many researchers have developed mathematical models with varying degrees of complexity, aiming to assess the capacity of pathogen transmission and which interventions are most likely to be effective (Fig. 2).
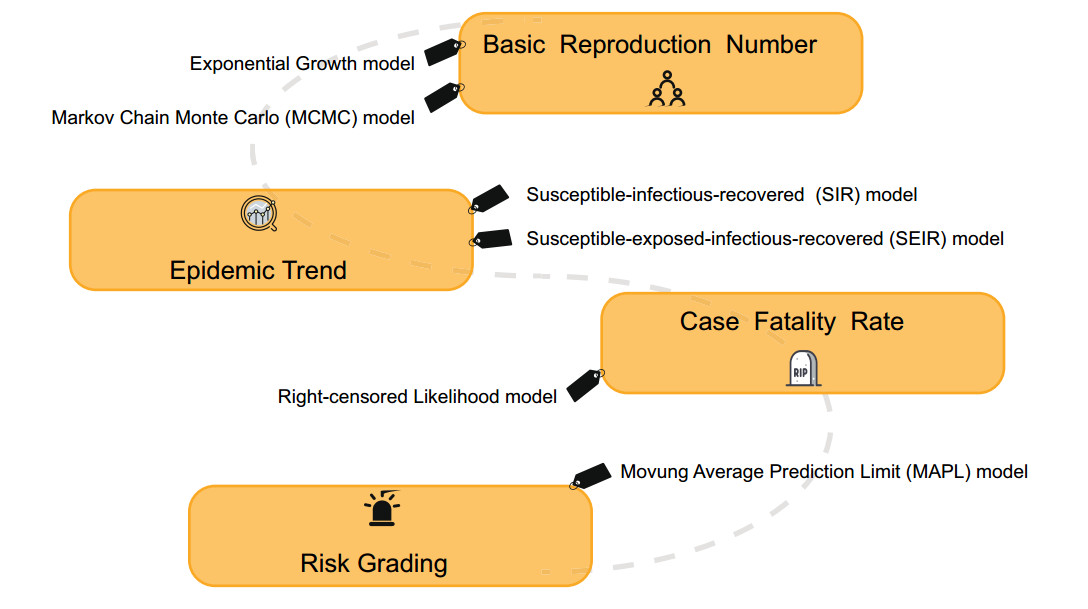
Figure 2. Mathematical model for transmission dynamics analysis for macroscopic analysis.
-
In the early stages of the outbreak, it is important to gain an understanding of the transmission pattern and potential of SARS-CoV-2. If more than one secondary case is produced for each primary case on average, the chain of transmission events within an outbreak is extended. The basic reproduction number (R0) is the most important index to measure and directly explain the level of virus transmission (Anderson et al. 2004). It refers to the average number of people who will be infected with an infectious disease under natural conditions. Due to the facts that (1) the infected patients might die, (2) some patients may develop immunity after recovering, and (3) that the infected population is of a limited size, the R0 value will decrease with the decrease in the infected population, and the transmission speed is significantly reduced (Anderson et al. 1992). Essentially, R0 determines how intensive a policy will need to be to control the epidemic, whereas both the generation time (Tg) and R0 determine the time available to implement suitably intensive controls.
One way to estimate R0 is to model an infectious disease curve that obeys exponential growth (De Silva et al. 2009). The nonlinear least square (NLS) framework has been adopted for data fitting and parameter estimation (Wallinga and Lipsitch 2007; Zhao et al. 2019). Since the transmission chain of SARS-CoV-2 remains unclear, many researches adopted the Tg information from SARS and MERS, which is similar to SARS-CoV-2. Zhao et alal. (2020) reviewed the SARS-CoV-2 cases and suggests they might have been under-reported roughly from the 1st to the 15th of January 2020 because the number of cases appeared inconsistent with the following rapid growth of the epidemic curve since the 16th of January 2020. They modeled the epidemic curve of SARS-CoV-2 cases, in mainland China from December 1, 2019 to January 24, 2020 through the exponential growing Poisson process. The number of unreported cases was determined by the maximum likelihood estimation. As a result, they estimated the R0 of SARS-CoV-2 was 2.56 (95% CI: 2.49–2.63) and the number of unreported cases was 469 (95% CI: 403–540). This study helped us understand what might be happening in the early stages of outbreak. Another algorithm estimated R0 using the Markov Chain Monte Carlo (MCMC) method with Gibbs sampling and a non-informative flat prior. Wu et al. estimated the R0 for SARS-CoV-2 was 2.68 (95% CI: 2.47–2.86) (Wu JT et al. 2020a).
Although the R0 values estimated by different methods were different to some extent, it was not difficult to find that the R0 value remained larger than 1 at the early stage of the outbreak indicating the possibility of sustained human-to-human transmission (Li et al. 2020). Adam et al. estimated that the median daily R0, declined from 2.35 (95% CI: 1.15–4.77) 1 week before travel restrictions were introduced on January 23 to 1.05 (95% CI: 0.413–2.39), which may have reflected the outbreak control efforts or a growing awareness of SARS-CoV-2 during this period (Kucharski et al. 2020).
-
Population estimates of R0 can obscure considerable individual variation in infectiousness, as highlighted during the global emergence of SARS by numerous super spreading events in which certain individuals infected unusually large numbers of secondary cases (Dye and Gay 2003; Leo et al. 2003; Lipsitch et al. 2003; Riley et al. 2003; Shen et al. 2004; Bauch et al. 2005). While super spreading always remains a rare event, it can result in a large and explosive transmission event and have a major impact on the course of an epidemic.
For each primary case, Riou et al. generated secondary cases according to a negative-binomial offspring distribution with mean R0 and dispersion k (the lower the value of k, the higher the impact of super spreading). After 1000 stochastic simulations for each individual combination, their simulations suggest that very low values of k are less likely, and the establishment of sustained transmission chains from single cases cannot be ruled out (Riou and Althaus 2020). Therefore, the author emphasized the importance of screening, surveillance and control efforts, such as early detection and isolation, contact tracing and the use of personal protective equipment.
-
The most classic infectious disease prediction and early warning models are the susceptible–infectious–recovered (SIR), susceptible–infectious–susceptible (SIS) and susceptible-infectious-recoverd-susceptible (SIRS) models. The SIR model is used to predict diseases in which individuals can obtain permanent immunity after infection. The SIS model is used for diseases in which the individual is not immune after the infection is cured. The SIRS model is used for diseases in which individuals can acquire immunity for a certain period of time after infection. However, these common predictive models are only applicable when there is a non-drug prevention intervention. The estimated numbers of infected people far exceed reported cases in the available literature which used these models (Anastassopoulou et al. 2020; Peng et al. 2020). So it is necessary to improve these traditional models according to the actual situations.
Joseph et al. used the susceptible-exposed-infectious-recovered (SEIR) model to simulate the Wuhan city epidemic since it was detected in December, 2019 (Wu JT et al. 2020a). They estimated that 75, 815 individuals (95% CI: 37 304–130, 330) individuals had been infected in Wuhan city as of January 25, 2020. And then the SEIR model was extended into a SEIR-metapopulation model to simulate the spread of SARS-CoV-2 across mainland China. Given that public health professionals and the general public have realized the threats caused by virus, the transmissibility of the epidemic might be reduced compared with its nascent stage at Wuhan city. So they assumed that the transmissibility of SARS-CoV-2 was reduced by 0%, 25%, and 50% after Wuhan city was quarantined on January 23, 2020 and the rate of transmissibility was similar across all cities. The estimated result was that if there was no reduction in transmissibility, the Wuhan city epidemic would peak around April of 2020, and local epidemics across cities in mainland China would lag by 1–2 weeks. A 50% reduction in transmissibility would push the R0 to 1.3, in which case the epidemic would grow slowly without peaking during the first half of 2020. These analytical data gave us an early warning that SARS-CoV-2 could be about to become an epidemic in the absence of mitigation on its present trajectory.
The SIR structure was modified based on the unique characteristics of the outbreak of SARS-CoV-2. In the modified SIR model, recovered population R was extended to include those cured, died, and isolated in hospitals because under those conditions the virus does not spread (Zhu et al. 2020). This model was used to predict the trend under three possible scenarios, such as the current trend maintained, control efforts expanded, and person-to person contact increased due to work resuming. By March 12, 2020, the total infectious estimates in each of the three scenarios are 72, 172, 54, 348, and 149, 774. The model also predicted that the probability of no new cases in other cities at the end of February is 95.4%, 100%, and 75.7%, under these three scenarios respectively. The simulation suggested that strict quarantine of inner or inter-city population movement would have a significant effect on the suppression of virus spreading.
-
The severe measures such as extending holidays and limiting group activities played an important role in stopping the spread of the epidemic. Significant results have been accompanied by high social costs. Therefore, in order to plan for the gradual recovery of social production activities after the epidemic is under control, it is essential to scientifically predict the future development of the epidemic.
In epidemiological studies, the moving average method is mostly used to provide early warning of infectious diseases (Petukhova et al. 2018). The main idea is to calculate based on the data of infectious disease incidence over a long period of time and then establish an early warning line. By comparing the incidence data of a certain period with the early warning line, the epidemic trend of the disease can be judged and the risk of incidence can be estimated. However, this method can only be applied to the outbreak warning of existing infectious diseases. To substitute for it, a moving average prediction limit (MAPL) method was proposed, its standard deviation can be used to establish a prediction limit to predict the epidemic trend, so as to timely predict the epidemic risk grading in the affected area. The data has shown that the number of new cases in the whole country has been moving towards a faster decline zone in the 11 days after February 12, 2020 outside Hubei province, and stabilized near the prediction limit of the faster decline zone in the 5 days up to February 23, which is a low risk level. It indicates that after the nationwide anti-epidemic campaign, the epidemic situation in the country has been reduced as of the end of February. The overall trend of new suspected cases is consistent with the number of new confirmed cases. It is speculated that as long as the previous effective measures for outbreak prevention and control are adhered to, there is a great hope to keep the outbreak at a low risk level, and the risk of the epidemic in Hubei province in the future will be less serious. There is no doubt that understanding the real-time risk levels of the epidemic has a great guiding role in planning measures to gradually lift restrictions and restore normal economic production and social life.
-
The term case fatality rate (CFR) is widely used to describe the proportion of infected people who eventually die from a disease caused by pathogens. Assessing CFR can help understand the severity of infection and anticipate the likely number of deaths by the end of the epidemic.
SARS-CoV-2 is the virus that can cause death in infected people. Jung et alal. (2020) estimated the risk of death from confirmed cases (cCFR), while using data from confirmed cases outside mainland China and a right-censored likelihood to model the number of deceased cases and process the determination bias. The estimated cCFR value was 5.3% when the index case onset date was fixed on December 8, 2019 and 8.4% when epidemic exponential growth occurred to fit the data with other model parameters. Although the cCFR of COVID-19 is not high compared to the 17% CFR of SARS in Hong Kong (Donnelly et al. 2003; Ghani et al. 2005) and 20% CFR of MERS in South Korea (Mizumoto et al. 2015), the 5%–8% risk of death is by no means negligible given the overall scale of the ongoing epidemic. However, the cCFR estimation models also have limitations, such as the cCFR only addressed fatality among confirmed cases. More precise infection fatality risk (IFR) estimates including infected individuals other than confirmed cases. In addition to quantifying the overall risk of death, future studies should identify groups at risk of death such as the elderly and potential comorbidities.
Prediction of the Transmissibility of Pathogens
Prediction of the Super Spreading Event
Prediction of the Trend of Epidemic
Prediction of the Risk Grading
Prediction of the Case Fatality Rates of Diseases
-
At present, in the context of global economic integration, countries around the world are getting close. On the one hand, human beings enjoy the convenience brought by economic development, and on the other hand, they bear the survival challenges brought by ecological destruction. With the continuous destruction of the environment and growth of population, human beings have been frequently attacked by infectious diseases. The COVID-19 epidemic caused much suffering, significant mortality, great disruption to social and work activities and considerable economic losses. To mitigate the spread of the virus, the Chinese Government has progressively implemented a metropolitan-wide quarantine of Wuhan city and several nearby cities since January 23, 2020. Numerous domestic airports and train stations, as well as international airports, have adopted temperature screening measures to detect individuals with fevers. Strict control measures are being implemented in densely populated and remote areas, including extended holidays, cancellation of crowd gatherings, calls for home isolation, and so on (Xiong and Yan 2020). Fortunately, with the efforts of the Chinese government and people, the outbreak has been brought under control relatively quickly.
The outbreak has not only caused huge losses, but also reminded us of the need to strengthen public health surveillance and management. At the micro level, it is important to find the agent that is the cause of observed morbidity and mortality (Gardy and Loman 2018). When used with phylogenetic analysis, it is possible to find the natural reservoir and intermediate host of the virus, which can help us isolate the source of the infection accurately. Furthermore, codon usage bias analysis provides us with another method and perspective to trace the source of the virus, although the results are still open to question. At the macro level, to solve the surveillance and detection problem, the next set of issues concern data capture, the development of diagnostic tests and treatment algorithms and the identification of public health measures to control the epidemic spread. Real-time data capture and associated analysis to reveal how the epidemic is expanding and how interventions are acting to slow its spread is essential. Based on the mathematical frameworks, we can better assess the infectious capacity of pathogens and the effects of public health control measures.
But the existing prediction models still have great limitations. First of all, the establishment of the model cannot be separated from the support of a large amount of data. In other words, the key to establish a reliable model is to track the epidemic dynamics and release the clinical information and epidemiological data in a timely manner. However, official data is often uncertain because medical resources are limited. The available data only reports confirmed cases in hospitals and ignores infected people who do not have access to medical services. This makes it difficult to accurately predict the development of the epidemic. Secondly, we need to make it clear that fitting all factors into a model is not easy and models are often built on strong assumptions so the data estimated by the model may be biased in some cases. In this case, simple public health measures are unlikely to be effective, and other measures are needed, such as tighter restrictions on movement, greater availability of antivirals drugs and expanded vaccine development and production facilities. These questions suggest that there is still much room for improvement in rapid risk assessment and accurate early warning of emerging infectious diseases. It is clearly in everyone's interest to greatly enhance global surveillance capabilities, especially in developing regions, and concomitantly to improve basic training in infectious disease and molecular epidemiology.
-
JL is supported by grants from the National Science and Technology Major Project (2018ZX10101004) and the Youth Innovation Promotion Association of CAS (2019091).
-
The authors declare that they have no conflict of interest.
-
This article does not contain any studies with human or animal subjects performed by any of the authors.


 DownLoad: