


HTML
-
Severe fever with thrombocytopenia syndrome (SFTS) is characterized by sudden onset of high fever, respiratory or gastrointestinal symptoms, leukocytopenia, thrombocytopenia, neurological symptoms and possibly even death within 7–14 days after disease onset, with a reported lethality rate varying between 12% and 30% (Yu et al. 2011; Gai et al. 2012; Wang et al. 2017). According to monitoring data released by the Chinese Center for Disease Control and Prevention, SFTS has expanded to at least 19 provinces/municipalities in mainland China. It has also been reported in other countries, such as Japan, the Republic of Korea, the United States, and the United Arab Emirates (Wang et al. 2017). Currently, there is no effective antiviral medicine or conventional vaccine to provide sustainable control of the spread of SFTSV. A better understanding of the mechanism underlying SFTS progression could be helpful for developing new preventive and therapeutic strategies.
High levels of viral RNA in the blood at admission, exaggerated immune activation and overproduction of inflammatory cytokines such as interleukin (IL)-1β, IL-6, IL-10, tumour necrosis factor alpha (TNF-α), and interferon (IFN)-γ, have been reported to significantly contribute to the severity of SFTS (Deng et al. 2012; Sun et al. 2012a). Our team found that the frequencies of immune cells, such as monocytes, myeloid dendritic cells and T lymphocytes in the peripheral blood, are dramatically decreased during the acute phase of SFTSV infection, especially in patients who eventually succumb to the disease (Peng et al. 2016; Zhang et al. 2017). Natural killer (NK) cells are effector cells of the innate immune system that are important in controlling viral infections (Jost and Altfeld 2013). However, the role of NK cells in controlling SFTSV infection remains to be fully elucidated. The number or percentage of NK cells (only including CD3-CD56+ NK cells) decreases during the acute phase and in patients who eventually die from the disease, according to several studies (Sun et al. 2014; Weng et al. 2014; Lu et al. 2015). However, no study has characterized the changes in NK cell phenotypes and functions or evaluated the correlation between NK cell subsets and disease severity in SFTS patients.
In human peripheral blood, five NK cell subsets can be defined on the basis of the relative expression of the markers CD16 and CD56 (Poli et al. 2009). The antiviral response of NK cells includes the direct killing of virusinfected cells, which is mainly mediated through the release of perforin and granzymes, and the production of pro-inflammatory cytokines, including IFN-γ and TNF-α (Jost and Altfeld 2013). Humans with specific NK cell deficiencies often suffer from life-threatening viral infections (Orange 2006; Jost and Altfeld 2013). Recurrent herpesvirus infections were observed in one NK-deficient patient (Biron et al. 1989), suggesting that NK cells are clinically important for antiviral immunity. In addition, previous reports have indicated that experimental influenza infection of NK cell-depleted mice results in delayed clearance of the virus from the lungs and augmented morbidity and mortality (Nogusa et al. 2008). The understanding of the interactions of the innate immune response (in particular, NK cell responses) to SFTSV infection is currently very limited.
In the present study, we evaluated the correlations between NK cell subset frequencies and the SFTS index (SFTSI) in 29 SFTS patients (including 15 with mild and 14 with severe disease). Additionally, we characterized the phenotypic and functional characteristics of the CD56dimCD16+ NK subset in 18 SFTS patients (including 9 with mild and 9 with severe disease). This population exhibited significantly higher proliferative activity, cytolytic activity and effector function and elevated production of cytokines during the early stage of SFTSV infection. Such information will be useful in guiding more in-depth investigations of the mechanisms of SFTSV pathogenesis.
-
According to the clinical guidelines on SFTS released by the Ministry of Health of the People's Republic of China in 2010, SFTSV-infected patients were enrolled in our study between May 2016 and September 2016. Individuals who had concurrent hepatitis C virus, hepatitis B virus, or human immunodeficiency virus (HIV)-1 infection; who were positive for Epstein-Barr virus or who met the clinical or biological criteria for bacterial or fungal infection were excluded. All 29 patients (including 2 deceased patients) were admitted to the hospital by approximately days 3–10 after disease onset. To conduct a retrospective analysis, detailed patient data (including their clinical history, physical examination findings, and routine haematological laboratory results) were extracted from the medical records. The basic clinical and laboratory characteristics of the patients with mild and severe cases of SFTSV infection at admission are listed in Table 1.
Characteristics ALL cases (N = 29) Mild (N = 15) Severe (N = 14, including 2 deceased patients) P value Age, years 58 (35-74) 54 (35-70) 61 (40-74) 0.02b Male, sex, n (%) 15(51.7) 9 (60) 6 (42.8) 0.85c Days of hospitalization, days 8 (3-21) 6(4-10) 11 (3-21) 0.003d Duration of fever, days 6 (3-10) 6 (3-8) 6 (3-10) 0.67d Plasma RNA, Log10 3.48 (1.13-6.95) 2.22 (1.13-5.61) 4.14 (2.03-6.95) 0.02d Platelet count, 109/L 48 (11-82) 50 (21-78) 49.5 (11-82) 0.69b Monocyte count, 109/L 0.21 (0.01-1.44) 0.21 (0.01-1.94) 0.19 (0.01-1.44) 0.95b Lymphocyte count, 109/L 0.68 (0.21-2.31) 0.74 (0.31-2.31) 0.70 (0.21-1.96) 0.73b Leukocyte count, 109/L 2.75 (0.75-12.63) 2.75 (0.75-5.9) 5.8 (0.95-12.63) 0.07b aData are presented as the median (range) unless otherwise specified
bAccording to a t test
cAccording to Pearson's Chi square test
dAccording to the Mann–Whitney U-testTable 1. Differences in clinical and laboratory characteristics between patients with mild and severe cases of SFTSV infection.
-
After admission to the hospital, all patients with SFTSV infection received standard treatments based on the SFTS treatment guidelines of the Chinese Ministry of Health. We collected blood samples from patients at regular intervals (within 24 h of admission, every three days thereafter and on the day before discharge). The healthy controls consisted of fifteen SFTSV-uninfected blood donors who had no underlying diseases and were matched with the infected patients by sex, age and ethnic background, from whom blood samples were collected at the time of enrolment. Each sample was processed within 4 h after collection. Peripheral blood mononuclear cells (PBMCs) were separated via density gradient centrifugation with Ficoll-Paque Plus (DAKEW Biotech, China) following the manufacturer's instructions.
-
A total of 2 × 10⁵ PBMCs were collected in tubes and surface-stained with APC-Cy7-labelled CD3 (300318, BioLegend, USA), PE-labelled CD56 (304605, BioLegend) or APC-labelled CD56 (362504, BioLegend), APC-labelled CD16 (302012, BioLegend) or PE-Cy7-labelled CD16 (302016, BioLegend), PE-labelled NKG2D (320806, BioLegend), FITC-labelled NKG2A (130-098-818, Miltenyi Biotec), PE-labelled CD107a (328608, BioLegend) antibodies and eFluor 506-labelled Fixable Viability Dye (65-0866-18, eBioscience, USA) at 4 ℃ for 30 min. To measure intracellular cytokines or intranuclear cytokines, cells were permeabilized with Cytofix/Cytoperm (BD, USA), followed by intracellular staining with FITC-labelled IFN-γ (11-7319-82, eBioscience) and granzyme B (372206, BioLegend) antibodies and intranuclear staining with a PE-labelled Ki-67 antibody (350504, BioLegend). Subsequently, the samples were resuspended in 200 μL of PBS before being run in a FACSCalibur flow cytometer (BD Biosciences). Approximately 5 × 10⁴–1.0 × 10⁵ events per tube were acquired via flow cytometry to determine the phenotype of the circulating NK cells, and analyses were performed with FlowJo software (Tree Star, Ashland, OR, USA).
-
PBMCs at a concentration of 106 cells/mL were incubated overnight in complete medium at 37 ℃ and 5% CO2. The following day, NK cell effector functions were determined by mixing 0.4 × 10⁶ PBMCs with target cells at a ratio of 10:1 in V-bottom 96-well plates in a final volume of 200 μL. The suspensions were incubated for 5.5 h at 37 ℃ in 5% CO2. To measure the intracellular cytokine IFN-γ, PBMCs were stimulated with PMA (50 ng/mL; Sigma-Aldrich, USA) and ionomycin (1 μg/mL; Sigma-Aldrich). To analyse degranulation (CD107a), PBMCs were collected in tubes without either PMA or ionomycin stimulation. Brefeldin A (00-4506-51, eBioscience) was added at a dilution of 1:1000 following 2 h of co-culturing, after which the expression of CD107a and IFN-γ in CD56dim NK cells was evaluated as previously described (Bryceson et al. 2010).
-
Total RNA from all clinical patient serum samples was extracted using a viral RNA purification kit, and the viral load of SFTSV RNA copies was determined using a certified real-time PCR kit for the clinical diagnosis of SFTS patients, according to the manufacturer's instructions (SFDA Registration No. 340166, China) (Sun et al. 2012b; Peng et al. 2016; Zhang et al. 2017). This kit targets the small segment of SFTSV with 98.6% sensitivity and 99.1% specificity.
-
Our group (Xiong et al. 2016) found that the SFTSI of patients at the time of admission (where SFTSI = 5×neurological symptom level + 4×respiratory symptom level + 3×LG10 viral load -2 × LN monocyte %-7) can be used to assess disease severity. In this study, we further showed that patients with an SFTSI greater than 16 were much more likely to die. In the current study, we therefore defined patients with an SFTSI > 16 as "severe" and patients with an SFTSI < 16 as "mild".
-
Statistical analyses were performed with SPSS software, version 17.0 (SPSS Inc., Chicago, IL, USA), and GraphPad Prism software, version 7.03 (GraphPad Software Inc., San Diego, CA, USA). The median (range), mean ± SD or median ± 95% confidence interval (CI) was used to summarize continuous variables, and absolute values and percentages were used to report dichotomous variables. For the comparison of two or more independent groups, normally distributed data were compared using the two-tailed unpaired t test or multiple t tests; otherwise, the two-tailed Mann–Whitney U test was used. For the comparison of two paired samples, the two-tailed paired t test was applied. Categorical variables in the table were analysed using Pearson's Chi square test. Correlation analysis of two variables was conducted using Pearson's test. For all of the tests, two-tailed P-values of less than 0.05 (95% CI) were considered statistically significant.
Patients
Sample Collection and Processing
Flow Cytometry
NK Cell Functional Assays
SFTS Viral Load Assay
SFTS Severity Evaluation
Statistical Analysis
-
A total of 29 hospitalized patients (including 15 with mild and 14 with severe disease) were enrolled in this study. The detailed characteristics of the patients are shown in Table 1. According to the demographic data, there was no sex bias between the patients with mild disease and those with severe disease (P = 0.85, Table 1). The median age of the severe patients was greater than that of the mild patients (P = 0.02, Table 1). Additionally, because of the severe illness the days of hospitalization of severe patients were longer than the mild patients (P = 0.003, Table 1). Furthermore, the patients with severe SFTS showed higher viral loads than the patients with mild SFTS (P = 0.02, Table 1). However, the number of days after symptom onset and the total platelet, monocyte, lymphocyte and leukocyte counts showed no significant differences between the mild SFTS patients and the severe SFTS patients at the time of admission.
-
In the present study, we analysed total NK cells via flow cytometry in 29 patients with SFTS (including 15 with mild disease and 14 with severe disease) at various phases of infection. Our data showed that the percentage and number of total NK cells were significantly lower in the patients with either mild or severe disease at admission than in the healthy controls (left panels of Fig. 1B and 2A, P < 0.05 for all comparisons). Furthermore, the percentage of total NK cells was significantly lower in the patientswith severe disease than in the patients with mild disease (left panel of Fig. 1B, P < 0.05). Additionally, the dynamic data showed that the percentage of total NK cells in the patients with severe disease was lower by day 7 after disease onset compared with that in the patients with mild disease, but it returned to normal levels by day 16 in all SFTS patients (right panel of Fig. 1B). In the patients with either mild or severe disease, the absolute number of total NK cells was lower during the early stage of infection but returned to normal levels by day 16 (right panel of Fig. 2A).

Figure 1. Decreases in the percentage of CD56brightCD16- and CD56dimCD16+ NK cells during the acute phase of SFTSV infection in humans A Definitions of CD56brightCD16- (ⅰ), CD56brightCD16+ (ⅱ), CD56dimCD16- (ⅲ), CD56dimCD16+ (ⅳ) and CD56-CD16+ (ⅴ) NK cells by flow cytometry from one representative participant. B Mean frequency of NK cells of total PBMCs from the healthy controls (n = 15) and the patients with mild (n = 15) and severe (n = 14) SFTS upon admission (left panels of B) and at different time intervals during their entire hospital stay (right panels of B). The dashed line represents the median of the healthy controls. C and D Mean frequency of NK cell subsets out of total PBMCs from the healthy controls (n = 15) and the patients with mild (n = 15) and severe (n = 14) SFTS upon admission (C) and at different time intervals during their entire hospital stay (D). The dashed line represents the median of the healthy controls. Data are shown as the median ± 95% CI. Statistical analysis was performed using the Mann–Whitney U test. The level of significance is indicated as follows: ns, not significant; *P < 0.05; **P < 0.01; ***P < 0.001

Figure 2. Decreases in the absolute number of CD56brightCD16- and CD56dimCD16+ NK cells during the acute phase of SFTSV infection in humans A Absolute numbers of total NK cells in the healthy controls (n = 15) and the patients with mild (n = 15) and severe (n = 14) SFTS upon admission (left panels of A) and at different time intervals during their entire hospital stay (right panels of A). The dashed line represents the median of the healthy controls. B and C Absolute numbers of different NK cell subsets in the healthy controls (n = 15) and the patients with mild (n = 15) and severe (n = 14) SFTS upon admission (B) and at different time intervals during their entire hospital stay (C). The dashed line represents the median of the healthy controls. Data are shown as the median ± 95% CI. Statistical analysis was performed using the Mann–Whitney U test. The level of significance is indicated as follows: ns, not significant; *P < 0.05; **P < 0.01; ***P < 0.001; ****P < 0.0001
As a previous study suggested (Poli et al. 2009), we defined five NK cell subsets (including the CD3-CD56highCD16-, CD3-CD56highCD16+, CD3-CD56dimCD16-, CD3-CD56dimCD16+ and CD3-CD56-CD16+ NK cell subpopulations) on the basis of the relative expression of the markers CD16 and CD56 in human peripheral blood. Based on the above findings, we further analysed the changes in the NK cell subsets in all 29 SFTS patients. We then evaluated the correlations of the NK cell subsets with SFTSI at admission via linear regression analyses. Compared with the healthy controls, the patients with mild or severe disease at admission displayed a significantly decreased percentage and number of CD56dimCD16+ NK cells (Fig. 1C and 2B, P < 0.05 for all comparisons). Additionally, the percentage and number of CD56brightCD16- and CD56dimCD16+ NK cells were significantly decreased in the severe patients compared with the mild patients (Figs. 1C and 2B, P < 0.05 for all comparisons). However, the percentages and numbers of CD56brightCD16+, CD56dimCD16- and CD56-CD16+- NK cells showed no significant difference between the SFTS patients and the healthy controls (Fig. 1C and 2B, P > 0.05 for all comparisons). These data suggest that the loss of CD56brightCD16- and CD56dimCD16+ NK cells could be the major cause of NK cell deficiency in patients with severe disease at the time of admission.
The dynamic data showed that the percentage and number of CD56brightCD16- and CD56dimCD16+ NK cells were significantly lower in patients with severe disease than in patients with mild disease by days 4–7 after disease onset. Additionally, the percentage and number of CD56dimCD16+ NK cells did not completely return to normal levels more than 16 days after disease onset (Figs. 1D and 2C).
Linear regression analyses showed that the percentage and number of CD56dimCD16+ NK cells were negatively correlated with the SFTSI (Supplementary Fig. S1D, r = - 0.50, P = 0.006 for the percentage of cells; r = - 0.42, P = 0.02 for the number of cells). In addition, the percentage of CD56dimCD16+ NK cells were negatively correlated with the viral loads (Supplementary Fig. S2D, r = - 0.38, P = 0.041 for the percentage of cells; r = - 0.33, P = 0.08 for the number of cells). However, there was no significant correlation of the SFTSI with the percentages or numbers of CD56brightCD16-, CD56brightCD16+, CD56dimCD16- and CD56-CD16+ NK cells (Supplementary Figs. S1A, S1B, S1C and S1E).
-
To determine the changes in the proliferation and activation of CD56dimCD16+ NK cells, we evaluated the expression of Ki-67, NKG2D, NKG2A and granzyme B in the CD56dimCD16+ NK cell population via flow cytometry in 18 SFTS patients (including 9 with mild disease and 9 with severe disease) at various stages of infection. As shown in Fig. 3B and 3C, the percentage and number of CD56dimCD16+ Ki-67+ NK cells were significantly higher in patients with mild or severe disease than in the healthy controls (P < 0.0001 for all comparisons). Additionally, the dynamic data showed that both the percentage and number of CD56dimCD16+ Ki-67+ NK cells continuously increased, showing a peak at days 8–10 and a decline thereafter; however, the levels of these cells did not return to normal by day 16 after symptom onset. Furthermore, there was no significant difference in the percentage or number of CD56dimCD16+ Ki-67+ NK cells between the patients with mild disease and those with severe disease.
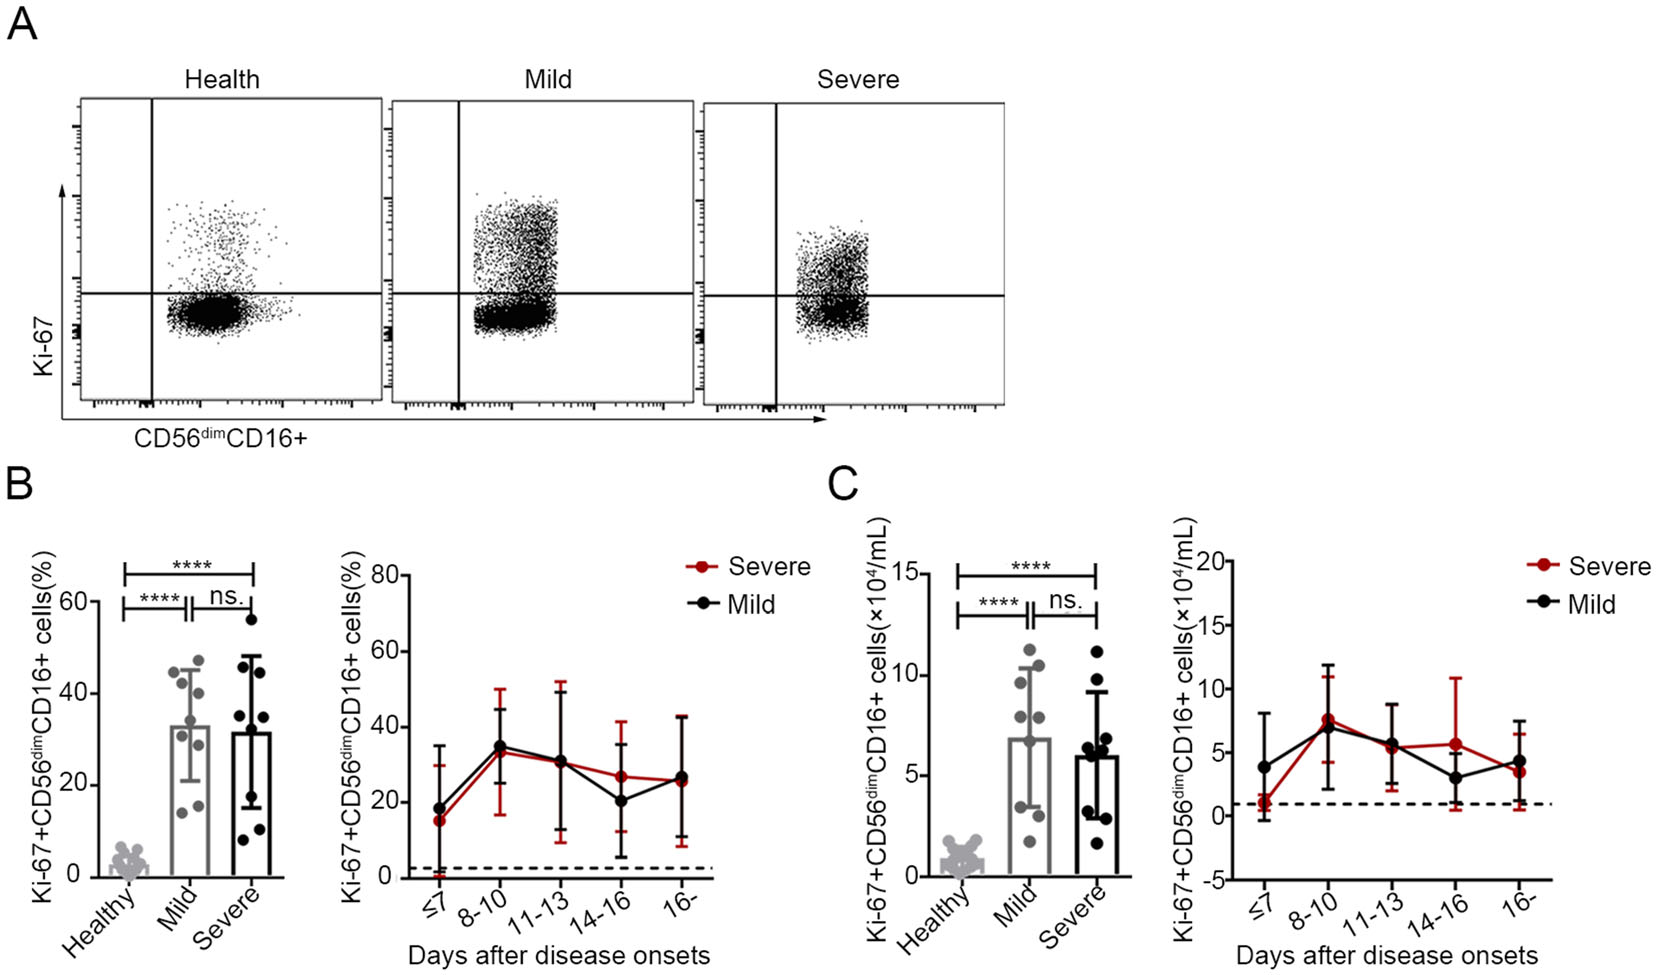
Figure 3. Increased proliferation of CD56dimCD16+ NK cells in patients with SFTS A. The expression levels of Ki-67 in CD56dimCD16+ NK cells were analysed via flow cytometry in one representative healthy control, one representative patient with mild disease and one representative patient with severe disease. B and C Percentage and number of CD56dimCD16+ Ki-67+ NK cells in the healthy controls (n = 15) and in the patients with mild (n = 9) or severe (n = 9) SFTS upon admission (left panels of B and C) and at different time points during their entire hospital stay (right panels of B and C). The dashed line represents the mean of the healthy controls. Data are shown as the mean ± SD. Statistical analysis was performed using the two-tailed unpaired t test or multiple t tests. The level of significance is indicated as follows: ns, not significant; ****P < 0.0001
The expression of the inhibitory NK cell receptor NKG2A in CD56dimCD16+ NK cells was lower in patients with severe disease upon admission than in the healthy controls (left panel of Fig. 4B, P < 0.05). Additionally, no marked changes in the expression of the activating NK cell receptor, NKG2D, in CD56dimCD16+ NK cells were observed in SFTS patients upon admission compared with the healthy controls (left panel of Fig. 4D, P > 0.05 for both comparisons). However, the expression of NKG2A in CD56dimCD16+ NK cells was relatively lower in patients with severe SFTS during the entire course of infection but returned to normal levels approximately 16 days after disease onset (Fig. 4B, right).
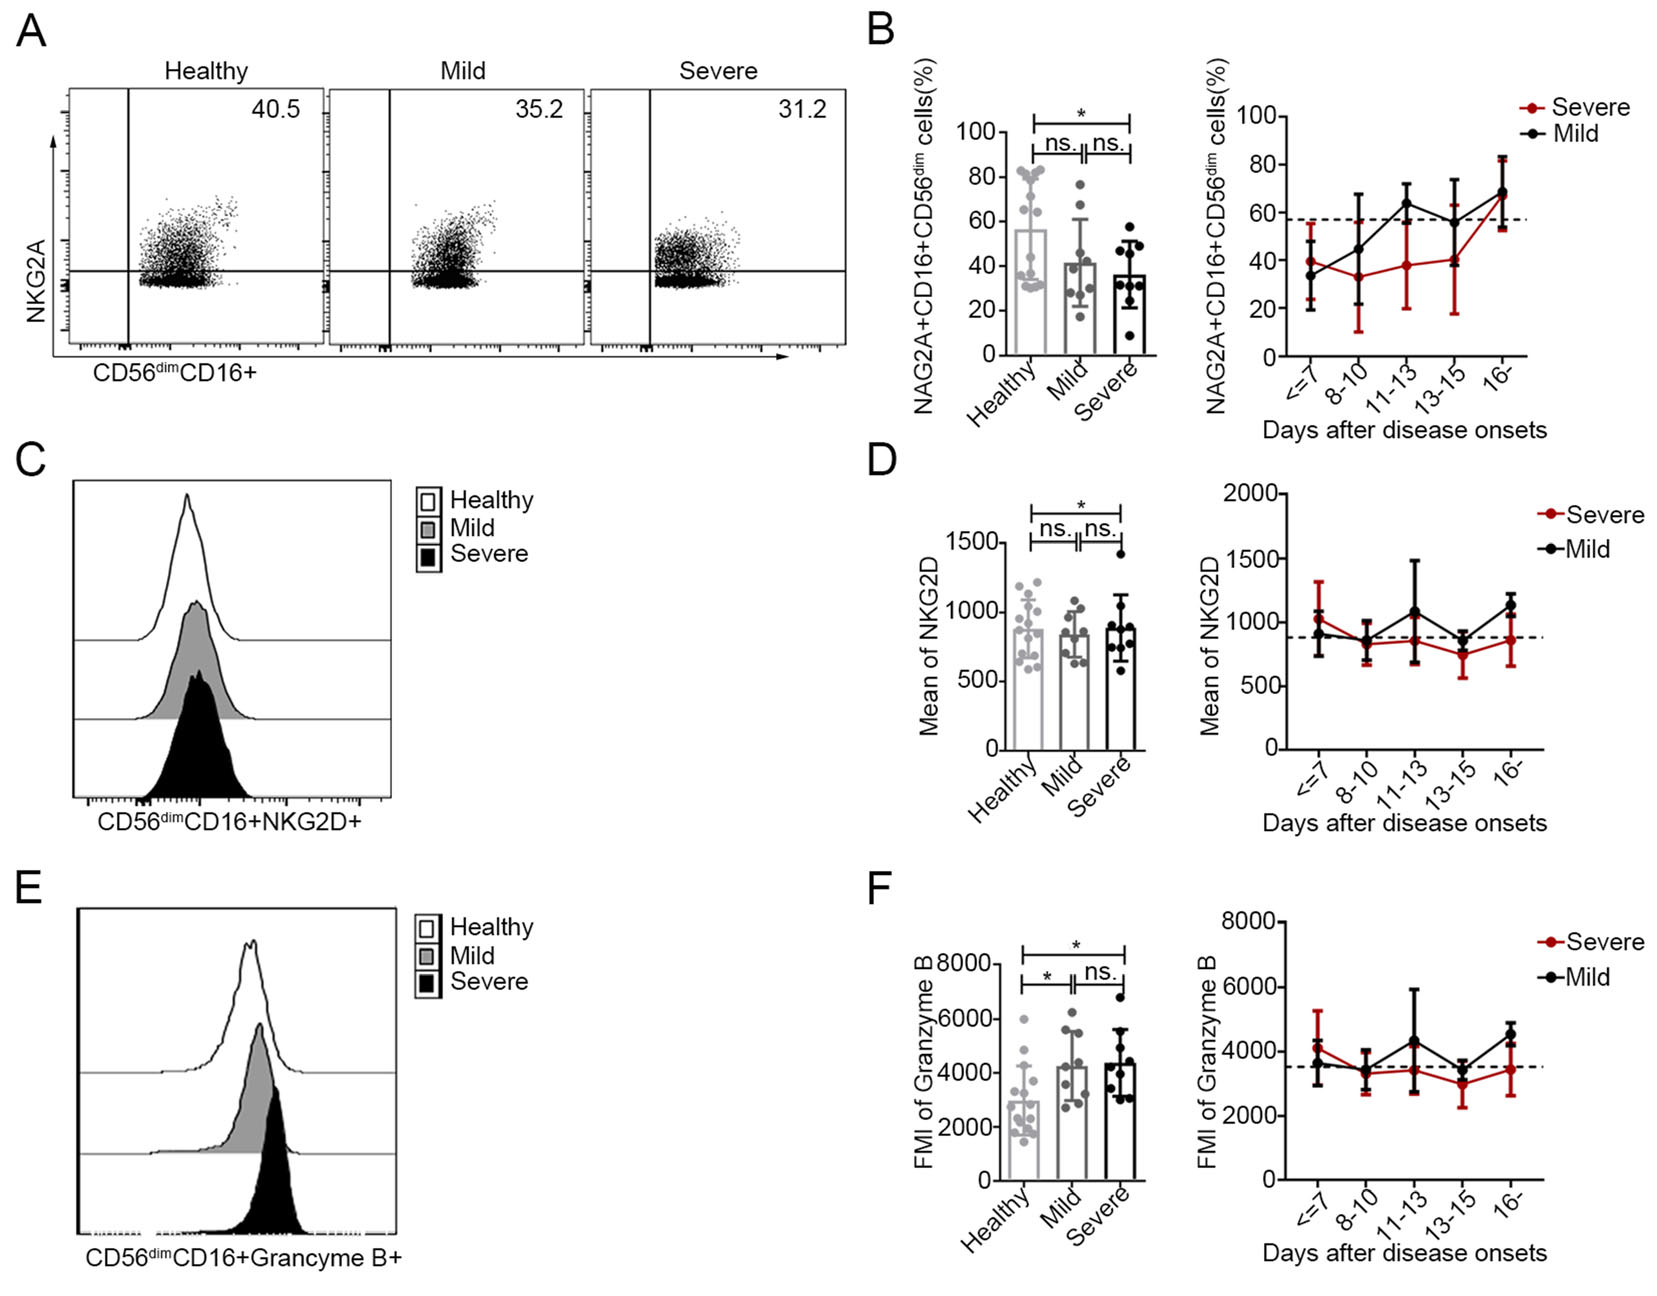
Figure 4. Increased activation of CD56dimCD16+ NK cells in patients with SFTS A, C and E The expression levels of NKG2A (A), NKG2D (C) and granzyme B (E) in CD56dimCD16+ NK cells were analysed by flow cytometry in one representative healthy control, one representative patient with mild disease and one representative patient with severe disease. B, D and F Expression levels of NKG2A, KNG2D and granzyme B in CD56dimCD16+ NK cells in the healthy controls (n = 15) and in patients with mild (n = 9) and severe (n = 9) SFTS upon admission (left panels of B, D and F) at different time points during their entire hospital stay (right panels of B, D and f). The dashed line represents the mean of the healthy controls. Data are shown as the mean ± SD. Statistical analysis was performed using the two-tailed unpaired t test or multiple t tests. The level of significance is indicated as follows: ns, not significant; *P < 0.05
As shown in Fig. 4F, the intracellular levels of the cytotoxic effector molecule granzyme B in the CD56dimCD16+ NK cell population were higher in patients with mild or severe SFTS at admission than those in the corresponding population of healthy controls (P < 0.05 for both comparisons). However, the levels of granzyme B in CD56dimCD16+ NK cells returned to normal values approximately 14–16 days after disease onset. Additionally, there was no significant difference in the expression of CD56dimCD16+ granzyme B+ NK cells between the patients with mild disease and those with severe disease.
-
We further evaluated the degranulation (CD107a) and IFN-γ responses to K562 cells in the acute and recovery phases of 9 patients with severe SFTS. As shown in Fig. 5, CD56dim NK cells showed significantly increased degranulation (CD107a) towards K562 cells during the acute phase compared to that in the recovery phase (Fig. 5B, P < 0.05). Nevertheless, although the IFN-γ response to K562 cells was greater during the acute phase than that during the recovery phase, the difference was not significant (Fig. 5C, P > 0.05). In addition, CD56bright NK cells showed a significantly higher IFN-γ response to K562 cells during the acute phase than during the recovery phase (Supplementary Fig. S3B, P < 0.05).
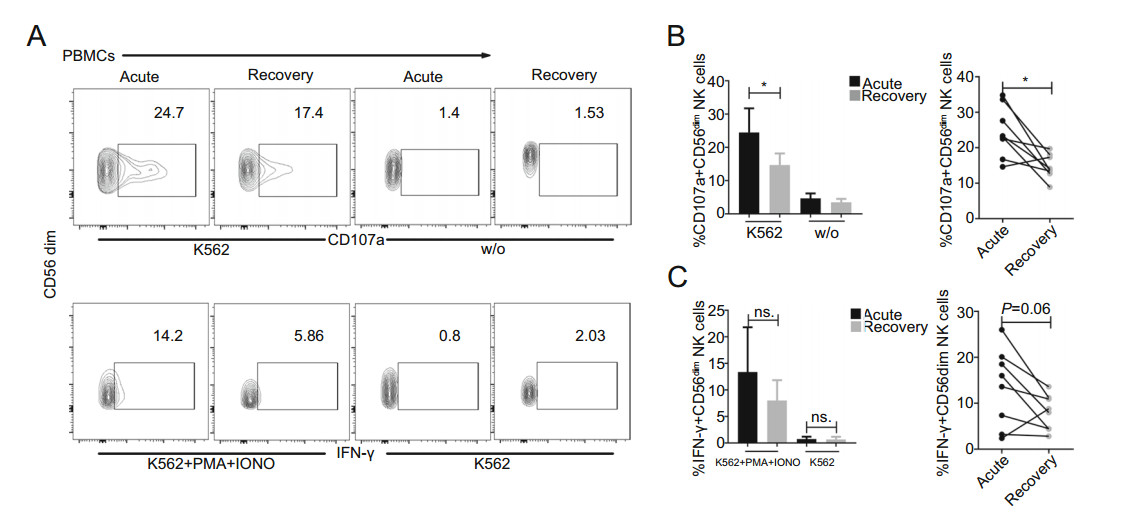
Figure 5. Increased effector function of CD56dim NK cells during the acute phase in SFTS patients A Representative FACS analysis of CD107a and IFN-γ expression in one severe patient is shown. B and C Summary of the CD56dim NK cell responses to K562 cells in 9 patients with severe SFTS during the acute phase (blank) and recovery phase (grey). Data are shown as the mean ± SD. Statistical analysis was performed using the two-tailed unpaired t test or paired t test. The level of significance is indicated as follows: ns, not significant; *P < 0.05
In the present study, the principal cytokines involved in NK cell activation and function (including IL-15, IFN-α, IL-18 and IFN-γ) were measured in all 29 SFTS patients (including 14 with mild disease and 15 with severe disease). As shown in Fig. 6, the serum levels of IL-15, IFN-α, IL-18 and IFN-γ were significantly higher in patients with mild or severe disease upon admission than in the healthy controls (P < 0.05 for all comparisons). Additionally, the level of IL-18, but not of IL-15, IFN-α and IFN-γ, was significantly higher in patients with severe disease upon admission than in patients with mild disease upon admission (Fig. 6, P < 0.01). The dynamic data showed that the levels of IL-15, IFN-α, and IFN-γ decreased to nearly normal values by days 8–10 after disease onset. However, the serum levels of IL-18 were highest on days 8–10 and did not return to normal levels more than 16 days after disease onset. Moreover, the level of IL-18, but not of IL-15, IFN-α and IFN-γ, was positively correlated with the severity of SFTS (Supplementary Fig. S4C, r = 0.49, P = 0.008). Simultaneously, the serum levels of IL-15, IFN-α, IL-18 and IFN-γ were significantly higher in the SFTS patients during the acute phase than during the recovery phase (P < 0.0001 for IL-15; P < 0.001 for IFN-α and IFN-γ; P < 0.05 for IL-18).
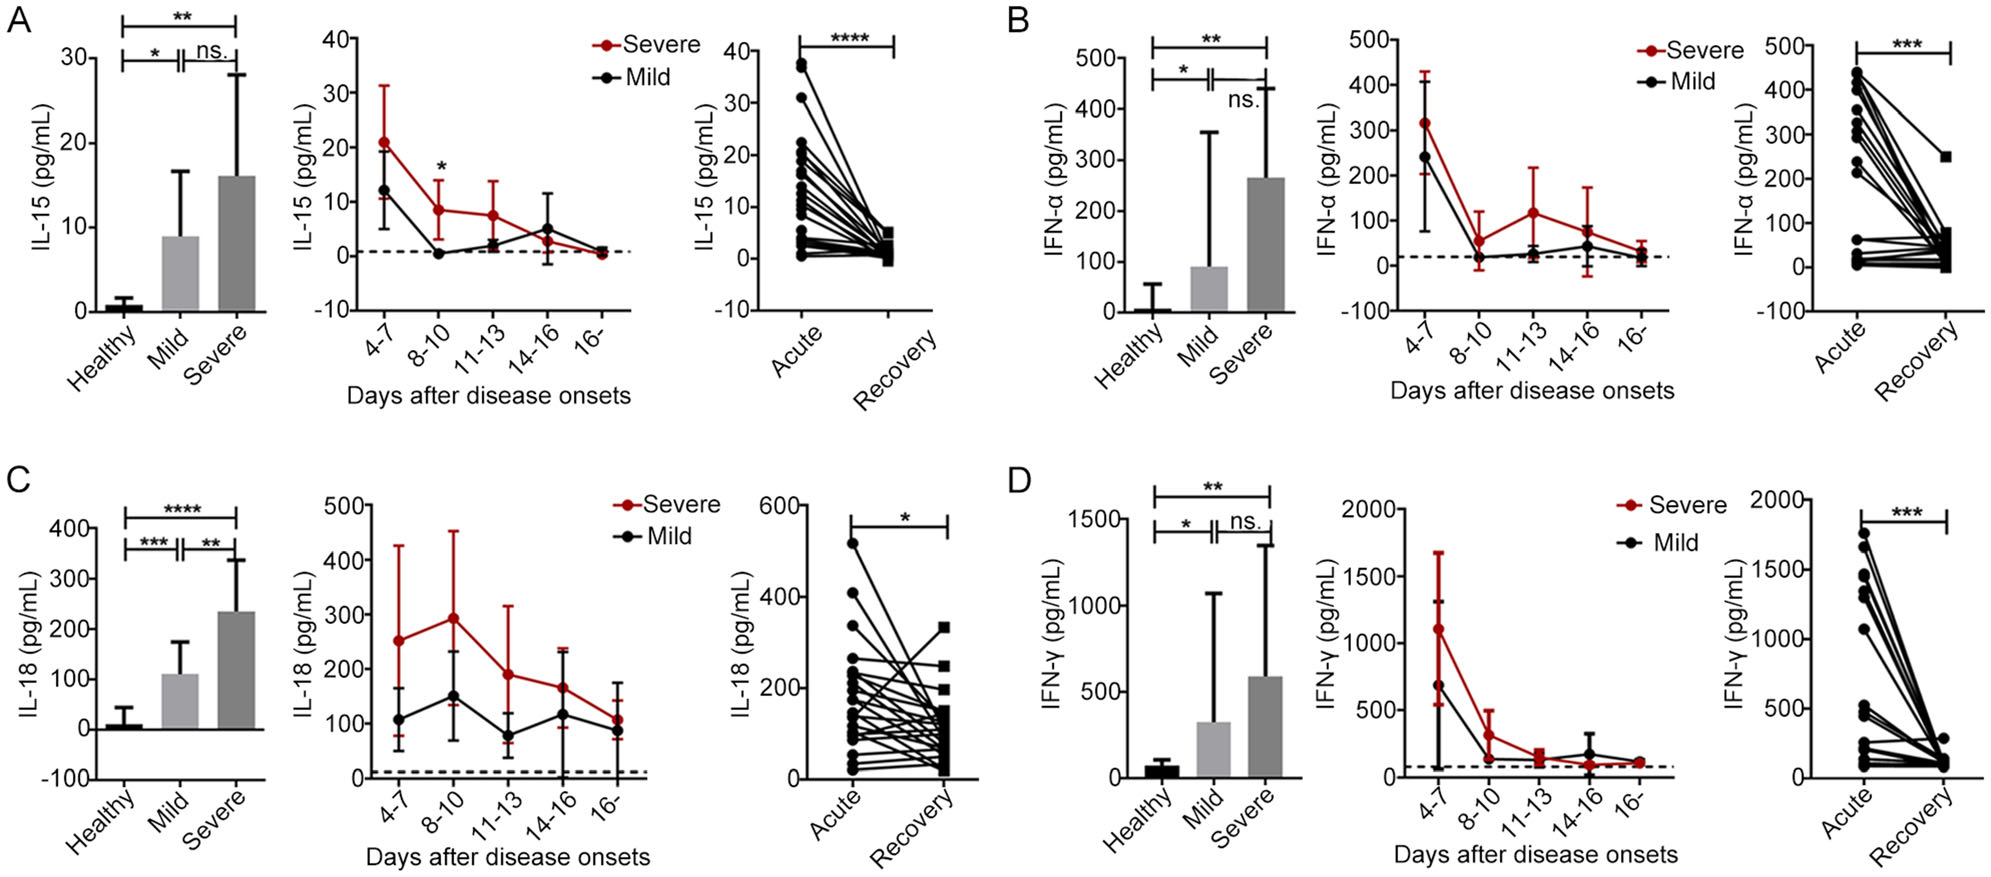
Figure 6. The levels of principal cytokines involved in NK cell activation and function were increased during the early stage of SFTSV infection A, B, C and D. The plasma cytokine levels of IL-15, IFN-α, IL-18 and IFN-γ were evaluated in the healthy controls (n = 15) and in the patients with mild (n = 15) or severe (n = 14) SFTS upon admission (left panels of A, B, C and D) and at different time points during their entire hospital stays (middle panels of A, B, C and D). Data are shown as the mean ± SD. The dashed line represents the mean of the healthy controls. Right panels of A, B, C and D. The plasma cytokine levels of IL-15, IFN-α, IL-18 and IFN-γ were evaluated during the acute and recovery phases in all 29 patients. Statistical analysis was performed using the two-tailed unpaired t test, multiple t tests or paired t test. The level of significance is indicated as follows: ns, not significant; *P < 0.05; **P < 0.01; ***P < 0.001; ****P < 0.0001
Characterization of Patients with Mild and Severe SFTS Disease at Admission
Decreases in the Percentage and Number of CD56dimCD16+ NK cells Were Associated with Increased SFTS Severity
Increased Proliferation and Activation of CD56dimCD16+ NK Cells in SFTS Patients
Increased Effector Function of CD56dim NK Cells during the Acute Phase of SFTS
-
NK cells are effector cells of the innate immune system that specialize in recognizing and destroying virus-infected cells during the early phase of infections. In this study, we extensively characterized the changes in five NK cell subsets and evaluated the phenotypic and functional characteristics of CD56dimCD16+ NK cells in SFTS patients. Our data indicated that a decreased frequency of CD56dimCD16+ NK cells was associated with an increased SFTS severity. In addition, higher levels of Ki-67 and granzyme B expression and lower levels of NKG2A expression in CD56dimCD16+ NK cells as well as increased effector function of CD56dim NK cells were observed during the acute phase in SFTS patients.
Consistent with previous studies (Sun et al. 2014; Weng et al. 2014; Lu et al. 2015), NK cell deficiency was commonly observed during the early course of SFTSV infection, especially in patients with severe disease. Moreover, massive loss of NK cells has been observed in vivo during Ebola and influenza viral infections (Bradfute et al. 2007; Mao et al. 2009; Jost et al. 2011; Cimini et al. 2017). NK cells are known to participate in the innate immune response and interact with both innate and adaptive immune cells in order to coordinate appropriate antiviral responses (Lam and Lanier 2017). Furthermore, nearly 90% of peripheral NK cells are CD56dimCD16+ NK cells, which are involved in the recognition and lysis of antibodycoated cells (Fu et al. 2014). Depletion of CD56dimCD16+ NK cells in SFTS patients might affect the direct antiviral functions of the cells in regulating immunopathology and mediating the cytotoxic killing of virus-infected cells. Previous studies have indicated that reduced numbers of NK cells in the peripheral blood of patients with viral infections might reflect the homing of these cells to other tissues, as suggested for acute influenza virus and acute dengue infections (Jost et al. 2011; Keawvichit et al. 2018). Alternatively, increased apoptosis and activation-induced cell death might explain the observed decrease in circulating NK cells (Geisbert et al. 2003; Bradfute et al. 2007; Mao et al. 2009). However, elucidating the potential factors leading to the depletion of NK cells in SFTS patients requires further investigation.
The increased expression of Ki-67 in CD56dimCD16+- NK cells in SFTS patients suggests that the gradually increased number of CD56dimCD16+ NK cells is a direct consequence of induced proliferation. Our results were similar to those of another study on hantavirus infection (Bjorkstrom et al. 2011), which reported that the proportion of Ki-67-expressing CD56dim NK cells was increased during the entire course of infection. Additionally, the intracellular level of the cytotoxic effector molecule granzyme B in the CD56dimCD16+ NK cell subset was found to be elevated during the acute phase in SFTS patients, similar to observations made for other acute viral infections, such as hantavirus and acute dengue virus infections (Amadei et al. 2010; Braun et al. 2014). NK cells are predominantly under inhibitory control, which maintains self-tolerance. However, this self-tolerant state can be overcome by receptor- or cytokine-mediated stimulation. NK cell activation depends on either loss of inhibitory NK cell receptors (e.g., NKG2A/CD94 signals) or the expression of stress-induced or virally induced ligands to activate NK cell receptors (e.g., NKG2D) (Bryceson and Long 2008; Lanier 2008). Signals derived from excitatory and inhibitory receptors are integrated by NK cells to ultimately determine their functional outcome. In contrast to other reports on hantavirus viral infection (Bjorkstrom et al. 2011; Braun et al. 2014), we found no significant change in NKG2D expression between the healthy controls and the SFTS patients. It is possible that other activating receptors (e.g., DNAM-1, CD161, and 2B4) are involved in activating NK cells in SFTS patients. Furthermore, compared with the expression observed in healthy controls, the relatively lower expression of NKG2A in SFTS patients could be beneficial for activating CD56dimCD16+ NK cells. Previous studies have suggested that chronic HCV infection is associated with an increased number of NK cells bearing the inhibitory receptor CD94/NKG2A, a feature that has been proposed to result in NK cell dysfunction and impaired DC activation, which could potentially lead to viral persistence (Nattermann et al. 2006). Relatively lower NKG2A expression in SFTS patients might contribute to the activation or functional enhancement of CD56dimCD16+ NK cells and might therefore be beneficial to viral clearance.
Additionally, the higher degranulation and IFN-γ response of CD56dim NK cells to K562 cells during the acute phase suggested increased effector function of CD56dim NK cells during the early stage of SFTSV infection. Our data further showed that an increased level of IL-18 was associated with increased SFTS severity. Although the levels of IL-15, IFN-α and IFN-γ were found to be higher in SFTS patients in the acute phase than in the healthy controls, the small number of deceased SFTS patients may have resulted in the lack of a significant difference between the severe patients and mild patients. Type Ⅰ interferons (e.g., IFN-α/β), IL-15 and IL-18 are the principal cytokines involved in NK cell activation (Wu et al. 2017). IL-18 plays an important role in promoting the production of IFN-γ by NK cells to fight viral, fungal, bacterial, and parasitic infections (Haeberlein et al. 2010; Wu et al. 2017). Additionally, the presentation of IL-15/IL-15Ra to NK cells is essential for NK cell development, differentiation and survival, and it stimulates NK cell effector functions (Huntington et al. 2009; Strowig et al. 2010). Moreover, an association between IL-15 serum levels and NK cell activation has been reported for other infectious diseases, such as hantavirus infection (Bjorkstrom et al. 2011; Braun et al. 2014). Increased serum levels of IL-15, IL-18, IFN-α and IFN-γ could contribute to NK cell development, activation and function and might stimulate NK cell effector functions in SFTS patients. Together, the activation and functional enhancement of CD56dimCD16+ NK cells suggested their involvement in a complex network mediating the protective response against early SFTSV infection.
The results of the present study highlight a significant correlation of SFTS severity with the prevalence of NK cell subsets. Additionally, our data provide further insights into the proliferation, activation and effector functions of CD56dimCD16+ NK cells in SFTS patients. However, the molecular mechanisms by which NK cells recognize SFTSV-infected cells require further investigation. Finally, a further understanding of receptor-ligand interactions could represent a basis for the development of potentially targeted interventions to harness the antiviral activity of human NK cells.
-
We thank all of the donors and patients for participating in this research. This study was supported by the National Natural Science Foundation of China (81271884) and of Hubei (2018CFB471). The funding source played no role in the study design, data collection and analysis, decision to publish, or preparation of the manuscript.
-
ML, YX, CP and XZ conceived and designed the experiments. ML, YX, MYL and WZ performed the experiments. ML and YX analyzed the data. ML and YX wrote the manuscript and prepared the Figures. YZ, SX, CZ and BL provided resources. JL, ML, and DY provided helpful suggestion about the study. CP and XZ checked and finalized the manuscript. All authors read and approved the final manuscript.
-
The authors declare that they have no conflicts of interest.
-
The research protocol was approved by the Ethics Committee of Tongji Medical College of Huazhong University of Science and Technology. Written informed consent was obtained from all participants prior to blood collection.


 DownLoad: