


HTML
-
The extensive roll-out of combination antiretroviral therapy (cART) sharply decreased the global burden of disease for human immunodeficiency virus (HIV) infections and acquired immunodeficiency syndrome (AIDS). However, increased cART availability does not always result in complete immunological recovery and can contribute to the onset of systemic immune activation (Prab-hakar et al. 2011). The latter may occur due to CD4 T cell depletion from gut mucosa with subsequent microbial translocation and also the presence of chronic co-infections such as cytomegalovirus and/or the Epstein-Barr virus (Brenchley and Douek 2008). There is a close link between systemic immune activation and HIV-related disease progression (Valverde-Villegas et al. 2015; Nou et al. 2016) such as the development of cardiovascular diseases (CVD) (Kuller et al. 2008). Here, our recent work demonstrated a unique link between immune activation and lipid subclass alterations that helps to explain the increased risk for HIV-mediated CVD onset (Teer et al. 2019).
During immune activation, regulatory T (Treg) cells maintain tolerance by suppressing effector T (Teff) cell functioning and thereby ensure an appropriate response to HIV infections (Grzanka et al. 2013). The conventional Treg cell subset (CD4+CD25+FOXP3+) usually comprises less than 10% of circulating CD4 T cells and can be characterized by co-expression of an interleukin-2 (IL-2) receptor-alpha chain (CD25+) (Furtado et al. 2002; Grzanka et al. 2013) and the transcription factor, forkhead box protein P3 (FOXP3). The expansion of "unconventional" Treg cells (CD4+CD25-FOXP3+) can also occur in a number of infectious diseases (Horwitz 2010). Others demonstrated that FOXP3+ CD25- CD4 T cells constitute a reservoir of committed regulatory cells that regain CD25 expression upon homeostatic expansion, although it remains unclear whether they are able to maintain their suppressive function (Zelenay et al. 2005). For example, Fan et al. (2018) found defects in Treg glycolytic metabolism and suppressor function following CD25 deletion in transgenic mice. Unlike developing Treg cells where the primary role of IL-2 is to initiate FOXP3 expression, mature Tregs require continuous IL-2 signalling to maintain survival and suppressor function (Fan et al. 2018). In addition to performing an important function in the differentiation of thymic Treg cells, FOXP3 also acts as a master regulator of its suppressive function (Fontenot et al. 2003). FOXP3 exerts such effects by targeting the gene promoters of glycoprotein A repetitions predominant (GARP) and the special AT-rich sequence binding protein 1 (SATB1) (Probst-Kepper and Buer 2010; Beyer et al. 2011; Metelli et al. 2018).
Treg cells can differentiate in two ways, namely (1) from self-reactive thymic cells that express a T cell receptor with a strong affinity for self-antigens (referred to as natural Tregs); and (2) induced from conventional CD4 cells by prolonged exposure to infectious agents at peripheral sites (referred to as inducible Tregs) (Grzanka et al. 2013; Min 2017). GARP is a transmembrane protein that is selectively expressed by activated Treg cells and plays a key role in the maturation and activation of transforming growth factor-beta (TGF-β) (Stockis et al. 2009; Metelli et al. 2018). Treg cell secretion of biologically active TGF-β together with IL-10 and IL-35 allows for the suppression of non-Tregs such as T helper (Th) cells (Kleinman et al. 2018). TGF-β can also trigger a transcriptional program to induce Th17 cells within a pro-inflammatory context (Wan and Flavell 2007). The transcriptional modulator SATB1 is a genome organizer that regulates chromatin structure and gene expression to ensure induction of Teff cells (Grzanka et al. 2013). In agreement, the upregulation of SATB1 expression in Treg cells resulted in cytokine production by Teff cells (Grzanka et al. 2013). FOXP3 is an upstream modulator of SATB1 and can repress its expression, in line with the suppressive function of Treg cells (Beyer et al. 2011; Grzanka et al. 2013).
Studies found that some HIV-positive individuals can exhibit an accumulation of Treg cells (Moreno-Fernandez et al. 2012; Chevalier and Weiss 2013). This expansion may occur due to a variety of reasons that include T-cell activation, enhanced thymus-derived Treg cell generation, increased Treg survival (in relation to other T cells) or conversion following dendritic cell contact, and/or via a TGF-β/GARP-mediated mechanism (Moreno-Fernandez et al. 2012; Chevalier and Weiss 2013). However, despite this expansion, the exact role of Treg cells in HIV remains unclear as they can trigger both beneficial and detrimental outcomes. Thus, while Treg cells help to suppress the immune system and maintain tolerance during HIV infection, they may also be involved in shaping the HIV reservoir and compromising the HIV-specific immune responses (Kleinman et al. 2018). This can promote viral persistence meaning that Treg cells may indirectly become significant contributors to the immune activation observed with chronic HIV infection (Kleinman et al. 2018). The current study therefore investigated the effects of HIV infection on Treg cells at the Worcester Community Day Center (Western Cape, South Africa). We assessed FOXP3, GARP and SATB1 expression on both CD4+CD25++ and CD4+CD25- Treg cells during different HIV disease progression stages. There was also an evaluation of the impact of persistent immune activation, inflammation and coagulation markers on such cells, together with its effects on IL-10 (downstream Treg pathway modulator).
-
This cross-sectional study investigated Treg cell changes in HIV-positive patients (on cART [n = 34] and treatment naïve [n = 22]) and uninfected controls (n = 12). For the first-line treatment, patients received the following drug regimens: TDF (Tenofovir) + either 3TC (Lamivudine) or FTC (Emtricitabine) + EFV (Efavirenz). However, some patients received NVP (Nevirapine) instead of EFV. For second-line treatment, all patients received Aluvia (Lopi-navir and Ritonavir [LPV/r]) + Lamzid (AZT [Zidovudine] + 3TC). This study formed part of a larger investigation, i.e. the Cape Winelands HAART to HEART Study within Worcester, South Africa. Ethical clearance was obtained from the Human Research Ethics Committee of Stellenbosch University (N12/12/086) and the Department of Health in the Western Cape, South Africa (Reference Number: RP090/2013).
Prior to the study, we informed participants (attending the Worcester Community Day Center) about the various study procedures and subsequently obtained written consent. The inclusion criteria for the study were HIV-positive and HIV-negative persons between the ages of 18 and 55 years. Those co-infected with tuberculosis and pregnant women were excluded. Recruited patients were age-matched and sub-divided into four groups: HIV-negative subjects (Control) (n = 12), HIV-positive naïve treated (n = 22), HIV-positive treated based on CD4 count (CD4 > 500 cells/μL and CD4 < 500 cells/μL) (n = 34) and HIV-treated based on viral load (VL) (VL < 1000 copies/mL and VL > 1000 copies/mL) (n = 34). All participants were recruited from the same community to ensure that they shared similar CVD risk and socioeconomic backgrounds as previously published by us (Teer et al. 2019).
-
A qualified research nurse collected whole blood samples, i.e. three tubes (12 mL in total) for each participant. We sent one tube to the nearby Worcester National Health Laboratory Service (NHLS, South Africa) within 30 min after collection, for CD4 count determination. The remaining tubes, i.e. one EDTA-containing and one red-top (clotted blood), were immediately centrifuged at 500-1000 × g for 10 min. We thereafter isolated plasma and serum fractions using standard methods and stored the samples at -80 ℃ until further laboratory tests were required. Here, the samples were thawed at room temperature for various analyses such as VL and the determination of inflammatory cytokine levels (IL-6, IL-10) and levels of D-dimer, a coagulation marker. We determined CD4 counts and VL as described before by our laboratory (Teer et al. 2019). The nurse also collected an additional 1 mL of blood into an EDTA tube that we transferred into a 15 mL polypropylene tube that contained 9 mL of BD FACS lysing solution (BD Biosciences, San Jose CA) (1:9; lysing solution: distilled water). These samples were stored for later analyses using two flow cytometric panels (immune activation, Tregs).
-
We performed these studies at the Central Analytical Facility (CAF) Fluorescent Imaging and Flow Cytometry Unit at Stellenbosch University. Analyses were undertaken using the BD FACS Aria flow cytometer (BD Biosciences, San Jose CA) and analyzed using FlowJo v10.6.2. (BD Biosciences, San Jose CA). We thereafter exported the data from FlowJo v10.6.2 to an Excel spreadsheet to enable further statistical analyses.
As described, we added 1 mL of blood (in EDTA tube) to 9 mL of BD FACS lysing solution in a 15 mL polypropylene tube (BD Biosciences, San Jose CA). After mixing, we allowed the sample to stand for 10 min and then stored it at -80 ℃ until the time of staining. Here, we thawed the frozen sample at 37 ℃ and then centrifuged it at 400-500 × g for 10 min. The supernatant was decanted and cells washed twice with phosphate-buffered saline (PBS). We then added 100 μL of cells to two separate Falcon tubes (BD Biosciences, San Jose CA), i.e. tube #1 for a CD8 T cell activation marker panel, and tube #2 for a Treg marker panel. The appropriate amount of cell surface and intracellular staining reagents were then added to the respective tubes.
-
We purchased all antibodies from BD Biosciences (San Jose CA). The staining panels for Treg included: APC-H7 mouse anti-human CD3, FITC mouse anti-human CD4, V450 mouse anti-human FOXP3, PE CY7 anti-human CD25, PE mouse anti-human GARP and SATB-1 ALEXA fluor 647 (Teer et al. 2019). The gating strategy is illustrated in Supplementary Fig. S1A (HIV-negative control) and Supplementary Fig. S2A (HIV-positive on treatment), as well as comparing the expression markers between CD25- and CD25++ (Supplementary Figs. S1B, S1C, and S2B, S2C). Lymphocytes were gated using the SSC-A versus FSC-A dot plot. Then a time gate (FSC-A vs. Time) was applied to the lymphocytes to exclude any electronic noise, followed by a singlet gate (FSC-A vs. FSC-H) on the selected time gate population to exclude doublets. Within the singlet population, the CD3+ lymphocytes were gated and CD4+ lymphocytes were then identified from the CD3+ population. CD4+ lymphocytes were evaluated for the variable expression of CD25 (CD25++, CD25+, CD25-), then comparing expression markers (FOXP3, GARP and SATB1) in CD4+CD25- and CD4+CD25++ cells.
After thawing frozen samples at 37 ℃, we centrifuged them at 500 × g for 10 min. We thereafter decanted the supernatant and re-suspended the cell pellet in 2 mL of PBS. The cells were thereafter washed twice and then placed in a Falcon tube (BD Biosciences, San Jose CA). We then added the appropriate antibody panel (titrated) to the respective tubes (CD3, CD4, CD25, GARP) and incubated samples for 30 min at room temperature. The cells were then washed with 2 mL of PBS.
For permeabilization, the FOXP3 buffer set was employed (Human FOXP3 buffer set, BD Biosciences, San Jose CA). The cells were re-suspended in wash buffer and then 0.5 mL of Buffer C (human FOXP3 buffer set, BD Biosciences, San Jose CA) was added to each tube. After vortexing, the samples were incubated for 30 min at room temperature in the dark. Cells were then washed with 2 mL of PBS, followed by centrifugation at 500 × g for 5 min. We thereafter removed the wash buffer and washed the pellet for a second time. Subsequently, optimally titrated concentrations of both V450 mouse anti-human FOXP3 and Alexa Fluor 647 mouse anti-SATB-1 antibodies were added to the cells together with diluted PBS. The cells were incubated for 30 min in the dark at room temperature. After incubation, the cells were washed and re-suspended in 0.3 mL wash buffer and analyzed by flow cytometry within 24-h period.
-
The staining antibody panel included APC-H7 mouse antihuman CD3, BV412 mouse anti-human CD8, APC antihuman CD142 (tissue factor) and PE (anti-CD38) (Teer et al. 2019). The gating strategy for immune activation markers is explained in Supplementary Fig. S3. Thawed samples were centrifuged at 500 × g for 10 min whereafter the supernatant was decanted and the pellet re-suspended in 2 mL of PBS. Cells were washed twice and then placed in a Falcon tube (BD Biosciences, San Jose CA). The appropriate titrated antibody panel was added to the respective tubes (CD3, CD8, CD38, CD142). This was followed by 30 min incubation at room temperature, after which the cells were washed with 2 mL of PBS. We then centrifuged the samples at 500 × g for 5 min, re-suspended them in 0.3 mL of PBS and stored them at 4 ℃ until flow cytometric analysis was performed within 24-h period.
-
Frozen plasma samples were used for the ELISA-based determination of plasma cytokine and coagulation marker levels, including IL-10 (anti-inflammatory marker), IL-6 (inflammatory marker) and D-dimer (marker for coagulation). We used the following commercially available kits: one-step ELISA kits for IL-10 and IL-6 (ElabscienceⓇ Houston TX) and for D-dimer (AbcamⓇ Cambridge, United Kingdom). The preparation of standards and assay procedures were performed according to the manufacturers' instructions. The optical densities were determined at 450 nm using an automated microplate reader. Standard curves were generated on Microsoft Excel, which was then utilized to calculate the concentration in each well.
-
The flow cytometric percentage data were exported to an Excel spreadsheet and statistical analysis was performed using Graph Pad Prism (Version 7, Graph Pad Software, San Diego CA). One-way ANOVA or Kruskal-Wallis analyses were performed and Tukey's or Dunns post-hoc tests, respectively, for comparisons made between four study groups distinguished by CD4 count and VL (Control, naïve, HIV-treated with CD4 count > 500 and HIV-treated with CD4 count < 500), and groups distinguished by VL (Control, naïve treated, HIV-treated with VL > 1000 and HIV-treated with VL < 1000). Correlations between the variables were performed using the Pearson's or Spearman's correlation, and where appropriate using the full data set (all study groups) for all correlation analyses. The statistical significance of results was accepted at P ≤ 0.05 (significant). Data are reported as mean percentage ± standard error of the mean (SEM) for parametric, or as the median and interquartile range for non-parametric data.
Study Population and Design
Blood Collection, CD4 Count and Viral Load
Flow Cytometric Analysis
Regulatory T Cell Panel
Immune Activation Panels
IL-10, IL-6 and D-Dimer Quantification by ELISAs
Statistical Analysis
-
The characteristics of the complete study population have been reported by us before (Teer et al. 2019). However, we summarized participant data for samples here used for Treg marker analyses in Tables 1 and 2. There were no significant differences in age between the study groups based on treatment status. CD4 count and VL were not significantly different between the HIV-positive groups based on cART treatment status.
Control(n = 12) HIV-positive Treatment naïve (n = 22) First-line cART treated (n = 15) Second-line cART treated (n = 18) Age (years) 49 (32–54) 36 (30–42) 37 (31–45) 34 (28–49) Gender (male/female) 5/7 10/12 5/10 2/16 Data presented as medians (interquartile ranges). These data are for specific samples used for Treg marker analyses in this study. Refer to Teer et al. (2019) for the complete sample set. cART: combination antiretroviral therapy.Table 1. Study participant characteristics.
Treatment naïve First line cART treated Second line cART treated CD4 count (cells/μL) 503 (297–677) 337 (192–711) 364 (154–521) Viral load (C/mL) 586 (40–18,855) 582 (20–85,076) 4524 (69–109,383) Data presented as median (IQR). These data are for specific samples used for Treg marker analyses in this study. Refer to Teer et al. (2019) for the complete sample set. cART: combination antiretroviral therapy; C/mL: copies per millilitre.Table 2. CD4 count and viral load in HIV-positive study participants.
-
The median percentage of FOXP3-expressing cells increased in the CD4+CD25- T cell population in HIV-treated group with relatively low CD4 counts (< 500) [0.42 (0.09-1.24) vs. treatment naïve [0.078 (0.046-0.118)], P < 0.01, Fig. 1A) and high VL (> 1000) [0.66 (0.23-1.93) vs. treatment naïve [0.078 (0.046-0.118)], P < 0.001, Fig. 1D). GARP-expressing cells displayed an increase in the CD4+CD25- T-cells in HIV-treated patients with a relatively low CD4 count [1.21 (0.12-9.77)] vs. treatment naïve [0.034 (0.009-1.63)], P < 0.01, Fig. 1B) and high VL [2.47 (0.057-28.7)] vs. treatment naïve [0.034 (0.009-1.63)], P < 0.01, Fig. 1E). There were no significant differences between the other groups or for the SATB1-expressing CD25-negative cells (Fig. 1C, 1F). There was a significant, strong positive correlation between GARP and FOXP3 expressed on CD4+CD25- cells (r = 0.57; P < 0.0001), and a significant, moderate positive correlation between CD25-FOXP3+ and CD25++GARP+ (r = 0.38; P = 0.0005) (Table 3).
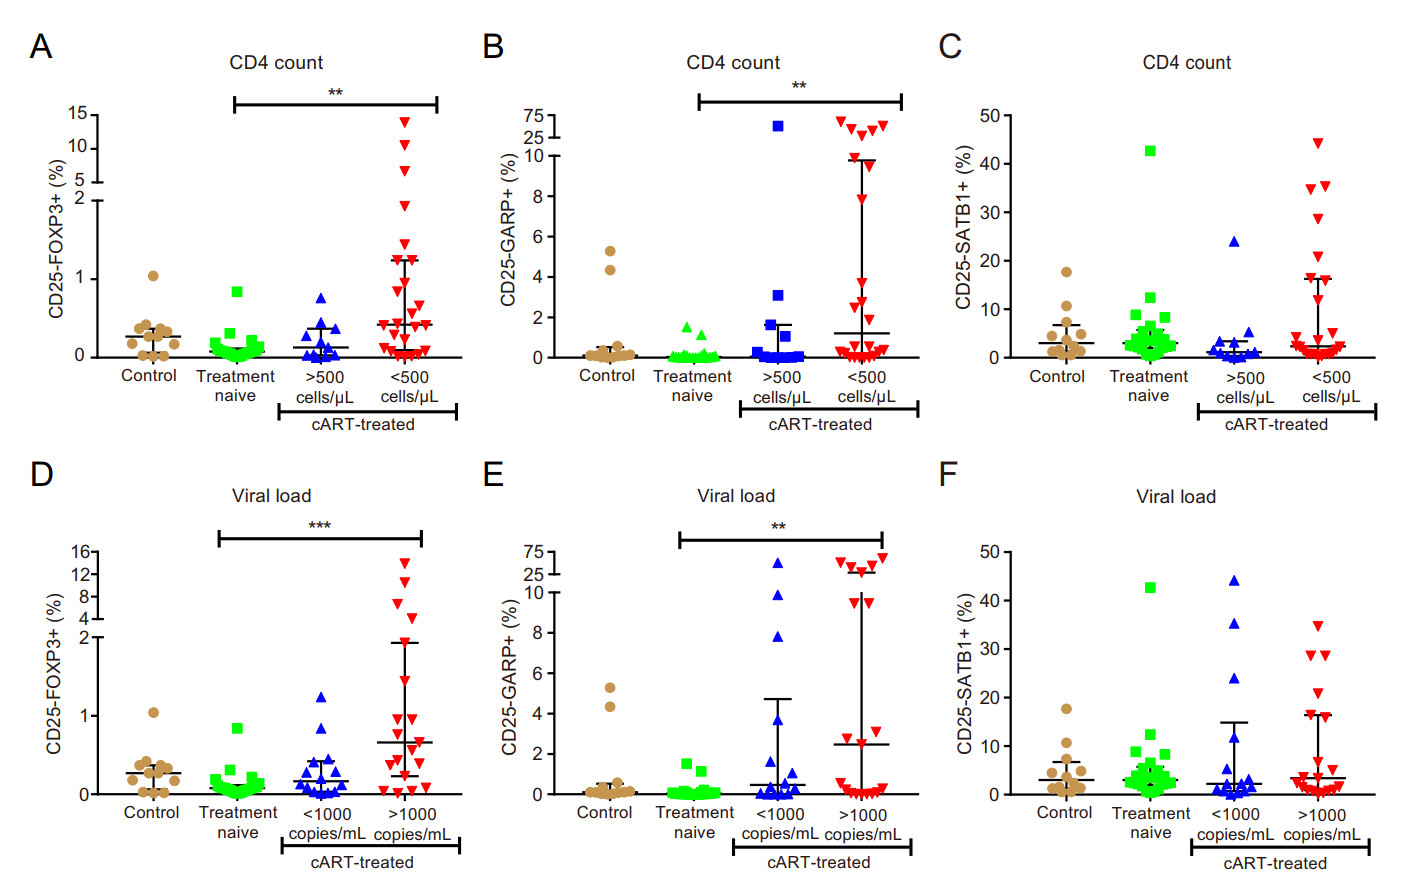
Figure 1. Expansion of FOXP3 and GARP in CD4+CD25- cells in immune compromised HIV-infected individuals with virological failure. A-C classification according to CD4 count; D-F classification according to viral load; (A and D) percentage of CD4+CD25-FOXP3+ cells; (B and E) percentage of CD4+CD25-- GARP+ cells; (C and F) percentage of CD4+CD25-SATB1+ cells. ** P < 0.01; ***P < 0.001.
CD4+CD25-FOXP3+ (%) CD4+CD25++FOXP3+ (%) CD4+CD25-GARP+ (%) r = 0.57; P < 0.0001 r = 0.37; P = 0.001 CD4+CD25++GARP+ (%) r = 0.38; P = 0.0005 r = 0.24; P = 0.02 CD4 count (cells/μL) r = - 0.53; P < 0.0001 r = - 0.38; P = 0.001 Viral load (copies/mL) r = 0.43; P = 0.0007 r = 0.23; P = 0.04 CD8+CD38+ (%) r = 0.21; P = 0.04 NS Table 3. Correlation of CD25- and CD25++ Tregs expressing FOXP3 with immunological markers.
-
The CD4+CD25-FOXP3+ Treg subset showed a significant, strong negative correlation with CD4 count (r = — 0.53; P < 0.0001) and a significant, strong positive correlation with VL (r = 0.43; P = 0.0007) and CD38 expression on CD8+ T-cells (r = 0.21; P = 0.04) (Table 3).
-
The percentage of FOXP3-expressing cells remained unaltered in the CD4+CD25++ T cell population for all study groups (Fig. 2A and 2D), while SATB1 expression in the CD4+CD25++ subset was not significantly different between study groups (Fig. 2C and 2F). However, there was a significant increase of the GARP+ subset in the HIV-treated group with low CD4 counts (CD4 count < 500; P < 0.05) (Fig. 2B), while there was no significant increase for the GARP+ subset in the HIV-treated group with high VL (VL > 1000) (Fig. 2E).
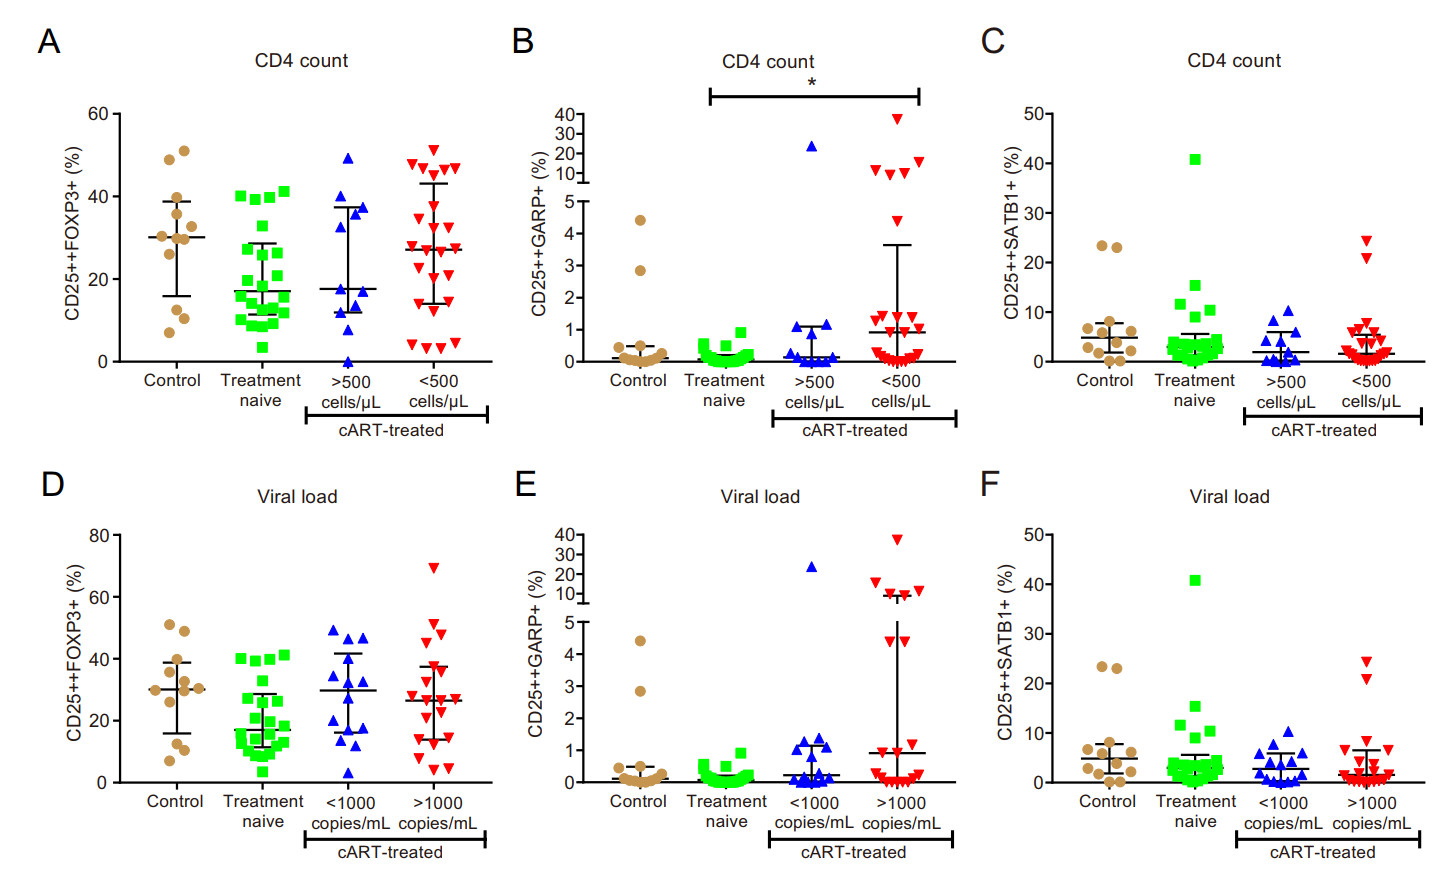
Figure 2. Expansion of GARP in CD4+CD25++ cells in immune compromised HIV-infected individuals. A–C classification according to CD4 count; D–F classification according to viral load; (A and D) percentage of CD4+CD25++FOXP3+ cells; (B and E) percentage of CD4+CD25++GARP+ cells; (C and F) percentage of CD4+- CD25++SATB1+ cells. *P < 0.05.
-
There was a strong positive correlation of pro-inflammatory CD4+CD25-SATB1 + T cells with immune activation markers (CD8+CD38+ T-cells) (r = 0.50; P < 0.0001) and significant, weak positive correlations with the percentage of coagulation marker tissue factor-expressing CD8+ T cells (CD8+CD142+) (r = 0.24; P = 0.02) and D-dimer (r = 0.24; P = 0.03), respectively (Table 4).
CD25-SATB1+ (%) CD8+CD38+ (%) r = 0.50; P < 0.0001 CD8+CD142+ (%) r = 0.24; P = 0.02 Plasma D-dimer (μg/mL) r = 0.24; P = 0.03 Table 4. Correlation of CD25- immunological markers.
-
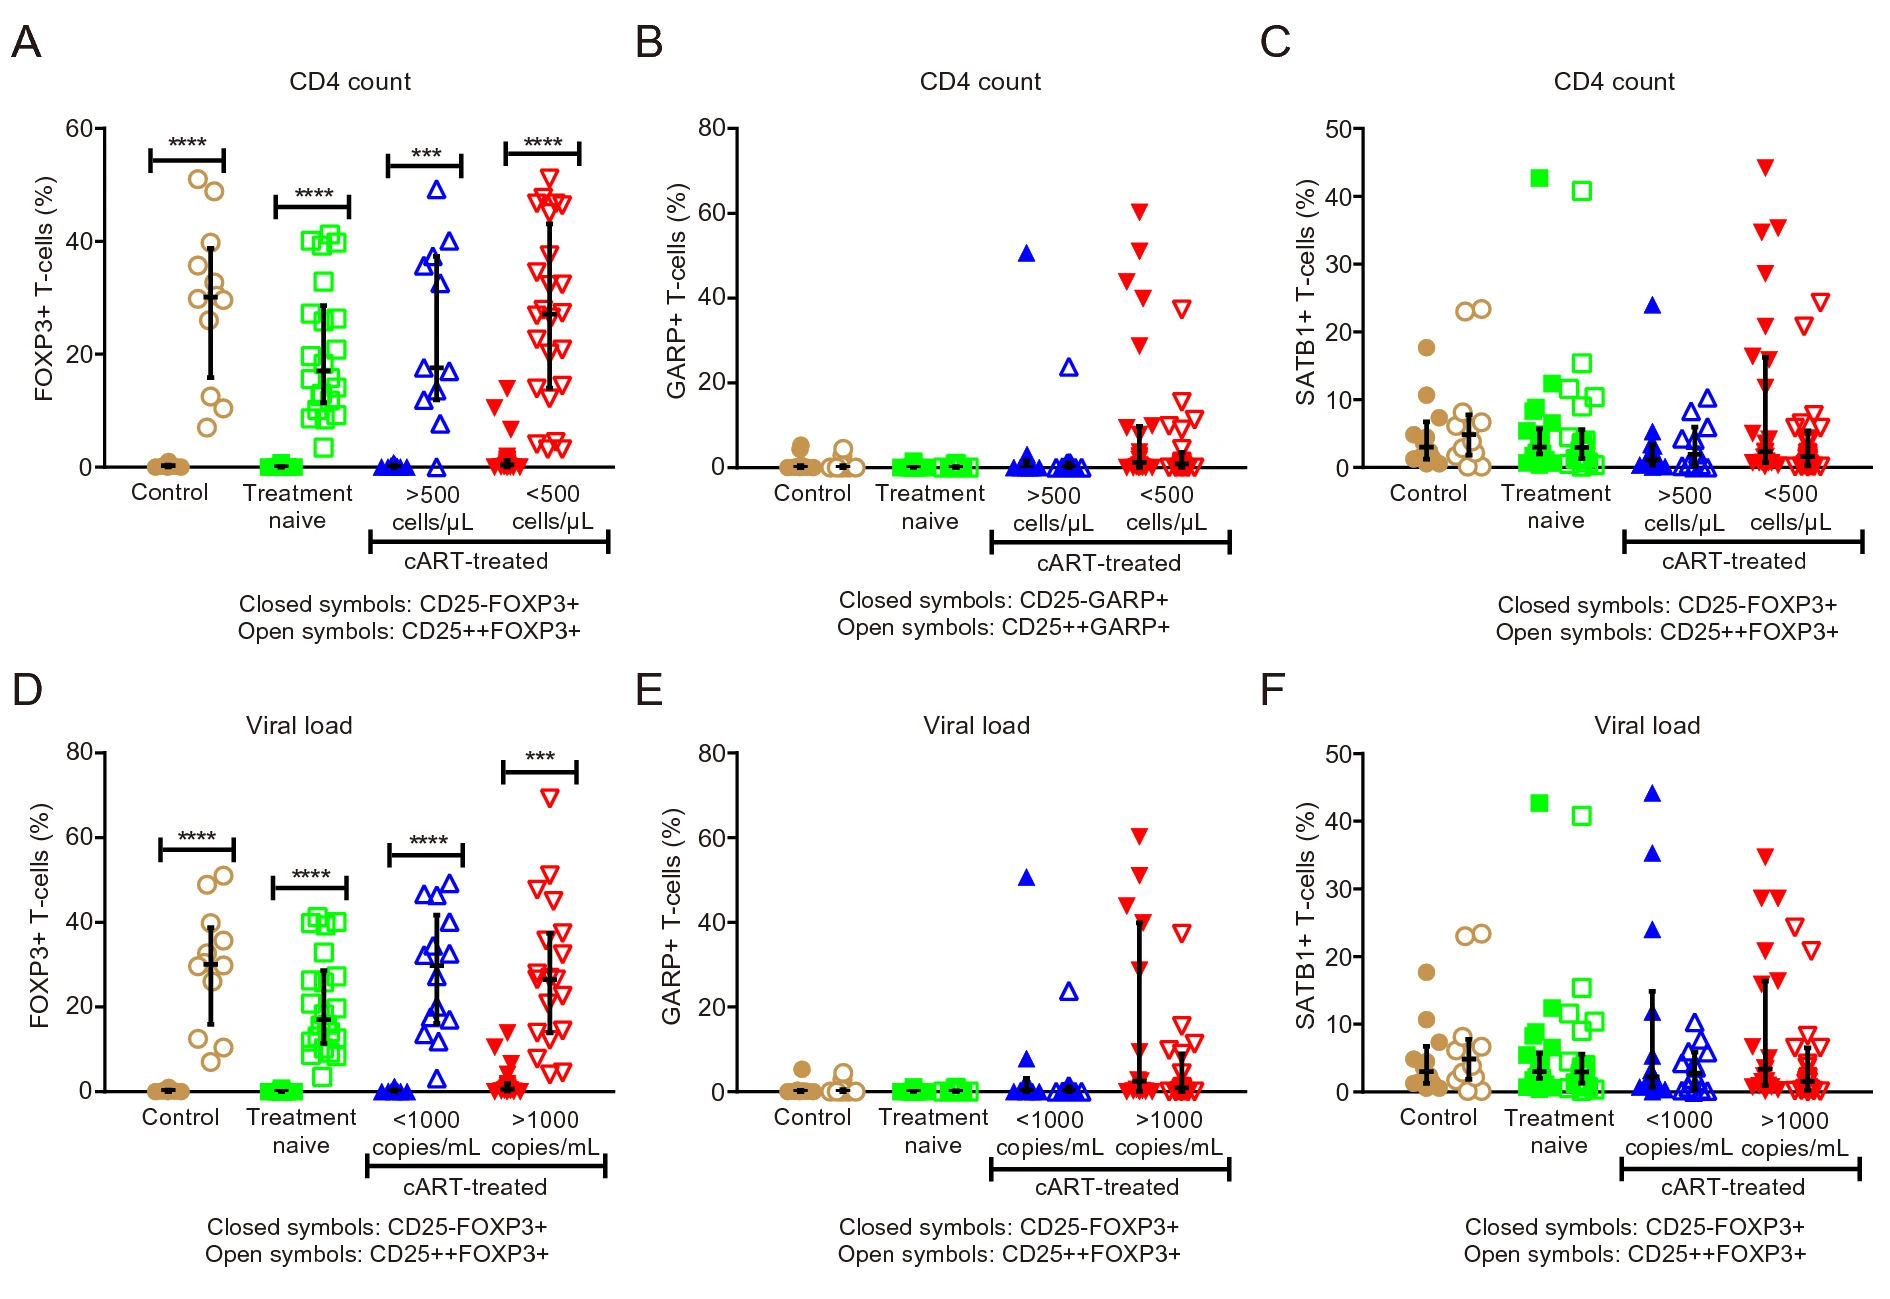
There was a significant increase in FOXP3+ cells in both CD4+CD25- and CD4+CD25++ T cell subsets for all study groups stratified according to CD4 count and VL (P < 0.0001) (Fig. 3A and 3D). The differences in the GARP (Fig. 3B and 3E) and SATB1 (Fig. 3C and 3F) expressing subsets in the CD4+CD25- vs. CD4+CD25++ populations were not statistically significant.
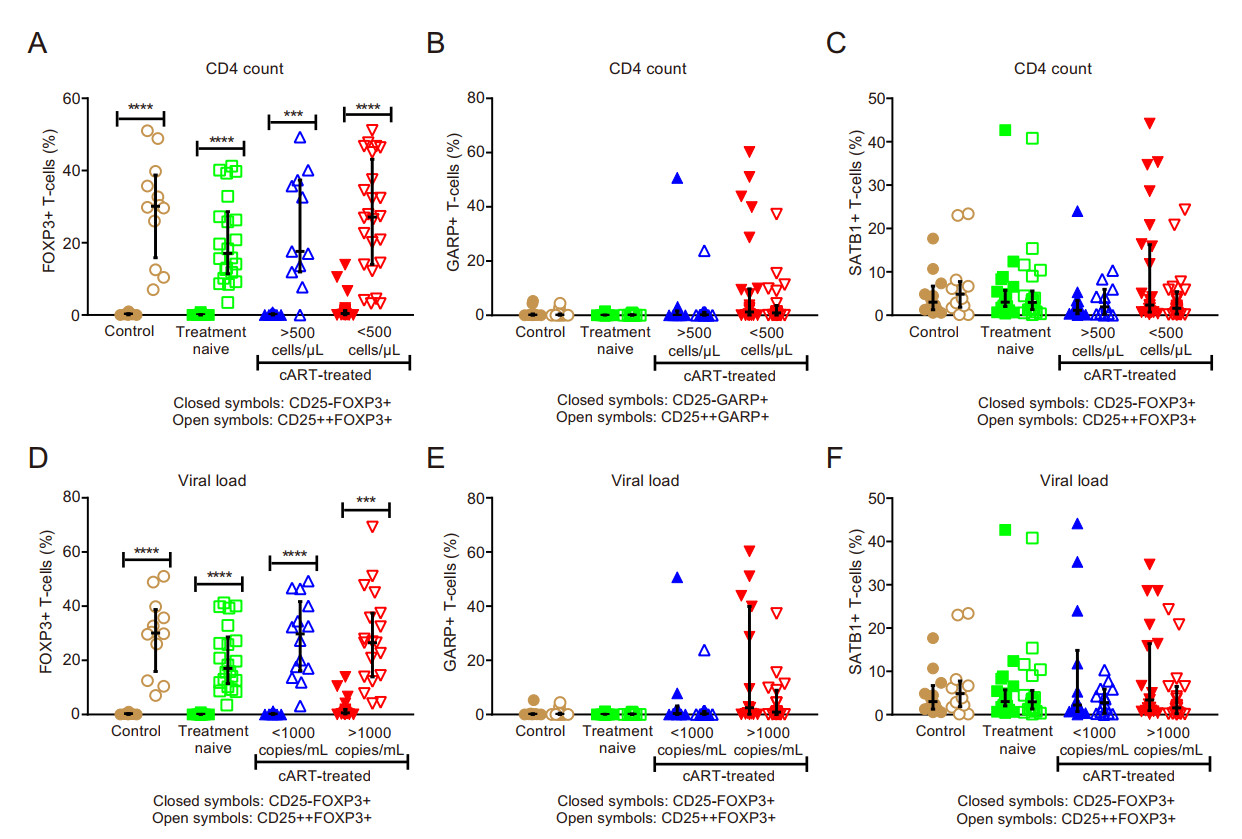
Figure 3. Comparison of CD25- vs. CD25++ Tregs expressing FOXP3, GARP and SATB1 in immune compromised HIV-infected individuals with virological failure. A-C classification according to CD4 count; D-F classification according to viral load; (A and D) percentage of FOXP3-expressing T cells; (B and E) percentage of GARP-expressing T cells; (C and F) percentage of SATB1-expressiing T cells. *** P < 0.001; **** P < 0.0001.
-
Circulating IL-10 levels did not differ significantly between the study groups (refer Fig. 4). IL-10 showed a significant, weak positive correlation with CD4+CD25-- FOXP3+ T-cells (r = 0.27; P = 0.03). It also showed significant, moderate positive correlations with immune activation (CD38 expression) in CD8+ T-cells (r = 0.33; P = 0.01) and with D-dimer (r = 0.30; P = 0.03; Table 5).
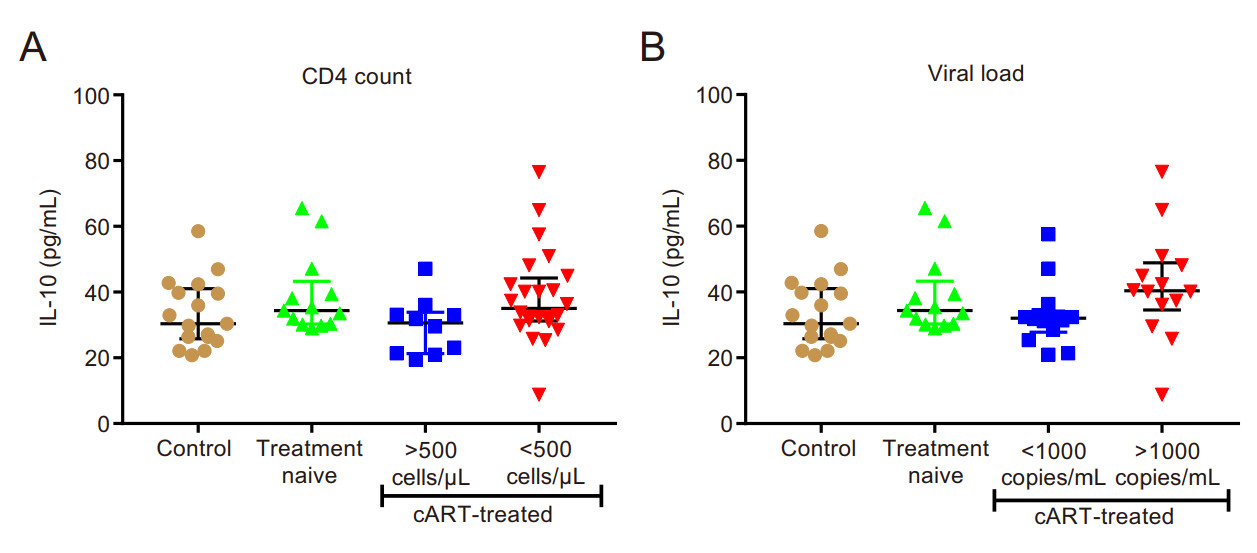
Figure 4. Plasma interleukin-10 levels. A classification according to CD4 count; B classification according to viral load.
IL-10 (pg/mL) CD4+CD25-FOXP3+ (%) r = 0.27; P = 0.03 CD8+CD38+ (%) r = 0.50; P < 0.0001 Plasma D-dimer (μg/mL) r = 0.24; P = 0.03 Table 5. Correlation of IL-10 with CD25- Tregs expressing FOXP3, immune activation of CD8+ T cells and plasma D-dimer.
Study Population Characteristics, CD4 Count and Viral Load
Expansion of FOXP3 and GARP-Expressing Cells in the CD4+CD25- T Cell Subset in cART-Treated HIV-Positive Individuals with Virological Failure
FOXP3 Expression on CD4+CD25- Cells Correlates with HIV Progression Markers
The Expression Markers (FOXP3, GARP and SATB1) in CD4+CD25++ T Cells
CD4+CD25-SATB1+ Correlation with Immune Activation and Coagulation Markers
Comparing Expression Markers (FOXP3, GARP and SATB1) between CD4+CD25- and CD4+CD25++ T Cells
Interleukin-10 Levels Correlated Positively with Immune Activation Markers and D-Dimer
-
Some HIV-positive individuals exhibit persistent immune activation, immune failure and the development of chronic co-morbidities such as CVD (Dominick et al. 2020). However, the exact role of Treg cells in this context remains unclear as they can trigger beneficial or detrimental outcomes. The current cross-sectional study therefore investigated FOXP3, GARP and SATB1 expression on CD25+ vs. CD25- negative T cell subsets, together with an assessment of its impact on coagulation markers in HIVpositive patients. Our data revealed three major findings: (1) the expansion of the unconventional Treg cell subset (CD4+CD25-FOXP3+) is linked with disease progression markers; (2) increased GARP expression in the CD4+- CD25- and CD4+CD25++ subsets; and (3) the identification of a strong link between CD4+CD25-SATB1+ cells and markers of immune activation (CD8+CD38+) and coagulation (CD8+CD142+ and D-dimer).
Natural Treg cells participate in the responses to chronic HIV infections. However, chronic inflammatory diseases may develop when Treg cells fail to control the balance between tolerance and immunity. The main feature of an HIV infection is progressive CD4 lymphopenia (CD4 depletion) and abnormal HIV-specific CD8 T cell responses, which play a key role in the control of viral replication (Chevalier and Weiss 2013). Persistent immune activation is thus a hallmark of HIV infection and implicated in HIV-related pathophysiology. Here, Treg cell expansion can elicit either a beneficial effect by suppressing T-cell activation or a detrimental one by weakening HIV-specific responses and hence contributing to viral persistence and chronic illness (Keynan et al. 2008; Chevalier and Weiss 2013; Rajasuriar et al. 2013). The balance between such contrasting outcomes for Treg cell expansion therefore holds serious consequences in the context of HIV disease progression and pathogenic clinical outcomes.
Findings from our study revealed an expansion of unconventional Tregs (CD4+CD25-FOXP3+) in HIVpositive individuals with a relatively low CD4 count (< 500) and high VL (> 1000). Others also observed such an expansion in patients with new-onset systemic lupus erythematosus (Zhang et al. 2008) and HIV/tuberculosis co-infection (Angerami et al. 2017). Previous research found a link between the expansion of FOXP3 expression on CD4+ T cells and disease progression markers such as VL, CD4 counts and immune activation (Suchard et al. 2010). The strong negative correlation between CD4 count and FOXP3 expression on CD25- and CD25++ cells may therefore be explained by the link between CD4 depletion and persistent immune activation, as well as increased circulating CD4+CD25+ Treg cells with a corresponding decrease in function (Février et al. 2011). HIV infection can also directly affect such a Treg expansion (from CD4+CD25- cells) in the presence of TGF-β (Amarnath et al. 2007) and/or the GARP-TGF-β complex (Miller et al. 2013). The expansion may also be indicative of increased Treg activity and function with greater immune activation (Chevalier and Weiss 2013). In agreement, Walker et al. (2003) demonstrated FOXP3 induction and the acquisition of Treg activity in stimulated human CD4+CD25- T cells (Walker et al. 2003). During an immune response and the corresponding CD4+CD25- T cell activation two expansions may arise, i.e. effector CD4+CD25+ and regulatory CD4+CD25+ T cells and with FOXP3 expression correlating with regulatory activity. This may help explain FOXP3 recruitment from CD4+CD25- subsets in our data set. Our results show that this expansion takes place at a later stage, which raises the question of whether they actually possess their usual regulatory function. A complete understanding of this phenomenon is still lacking, especially considering that the maturation of Treg requires IL-2 (CD25) signaling to initiate FOXP3 expression and maturation for normal suppression function (Furtado et al. 2002; Horwitz 2010). Additionally, Floess et al. (2007) indicated that epigenetic modification is required to stabilize FOXP3 expression and to allow for the development of a permanent suppressor cell lineage. Here, they showed complete demethylation of CpG motifs as well as histone modifications in ex vivo isolated FOXP3+CD25+CD4+ Tregs, but not in naïve CD25-CD4+ T cells (Floess et al. 2007). However, Tregs induced by TGF-β in vitro display only incomplete demethylation despite high FOXP3 expression, suggesting abnormal suppression function of CD4+CD25-FOXP3+ T cells. By contrast, others suggest that unconventional Tregs exert regulatory functions in a similar way to conventional Tregs despite an altered surface marker expression patterns and differences in cytokine production (Angerami et al. 2017). Such differences between findings are difficult to explain and requires further investigation.
The current study revealed upregulated GARP expression on both CD4+CD25++ and CD4+CD25- T cells in patients with relatively low CD4 counts and high VL. In agreement, others found that activated natural Treg cells also express GARP during HIV infection (Wang et al. 2009). Following T cell receptor activation, GARP and latency-associated peptide (late-stage activation markers) are upregulated on CD4+Helios+ T cells regardless of FOXP3 expression. Of note, Helios can cooperate with FOXP3 to enhance Treg function (Elkord et al. 2015). Moreover, CD4+GARP+/-latency-associated peptide+-Tregs can produce the immunosuppressive cytokine IL-10, but not interferon-gamma (Elkord et al. 2015). The increased GARP expression usually occurs with CD4 T cell depletion when Treg-mediated suppression pathways are activated (Chevalier et al. 2013). Here, the activated GARP-TGF-β complex may play a role to convert CD4+CD25- T cells into phenotypic and functional Treg cells (Miller et al. 2014). Further support comes from research work demonstrating that the feline immunodeficiency virus directly activated CD4+CD25+ Treg cells in vitro by converting Th cells into functional suppressors through a membrane-bound TGF-β/GARP-mediated mechanism (Miller et al. 2013, 2014). These findings suggest that the Th to Treg conversion may initiate a cascade of events that contribute to the maintenance of virus reservoirs, progressive Th cell immunosuppression, and the development of immunodeficiency (Miller et al. 2014). This may help to explain the depletion of CD4+ T cells during the chronic HIV stages. We therefore propose that GARP may be an additional factor in terms of the HIV pathogenesis model, although further studies are required to assess whether its upregulation during HIV infection is directly involved in CD4 depletion, and if it can contribute to immuno-deficiency during the later stages of the infection (Miller et al. 2014).
An important aspect to consider is how the immune system interacts with immune activation without suppressing the HIV-specific immune response. Here, Treg cells are major contributors to this response together with GARP-mediated regulation. GARP can be upregulated upon T cell receptor stimulation and together with FOXP3 and TGF-β may help to explain immune activation and the chronic infection state. In this case, CD4+CD25+ may be induced by direct viral infection or by chronic antigenic stimulation. Such activation can result in increased suppressive mechanisms and inhibition of the protective immune response mediated by T and B cells. Such phenomena will subsequently lead to chronic viremia and persistent immune activation (Keynan et al. 2008; Paiardini and Muller-Trutwin 2013).
Our data revealed no significant differences for SATB1 expression in both CD4+CD25- and CD4+CD25++ T cells in the HIV study groups. However, proinflammatory CD4+CD25-SATB1+ strongly correlated with immune activation and coagulation markers (CD8+CD38+ and CD8+CD142+) expressed on T cells. There was also a robust correlation with D-dimer levels. This relationship may point to the pro-inflammatory role of Th cells in HIV infection and indicate abnormal Treg cell function. There is further evidence that SATB1 plays an essential role in the establishment of immune tolerance. For example, previous work showed that severely impaired T cell development in SATB1 null mice together with decreased FOXP3+ Treg cells (Kondo et al. 2016). Here, the SATB1 deficiency impacted on Treg cell suppressive function that usually plays a major role in the establishment of peripheral tolerance (Kondo et al. 2016). In addition, negative selection during T cell development in the thymus was severely impaired in the SATB1-deficient mice (Kondo et al. 2016). SATB1 mediates and coordinates Th2 differentiation by positively regulating the GATA-3 gene (a key regulator of T cell development). In contrast, the maintenance of Treg cell functions is dependent on SATB1 inhibition. SATB1 therefore possesses a critical role in two important differentiation pathways (Beyer et al. 2011). Previous work in our lab demonstrated an expansion of FOXP3+ Treg cells (as a percentage of total CD4+ T cells) with upreg-ulation of GARP and SATB1 during virological failure with second-line treatment during chronic HIV infection (Teer et al. 2019).
The cytokine IL-10 plays a critical role in terms of the balance between inflammatory immune responses and immunoregulatory mechanisms that limit collateral tissue damage in numerous infectious diseases (Rojas et al. 2017). Our data revealed no significant differences between groups, unlike others that demonstrated increased IL-10 with disease progression (Stylianou et al. 1999) (Fig. 4). We are unclear why this may be the case but propose that our relatively low sample numbers may influence the robustness of the IL-10 data generated. Our findings showed that IL-10 levels correlated with unconventional Treg cells (CD4+CD25-FOXP3+), immune activation and D-dimer (coagulation marker). Such associations may indicate that cytokine levels in HIV-infected individuals affect the optimal functioning of the immune system and directly impact the course of HIV pathogenicity (Catalfamo et al. 2012). In addition, the stage of HIV progression (degree of VL) may also help explain the differences observed for IL-10 levels (Naicker et al. 2009).
Our data reveal the expansion of unconventional Treg cells (CD4+CD25-FOXP3) in immunocompromised HIVpositive patients with virological failure, accompanied by GARP upregulation. This study also highlighted alterations in the expression of Treg phenotypes and the strong correlation with immune activation, inflammation, and coagulation markers during HIV infection on cART. These findings suggest a putative pathogenic role of specific Treg subsets and associated markers during HIV infection, which could serve as a potential therapeutic target as a part of immune-modulating therapies in such patients. However, the relatively low participant numbers for each study group may explain the lowered statistical robustness for some of our findings, while the lack of a Treg functional test is also a limiting factor. Future studies are required to ascertain this notion and also that focus on a more detailed phenotypic Treg cell analysis to provide functional evidence to support such a pathogenic role.
-
This work was supported by South African Medical Research Council and Stellenbosch University (to M. F. Es-sop). We acknowledge Nazma Mansoor and Rozanne Adam for excellent assistance with flow cytometry.
-
ET, RHG, and MFE conceived and designed research. ET, DEJ and LD performed experiments. ET, DEJ, LD, RHG, and MFE analyzed data. ET, DEJ, LD, RHG, and MFE interpreted results of experiments. ET and DEJ prepared figures. ET, DEJ, RHG, and MFE drafted manuscript. ET, DEJ, RHG, and MFE edited and revised manuscript. All authors read and approved the final manuscript.
-
The authors declare that they have no conflict of interest.
-
Ethical clearance was obtained from the Human Research Ethics Committee of Stellenbosch University (N12/12/086) and the Department ofHealth in the Western Cape, South Africa (reference number: RP090/2013). Prior to the study, we informed participants (attending the Worcester Community Day Center) about the various study procedures and subsequently obtained written consent.


 DownLoad: