


HTML
-
Human respiratory syncytial virus (RSV) is the leading cause of hospitalization in infants and young children (Shay et al. 2001; Thompson et al. 2003). However, no licensed RSV vaccine is available. Trials of formaldehydeinactivated RSV (FI-RSV) vaccine in the late 1960's caused disastrous worsening of disease and death in infants during subsequent natural RSV infection (Kapikian et al.1969). It has been proven that the vaccine-enhanced disease (VED) is an important obstacle for the development of a safe and efficacious RSV vaccine, but its molecular mechanisms are unclear (Harker et al. 2010; Knudson et al.2015; Li et al. 2015; van Diepen et al. 2015; Li et al.2016).
Many pieces of evidence showed that the vaccineenhanced disease syndrome was associated with aberrant Th2-biased responses, deposition of immune complex, defective Toll-like receptor (TLR) signaling and induction of low-affinity antibodies (Delgado et al. 2009; Moghaddam et al. 2006; Murphy et al. 1986; Polack et al. 2002; Varga et al. 2001). In a mouse model of RSV infection, CD4+ T cells and certain T-cell cytokines, especially interlukin-4 (IL-4), IL-5 and IL-10, were associated with the lung pathology when mice previously sensitized to the inactivated virus were challenged with live virus (Connors et al. 1994; Graham et al. 1991; Qiao et al. 2016). Depletion of Th2 cytokine IL-4 or IL-13 of mice immunized with RSV vaccines inhibited the development of pulmonary disease after RSV challenge (Johnson et al.2003). Co-expression of IL-27 or IL-35 markedly alleviated immunopathological injury following RSV infection by regulating cellular memory responses (Zeng et al. 2012) or by eliciting a Th1-biased response and a high frequency of regulatory T (Treg) cells (Yang et al. 2020). As a subset of CD4+ T, Treg cells specifically expressed the forkhead box P3 (Foxp3) transcription factor and performed vital anti-inflammatory functions during RSV infection (Durant et al. 2013; Hori et al. 2003). Treg cells were selectively recruited to specific areas by chemokine CCL17/22, therefore attenuating the pathogenic effects of vaccineinduced CD4+ T cells (Loebbermann et al. 2013). Poor TLR stimulation by inactivated RSV was associated with lack of antibody affinity maturation and led to the production of non-protective antibodies, which were also critical for the generation of enhanced RSV disease (Delgado et al. 2009).
Understanding the molecular mechanisms of VED and the requirements for eliciting immune protection against RSV infection is critical for the development of safe and efficacious vaccines. Systemic approaches have been proven useful in investigating both the general pattern of the host response to infectious disease and the pathogenspecific immune response (Jenner and Young 2005; Li et al. 2015; Schuurhof et al. 2010). Analysis of transcription profiles based on microarray data demonstrated that at late time points after challenge, mice immunized with inactivated RSV displayed a strong innate immune response and high Th2 gene expression compared to primary infection (Schuurhof et al. 2010). Comparative proteomics identified that expression levels of host proteins were associated with vaccine-mediated enhanced disease (van Diepen et al. 2015).
In this study, we employed the established UV-RSV vaccination-challenge mouse model combined with a systemic approach to investigate phenotypically distinct vaccine-mediated host immune responses at the transcriptional level. Host transcriptomic dynamic data from the vaccination-challenge mouse model were obtained by the Illumina RNA sequencing technique. After applying the Database for Annotation, Visualization and Integrated Discovery (DAVID) (Huang et al. 2009), we quantified the interactions between differentially expressed (DE) genes, identified groups of strongly connected genes, and constructed dynamic networks by integrating gene expression data into protein–protein interaction (PPI) database. The high-influence modules (HMs) representing host response networks were identified using ClusterONE algorithm (Nepusz et al. 2012) and a model-based framework (Li et al. 2015).
Dynamic data-driven meta-analysis provides new insights into the molecular mechanisms of RSV VED from the perspectives of dynamics and networks. These findings will provide valuable information to guide the development of novel RSV prophylactic and therapeutic strategies.
-
Respiratory syncytial virus (RSV) A2 strain, human laryngeal epidermoid carcinoma cells (HEp-2) and African green monkey kidney cells (Vero) were obtained from China Center for Type Culture Collection (CCTCC) and cultured in Dulbecco's modified Eagle's medium (DMEM; Invitrogen, Carlsbad, CA, USA) supplemented with 10% fetal bovine serum (FBS; Gibco, New Zealand), 1% penicillin, and 100-U/mL streptomycin. UV-RSV preparation was performed as previously described (Murawski et al.2010; Yang et al. 2020). Briefly, RSV A2 strain was propagated in HEp-2 cells, the cells were frozen at - 80 ℃ and then thawed. The resulting cell lysates were clarified by centrifugation at 1200 ×g for 20 min. Virus in the supernatant was precipitated using polyethylene glycol 8000 (PEG 8000; 50% [wt/vol]), which was added to the supernatant to a final concentration of 10% and incubated for 90 min with stirring at 4 ℃. The precipitated virus was pelleted by centrifugation at 3000 ×g for 20 min at 4 ℃, snap-frozen, and stored at - 80 ℃. The thawed virus pellet was resuspended in 10% sucrose in TNE, homogenized, and layered on top of a discontinuous sucrose gradient composed of 1 mL of 60%, 3 mL of 45%, and 4 mL of 30% sucrose (all dissolved in TNE buffer), and the gradient was centrifuged at 160, 000 ×g in an SW41 rotor for 90 min. The visible virus band between the 30% and 45% sucrose layers was collected. 0.5 mL of a purified virus suspension was put on a 35-mm petri dish and irradiated with UV light for 40 min. The efficacy of virus inactivation by UV radiation (UV-RSV) was examined using a plaque assay in Vero cells.
-
Six- to eight-week-old specific-pathogen-free (SPF) female BALB/c mice (Hubei Experimental Animal Research Center, Wuhan, China) were randomly divided into groups and kept in SPF conditions and received water and food ad libitum.
For the UV-RSV-immunized group, mice were injected intramuscularly (i.m.) with 100 μL UV-RSV (1 × 10⁵ PFU). For the PBS-treated group, mice were inoculated i.m. with 100 μL PBS. All mice received a booster administration with the same dose at 2-week intervals. The titer of neutralization antibodies was measured following the protocol of plaque reduction assay as described previously (Murawski et al. 2010). Mice were infected intranasally (i.n.) with 1 × 10⁶ PFU of RSV in 50 μL at 2 weeks after the final immunization and sacrificed at days 1, 2, 4 or 6 post-challenge, respectively, for subsequent experiments. Untreated mice were used as normal control.
-
Real-time reverse transcription quantitative PCR (RTqPCR) was performed as described previously (Lee et al.2010). For virus titration, the total RNA of mouse lungs was extracted using the TRIzol reagent (Thermo Fisher Scientific). The random primer (N9) (TaKaRa) and the specific primers targeted to RSV L gene: 5′-GAACTCAGTGTAGGTAGAATGTTTGCA-3′ and 5′-TTCAGCTATCATTTTCTCTGCCAAT-3′ were used for reverse transcription of cDNA and specific amplification of viral gene, respectively. A quantitative plasmid pMD-L containing RSV L gene was used as a standard template. For validation of differentially expressed (DE) genes, total RNA was extracted from lung tissues and reverse transcribed (RT) into cDNA. RNA of selected genes was relatively quantified using 29 SYBR Green Master mix (TOYOBO) in a 7500 real-time system (Applied Biosystems, USA) with GAPDH as endogenous control. The fold changes of DEGs were expressed as comparative threshold cycle (2-DD-△△CT).
-
For assessment of pulmonary pathology, the individual lungs of 6 mice were collected at indicated time points, immersed in 4% paraformaldehyde, embedded in paraffin, sectioned and stained with hematoxylin and eosin (H & E). The lung inflammation severity scores were defined as previously described (Harker et al. 2010; Murawski et al.2010).
-
Cytokine staining was performed as previously described (Knudson et al. 2015) or according to the manufacturer's procedure. For Treg cell analysis, 1 × 10⁶ cells were surface-stained with mAbs specific to CD4 (Clone RM4-5, FITC-labeled), and to CD25 (Clone PC61, APC-labeled) (BioLegend, San Diego, CA, USA). After fixation and permeabilization, cells were intracellularly stained with PE-labeled anti-mouse Foxp3 antibody (Clone MF-14) (BioLegend). For Th1 and Th2 analysis, cells were stained for surface or intracellular proteins after ex vivo stimulation. Cells were stimulated for 6 h at 37 ℃ with Cell Activation Cocktail (with PMA, ionomycin and Brefeldin A; Biolegend) in 10% FCS-supplemented RPMI. Cells were then surface-stained for CD3 (Cone 17A2, APClabeled) and CD8 (Clone 53–6.7, FITC-labeled), fixed and permeabilized in intracellular staining perm wash buffer, and stained intracellularly with mAbs specific to IFN-γ (clone XMG1.2) or to IL-4 (Clone 11B11) (Biolegend). The stained cells (approximate 1 × 10⁵) were analyzed by flow cytometry (Beckman Coulter CytoFlex, USA), the data were analyzed in CytExpert software. After washing procedures, the results are presented as the percentage of CD25+ Foxp3+ (Treg) cells among CD4+ T cells or IFN-γ+/CD4+ (Th1) or IL-4+/CD4+ (Th2) cells among CD4+ T cells.
-
The cytokines in the lung homogenates were quantitatively measured by ELISA as previously described (Qiao et al.2016; Shao et al. 2009; Yang et al. 2020). Briefly, lung samples were collected at indicated time points. After homogenization and centrifugation, the concentrations of Th1 type (IFN-γ, IL-2, TNF-α), Th2 type (IL-4, IL-5, IL-10), Th17 cell-related (IL-6, IL-17) and TNF-β cytokines in the lung homogenates were quantitatively measured using commercial ELISA kits (BioLegend).
-
For RNA sequencing, lungs were collected at indicated time points (3 mice/group). RNA extraction, cDNA library preparation and sequencing were performed at WuXi NextCode (Shanghai, China) as previously described (Yang et al. 2020), following the manufacturer's instructions. Total RNA was extracted by Rneasy (Qiagen) and RNA quality was checked using the Bioanalyzer 2100 (Agilent, Palo Alto, CA, USA). The mRNA-focused sequencing libraries from total RNA were prepared using the WuXi in-house protocol. The synthesized cDNA was subjected to end repair, phosphorylation, and A base addition according to the library construction protocol. Then, sequencing adapters were added to both ends of the cDNA fragments. After PCR amplification of the cDNA fragments, the 250–350 targets were obtained and cleaned up. After library construction, a double-stranded DNA HiSeq assay with a Qubit (version 2.0) fluorometer (Thermo Fisher Scientific) was used to quantify the concentration of the resulting sequencing libraries, and the size distribution was analyzed using Agilent BioAnalyzer 2100 (Agilent). Then, an Illumina cBOT cluster generation system with HiSeq PE Cluster Kits (Illumina) was used to generate clusters, and paired-end sequencing (2 × 150) was performed using an Illumina HiSeq system by Illumina-provided protocols at WuXi NextCode.
-
The transcriptional level of each expressed gene was calculated and normalized to the number of Fragments Per Kilobase of transcript per Million mapped reads (FPKM). Transcript quantification and differential gene expression analysis were performed using the Cufflinks software suite (Trapnell et al. 2013) and DESeq2 software (http://www.bioconductor.org/packages/release/bioc/html/DESeq2.html). The data were filtered by the absolute value of expression fold change > 2 (up or down) and a false-discovery-rate (FDR)-corrected P value (q value) of < 0.05. Filtered data were analyzed to group differentially expressed (DE) genes, and to identify enriched biological process terms using the Database for Annotation, Visualization, and Integrated Discovery (DAVID) tools (http://david.abcc.ncifcrf.gov/) (Huang et al.2009).
-
Construction and analysis of networks were performed as described previously (Li et al. 2015). The Search Tool for the Retrieval of InteractiNg Genes (STRING) database (Jensen et al. 2009) and Biological General Repository for Interaction Data Sets (BioGRID) (Oughtred et al. 2019) were used to construct PPI networks based on DE genes and predicted interactions. Topological properties of PPI networks were visualized and analyzed with Cytoscape software (Shannon et al. 2003) and high-influence modules (HMs) in the networks were recognized using the ClusterONE algorithm (Li et al. 2015; Zhang et al. 2019).
-
Statistical analyses of the data were performed using Student's t test or one-way analysis of variance (ANOVA). Pvalue < 0.05 was considered statistically significant.
Cells, Virus and Preparation of UV-Inactivated Virus
Immunization and Challenge of Mice
Real-time Reverse Transcription Quantitative PCR (RT-qPCR)
Hematoxylin–Eosin Staining and Histopathology Score
Flow Cytometry Analysis
ELISAs
RNA Extraction, cDNA Library Preparation and Sequencing
Transcriptome Data Analysis
Construction and Analysis of Protein–Protein Interaction (PPI) Networks
Statistical Analysis
-
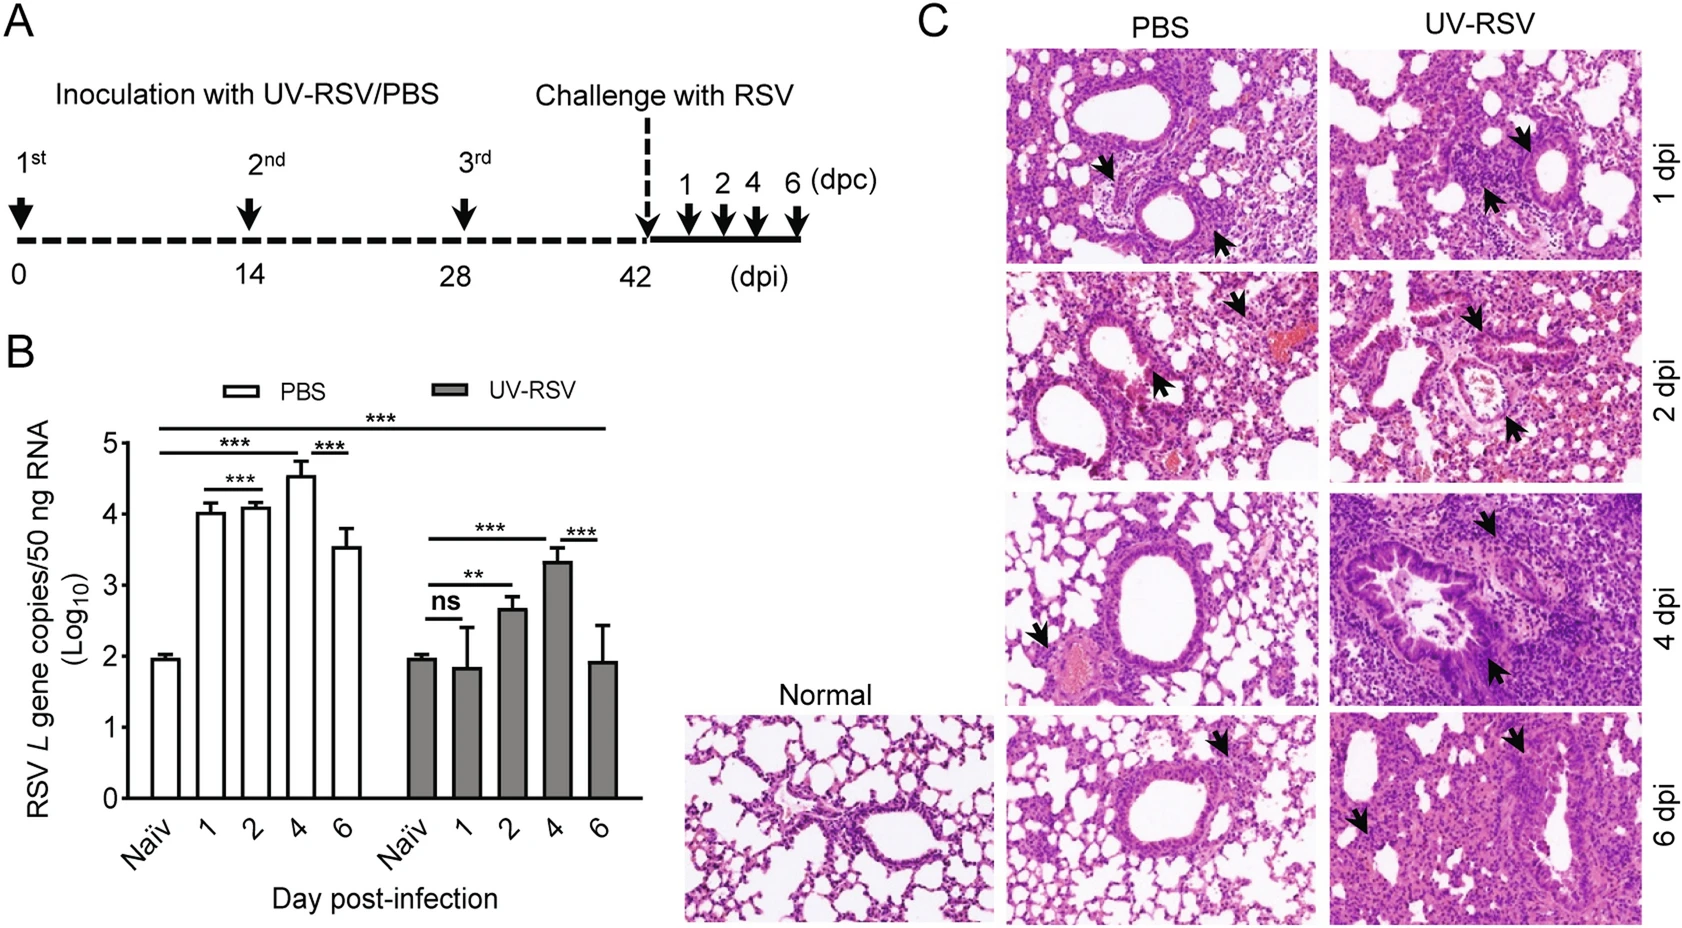
To understand the mechanisms of vaccine-enhanced disease of RSV infection, we first established a vaccinationchallenge model in experimental BALB/c mice (Fig. 1A). We investigated pulmonary viral loads and pathology of mice inoculated with PBS or UV-RSV upon RSV infection. Viral loads in the lungs of mice were measured using RT-qPCR with specific primers to RSV L gene (Lee et al.2010) and lungs of naïve mice without any treatment used as the negative control. Expectedly, pulmonary RSV titers of mice immunized with UV-RSV exhibited significantly lower levels compared to PBS-treated mice at four different time points. The viral loads in the lungs of immunized mice exhibited a slight increase at day 2 and 4 after RSV infection, but pulmonary RSV loads of PBS-treated mice reached to approximate peak with ~104 copies (50 ng total RNA) at one day post-infection (dpi) (Fig. 1B). Interestingly, significantly lower RSV loads were observed in the lungs of both mice inoculated with UV-RSV and PBS at 6 dpi compared to that at 4 dpi. Histopathological analysis showed that the pathological changes in lung tissues of both mice vaccinated with UV-RSV and PBS were observed at 1 dpi based on the thickness of interalveolar septa, inflammatory cell infiltration in peribronchial and perivascular areas. However, from 2 to 6 dpi, the histopathology scores in lung tissues of PBS-treated mice gradually reduced; in contrast, the pulmonary inflammation and tissue damage progressively increased in immunized mice (Fig. 1C, Table 1). These results revealed kinetics of viral loads and pathological changes in the lungs of mice vaccinated with inactivated RSV or PBS upon RSV infection, suggesting that the fourth day after virus infection is an ideal set-up for evaluating RSV virology and pathology in mice.
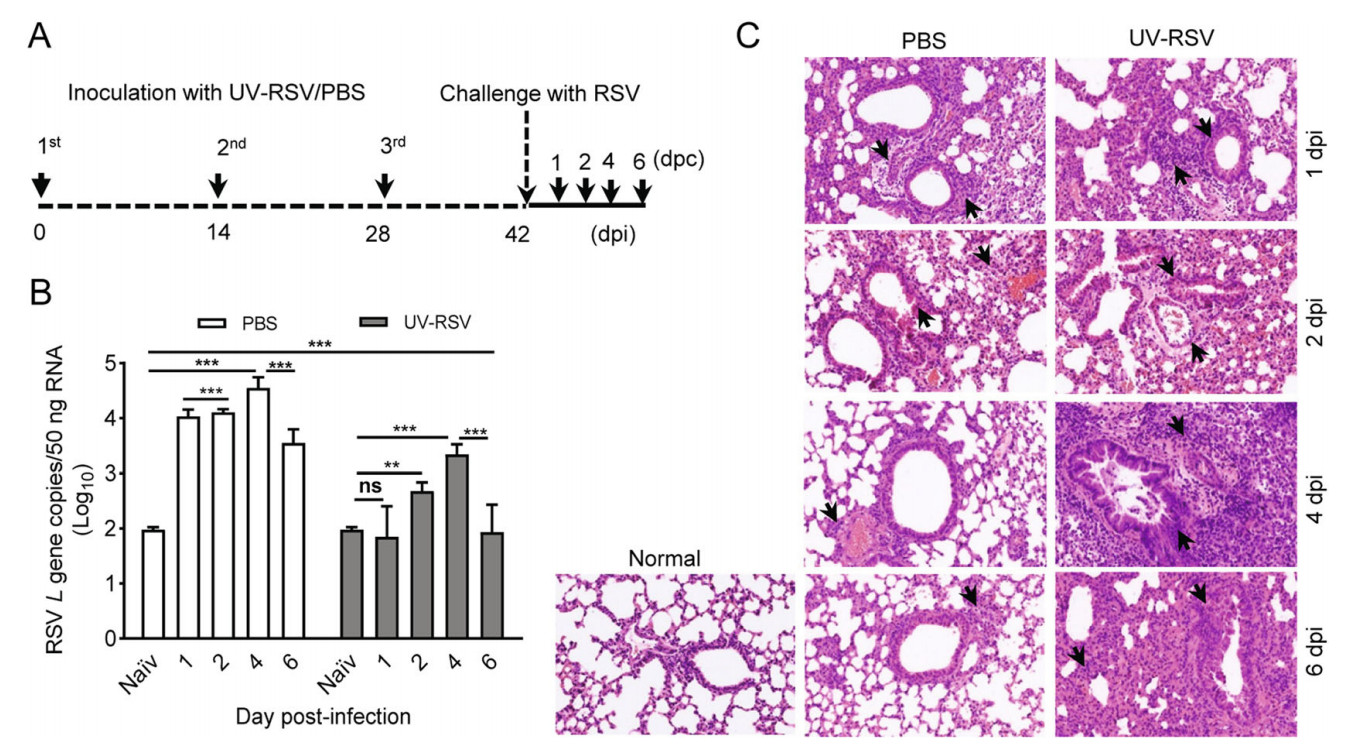
Figure 1. RSV load and histopathologic changes of lung tissues from PBS-treated and UV-RSV vaccinated mice upon RSV challenge. A The scheme of the vaccination and challenge. B Lungs from BALB/c mice inoculated with UV-RSV or PBS were harvested at days 1, 2, 4 and 6 post-challenge, and RSV L gene copies in lung tissues were measured by RT-qPCR. Data are presented as mean ± SD of two independent experiments for 6 individual mice, and pairwise comparisons of values were performed using a t test or oneway ANOVA. ***P < 0.001; **P < 0.01; ns, not significant. C Photomicrographs of lung tissue sections stained with hematoxylin and eosin (magnification, × 200). Arrows indicate inflammatory infiltration and injury.
dpi Groups Histopathology scorea Alveolar tissue Peribronchial spaces Perivascular spaces 1 PBS 2.38 ± 0.24 1.93 ± 0.36 1.92 ± 0.33 UV-RSV 2.62 ± 0.12 2.02 ± 0.12 1.97 ± 0.23 2 PBS 1.98 ± 0.33 1.72 ± 0.27 1.72 ± 0.37 UV-RSV 2.50 ± 0.28 2.02 ± 0.17 1.98 ± 0.20 4 PBS 1.42 ± 0.13 1.48 ± 0.21 1.48 ± 0.16 UV-RSV 3.55 ± 0.25 2.78 ± 0.19 2.73 ± 0.20 6 PBS 1.60 ± 0.17 1.62 ± 0.17 1.50 ± 0.18 UV-RSV 3.17 ± 0.47 2.50 ± 0.34 2.45 ± 0.34 aThe histological scores were blindly evaluated by the degree of inflammation in alveolar tissue, peribronchial and perivascular spaces. Scores ranged from 0 (normal) to 3 or 4 (severe), as described in Materials and Methods. Data represent the mean ± SD (n = 6). Table 1. Histopathology score of lungs in PBS-treated and UVRSV vaccinated mice after RSV challenge.
-
Distinct CD4+ T cell subsets played key roles in RSV vaccine-enhanced immunopathology (Connors et al. 1992; Knudson et al. 2015). We investigated CD4+CD25+Foxp3+ regulatory T cells (Treg), IFN-γ-producing (IFN-γ+) (Th1) and IL-4- producing (IL-4+) CD4+ (Th2) T cell subsets in lungs of UV-RSV immunized and PBS-treated mice subsequent RSV infection at indicated time points, respectively (Fig. 2A). The total numbers of Treg-, Th1- and Th2- signature staining of CD4+ T cells in the lung from PBS treated and UV-RSV vaccinated mice were determined, and the ratios of Treg, Th1 and Th2 cell subsets to the total amount of CD4+ T cells were calculated, respectively. Importantly, at early time infection, similar numbers and ratios of Treg, Th1 and Th2 cell subsets were observed between UV-RSVimmunized and PBS-treated mice (P > 0.05) (Fig. 2B, 2C). However, mice immunized with UV-RSV exhibited significantly lower numbers and ratio of Treg cells and higher numbers and ratios of Th1 and Th2 T cell subsets compared to PBS-treated mice at days 4 and 6 following RSV challenge (Fig. 2B, 2C).
Figure 2. The percentage of Treg, Th1 and Th2 subsets of CD4+ T cells in lungs of UV-RSV vaccinated or PBS control mice after RSV challenge. The CD25+ Foxp3+ Treg, IFN-γ+ Th1 or IL-4+ Th2 cells in CD4+ T cells from lungs were measured by flow cytometry with specific antibody staining. A Representative Treg-, Th1- and Th2- signature staining of CD4+ T cells in the lung from PBS control and UV-RSV vaccinated mice. Plots were gated on CD4+ T cells. B The total numbers of Treg-, Th1- and Th2- signature staining of CD4+ T cells in the lung from PBS treated and UV-RSV vaccinated mice. C The percentage of Treg, Th1 and Th2 subsets within that gate. Data are shown as mean ± SD of five individual mice from two independent experiments. Pairwise comparisons of values were performed using a t test or one-way ANOVA. ***P < 0.001; **P < 0.01; *P < 0.05; ns, not significant.
Many T helper cell (Th) subsets are characterized by specific cytokine profiles. Cytokines produced by the Th subsets played a critical role in immune cell differentiation, activation of effector T cells and in preventing autoimmune and inflammatory diseases. We measured the concentrations of Th1-type (IFN-γ, IL-2, TNF-α), Th2-type (IL-4, IL-5, IL 10), Th17-related (IL-6, IL-17) and TNF-β cytokines in lung homogenates of UV-RSV immunized and PBS-treated mice upon RSV infection by cytokine ELISA. Data showed that compared to PBS-treated mice, cytokines IL-2, IL-4, IL-5, IL-10, TNF-α and TNF-β displayed higher concentrations and cytokines IL-6 and IL-17 were present at lower levels in UV-RSV immunized mice (Fig. 3). In UV-RSV immunized mice, IFN-γ concentration reached to approximate 20 × 103 pg/g lung tissue at 1 dpi and preserved a similar level at indicated time points (Fig. 3). However, in PBStreated mice, a low level of IFN-γ production was observed from 1 to 4 dpi and IFN-γ concentration significantly increased at 6 dpi (Fig. 3).

Figure 3. Cytokine profiles of lungs from vaccinated or control mice following RSV challenge. Th1-type (IFN-r, IL-2 and TNF-α), Th2- type (IL-4, IL-5 and IL-10), Th17-related (IL-6 and IL-17) and TNF-β cytokines concentrations were measured by ELISA. Data are presented as mean ± SD of five individual mice from two independent experiments. Pairwise comparisons of values were performed using a t test or one-way ANOVA. ***P < 0.001; **P < 0.01; *P < 0.05; ns, not significant.
-
To characterize the kinetics of host responses in immunized mice subsequent RSV challenge, the transcriptome profiles in lungs of the experimental mice were analyzed by RNA-sequencing (RNA-seq). We first identified differentially expressed genes between the PBS-treated or UVRSV-immunized mice and naïve mice for each time point using the following criteria: > two fold change; false-discovery rate [q] of < 0.05, as determined by Limma's empirical Bayes moderated t test (Fig. 4). In total, 5582 genes with 2974 up-regulated and 2608 down-regulated genes were differentially expressed in at least one treatment and at one point (Supplementary Table S1). For PBStreated mice, the host transcriptome response was immediate and a total of 2890 DE genes with 1695 up-regulated and 1195 down-regulated genes were observed at 1 dpi. At 2, 4 and 6 dpi, total DE genes were 2394, 1703 and 2986, respectively; and the number of DE genes reached the maximum number at 6 dpi (Fig. 4A; Supplementary Table S2). For mice vaccinated with UV-RSV, the host transcriptome profile showed decreased expression pattern at early infection. Total 1933 DE genes with 1178 upregulated and 755 down-regulated genes were observed at 1 dpi. The DE genes reached peak values with a total of 2950 (1623 up-regulated and 1327 down-regulated) at 4 dpi. At 2 and 6 dpi, total DE genes were 2063 and 2442, respectively (Fig. 4A; Supplementary Table S2). Among DE genes, the largest number of overlapping genes between two conditions existed at 6 dpi; but the least number of overlapping genes was observed at 4 dpi (Fig. 4B).
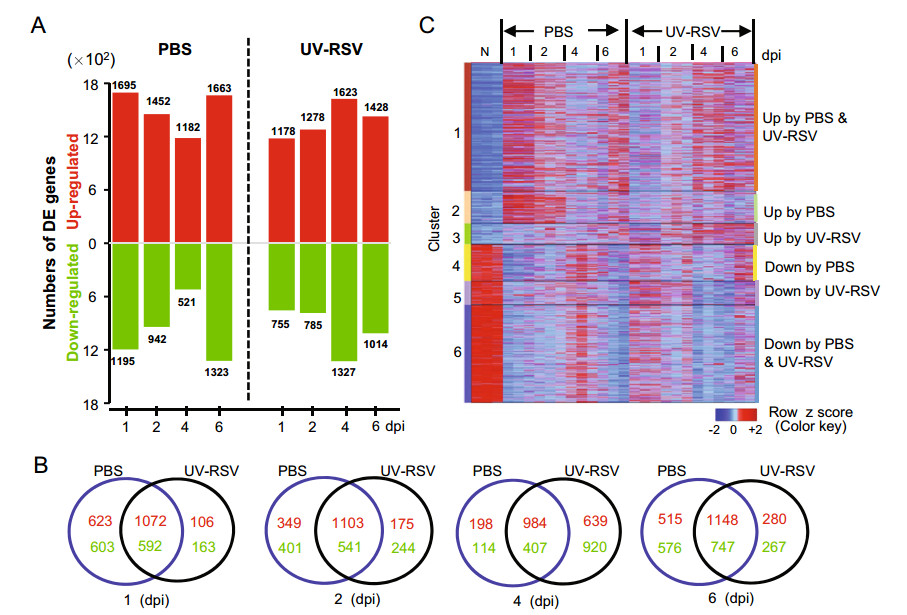
Figure 4. The gene expression profiles in lungs of UV-RSV vaccinated or PBS-treated (control) mice following RSV challenge. A Numbers of up-regulated (red) and down-regulated (green) differentially expressed (DE) genes after RSV infection compared to mocks. Criteria used for differential expression analysis are a q value of < 0.05 and |log2 FC| > 1. B Venn diagram showing the overlap of differentially expressed genes (up-regulated, red; down-regulated, green) in mouse lungs following RSV challenge. C The heatmap depicting the expression pattern of clustered DE genes at least one time point. DE genes were clustered in 6 clusters based on the expression pattern. Functional enrichment for each cluster is presented in Table 2 and in Supplementary Table S3. Data were generated from three individual mice in one experiment.
Using this DE profile, the 5582 DE genes were grouped in 6 clusters (Fig. 4C, Table 2). Total 2078 genes were upregulated and 1584 genes down-regulated in both PBStreated and UV-RSV vaccinated groups. The 344 upregulated and 389 down-regulated DE genes were observed in UV-RSV vaccinated mice, respectively. For PBS-treated mice, the 521 transcripts were up-regulated and 594 transcripts were down-regulated (Fig. 4C, Supplementary Table S3). Moreover, the DE genes in cluster 1, the early up-regulated transcription (at 1 & 2 dpi) was observed in PBS-treated and the late up-regulated responses (at 4 & 6 dpi) were observed in UV-RSV vaccinated mice (Fig. 4C). Th1-related genes such as Il18r1, Relb, Gadd45g, Sema4a, Ccr2, Il12rb1, and Il12b were up-regulated at 1 and 2 dpi in both PBS-treated and UV-RSV vaccinated mice. However, for UV-RSV vaccinated mice, the Th17-related genes (Il23a, Il21, and Il15) were down-regulated at 1 dpi; and Th2-associated genes (CD74, Il33, Idol, Mcm2, Arg1, Xcl1, Ccl1, Ccl11, Ccl8, Ccr5, Ccr9, and Ccr4), genes involved in CD8 T cell cytotoxicity (Gzmb, Ctsc, Ctsh, Serpinb9, Raet1e, and Raet1d) and positive regulation of B cells proliferation (Atad5, Il13, Nfatc2, and Cd38) were upregulated at 4 and 6 dpi.
Clusters Gene count Representative GO functional enrichmenta (P value) Cluster 1 2078 Immune system process, inflammatory response, immune response, response to virus, cell cycle, apoptotic process, antigen processing and presentation, TNF signaling pathway Cluster 2 521 Inflammatory response, immune system process, PI3K-Akt signaling pathway, TNF signaling pathway Cluster 3 344 Extracellular exosome, membrane, peptidase activity Cluster 4 594 Cilium movement, cell projection, Cluster 5 389 Angiogenesis, cell surface, calcium ion binding Cluster 6 1584 Cell adhesion, cilium movement, angiogenesis, multicellular organism development, cell surface, cell junction, Rap1 signaling pathway, Calcium signaling pathway, cAMP signaling pathway aRepresentative Gene Ontology (GO) and Kyoto Encyclopedia of Genes and Genomes (KEGG) categories are enriched by hypergeometric (FDR-adjusted P value < 0.05). Table S4 in the supplemental material for all enriched GO and KEGG categories and their corresponding P values. Table 2. Representative GO and KEGG functional enrichment of six clusters.
Next, we performed Gene Ontology (GO) and Kyoto Encyclopedia of Genes and Genomes (KEGG) pathway analysis for each cluster. Among up-regulated DE genes in both conditions (Cluster 1), the biological processes were mainly involved in immune response, inflammatory response, and regulation of immune or inflammatory response (Supplementary Table S4). Up-regulated genes in both conditions involved in pathways mainly included immune response pathways such as cytokine-cytokine receptor interaction, antigen processing, and presentation, TLR signaling pathway, Jak-STAT signaling pathway, natural killer cell-mediated cytotoxicity (Supplementary Table S4). In contrast, downregulated DE genes in both conditions (Cluster 6) mainly mediated cell adhesion, angiogenesis, multicellular organism development, and intracellular signal transduction (Supplementary Table S4). The KEGG pathways were mainly involved in the Rap1 signaling pathway, calcium signaling pathway, cAMP signaling pathway, and circadian entrainment (Supplementary Table S4).
-
To explore regulatory mechanisms of DE genes for RSV vaccine-enhanced disease, we constructed dynamic networks by integrating gene expression data into PPI data. Eleven conserved high-influential modules (HMs) were recognized from the initial PPI network (Supplementary Table S5). Differential expression profiles of 11 HMs between PBS-treated and UV-RSV vaccinated mice were identified. Compared with PBS-treated mice, the lower expression patterns of DE genes in 11 HMs were observed in UV-RSV vaccinated mice at 1 and 2 dpi (Fig. 5).

Figure 5. Dynamic characteristics of high-influential modules in lungs of UV-RSV vaccinated or PBS-treated (control) mice following RSV challenge. Dynamic networks were constructed by integrating gene expression data into PPI data, and the corresponding modules were identified using ClusterONE algorithm (Nepusz et al. 2012) and a model-based framework (Li et al. 2015). Eleven high-influential modules were detected as highly connected groups of transcripts. Average log2 fold change values of DE genes in 11 high-influential modules were shown for PBS-treated and UV-RSV vaccinated groups. Transcripts and functional enrichment of 11 HMs were shown in Table 3 and in Supplementary Tables S5 & S6.
GO functional enrichment of the 11 HMs can be classified into 1195 categories (Supplementary Table S6). Representative GO functions and genes of each HM were shown in Table 3. The functional HMs were mainly grouped into the cell cycle and cell metabolism (HM1, HM4, HM5), signal transduction (HM2, HM3, HM7), and immune and inflammatory responses (HM6, HM8, HM9, HM10, HM11) (Table 3 and Supplementary Table S6). The largest high-influential module (HM1) consisting of 237 genes was mainly involved in fundamental biological processes including cell cycle, DNA replication, cellular response to DNA damage stimulus, and microtubule-based movement.
HMs Gene counts Representative GO functional enrichmenta (P value) Representative genes HM 1 237 Cell cycle, DNA replication, cellular response to DNA damage stimulus, microtubule based movement Cdk1, MCM7, MCM8, BRCA1, CHAF1B, TICRR HM 2 53 Protein ubiquitination, intracellular signal transduction, ubiquitin protein ligase activity, ubiquitin mediated proteolysis UBE2L6, KLHL13, SOCS3, SOCS1, SIAH1B PTGER4, GLP1R, PTGIR, CALCRL, PTGER2, GCGR, ADRB1 HM 3 41 Adenylate cyclase-activating G-protein coupled receptor signaling pathway, positive regulation of camp biosynthetic process, G-protein coupled receptor signaling pathway, camp-mediated signaling, neuroactive ligand-receptor interaction, vascular smooth muscle contraction, calcium signaling pathway Ly6k, Cpm, Lypd8, Cntn4, Vnn1, Vnn3 HM 4 28 Anchored component of membrane, cell adhesion molecules (cams), pantothenate and coa biosynthesis Col5a1, Col5a2, Col1a1 Col1a2, Col4a1, Col4a2, Col6a1 HM 5 39 Collagen fibril organization, cell adhesion, cellular response to amino acid stimulus, extracellular matrix structural constituent, metal ion binding, protein digestion and absorption, ECM-receptor interaction, PI3K-Akt signaling pathway Ifih1, Ifit3, Ifit1, Dhx58, Mx1, Dhx58 HM 6 78 Defense response to virus, negative regulation of viral genome replication, immune system process, innate immune response, double-stranded RNA binding, Influenza A, herpes simplex infection Avpr1a, Adra1b, Bdkrb1, Chrm3, Mchr1, P2ry1, P2ry6 HM 7 53 Signal transduction, G-protein coupled receptor signaling pathway, positive regulation of cytosolic calcium ion concentration, neuroactive ligand-receptor interaction, calcium signaling pathway H2-T23, H2-M3, Fcgr4, CD14, Tap2, Tap1, H2-T3 HM 8 61 Antigen processing and presentation of peptide antigen via MHC class I, immune system process, adaptive immune response, peptide antigen binding, receptor binding, phagosome, graft-versus-host disease Slc11a1, Cd59a, Cd59b, Cyba, Cd53, Cybb HM 9 44 Positive regulation of phagocytosis, cell surface receptor signaling pathway, respiratory burst, inflammatory response, complement and coagulation cascades Gsdmd, B2m, Orm2, Orm3, Pglyrp1 HM 10 41 Defense response to Gram-positive bacterium, acute-phase response, immune system process Psma5, Psma4, Psmb2, Psmb8, Psmb9, Psmb10 HM 11 37 Antigen processing and presentation of exogenous peptide antigen via MHC class I, TAP-dependent, proteolysis involved in cellular protein catabolic process, proteolysis, threonine-type endopeptidase activity, peptidase activity, proteasome, NF-kappa B signaling pathway Psma7 aRepresentative GO and Kyoto Encyclopedia of Genes and Genomes (KEGG)categories are enriched by hypergeometric (FDR-adjusted P value < 0.05). Table S6 in the supplemental material for all enriched GO and KEGG categories and their corresponding P values. Table 3. The representative GO and KEGG functional enrichment of eleven conserved high-influential modules.
-
The characteristics of regulatory networks can be related to the degree of a node and the number of links that a node shares with nodes of a higher degree. It is commonly believed that nodes of a higher degree are more important and form the core of the network. We further analyzed network characteristics of two selected high-influential modules, HM5 (related to lung injury and fibrosis) and HM8 (related to immune response). At 1 dpi, the highly connected genes (hub genes) in HM5 networks were Col5a2, Col1a1, Col6a1, and Col11a2 in PBS-treated group or Col3a1 and Col6a2 in UV-RSV group; but in HM5 network at 4 dpi, the sixteen hub genes including Col3a1, Col5a2, Col1a2 and P4ha3 existed in PBS-treated group and the seventeen hub genes including Col5a1, Col1a2 Col1a1 Col3a1 and Plod2 in UV-RSV vaccinated group (Supplementary Fig. S1, up). For HM8 network, the twenty-two or thirty-two hub genes were observed in PBStreated or UV-RSV vaccinated group at 1 dpi, respectively. However, at 4 dpi, the number of the hub genes was twenty-two genes in the PBS-treated group or twenty-five genes in the UV-RSV group, respectively (Supplementary Fig. S1, down).
To verify the transcriptome data, eight selected genes (Col4a1, Col5a1, Col5a2, Col6a1, Cxcr2, Ptafr, Fpr1, Lilrb4a) were confirmed by RT-qPCR. Data showed that the mRNA expression levels of these genes were consistent with those determined from the transcriptome sequencing data (Fig. 6). Therefore, the DE genes database from transcriptional sequencing is reliable and may be further investigated.

Figure 6. Quantitative RT-PCR analysis of selected genes. Both gene expression levels from RNA sequencing data and quantitative values by RT-qPCR were shown. The glyceraldehyde-3-phosphate dehydrogenase (GAPDH) gene was used as an internal control, and the relative expression level of each gene was calculated by comparative 2-△△CT method. Data were presented as mean ± SD of five individual mice from two independent experiments.
-
So far, there is no licensed RSV vaccine for clinical use. The VED induced by inactivated RSV is a major obstacle to develop efficacious vaccines. Understanding the mechanisms of the RSV pathogenesis and the host response to RSV infection is important for the development of RSV vaccines. In this study, we first established an RSV vaccination-challenge mouse model and investigated the host immune response to RSV infection and immunopathology induced by inactivated RSV. Then, we performed a systematic analysis of the gene expression profiles in mouse lungs after RSV infection for 6 days, and described the dynamic host responses to RSV infection and VED immunopathology.
Previous studies demonstrated that the VED induced by inactivated RSV was ascribed to unbalanced, skewed Th2- type immune responses upon RSV challenge (Waris et al.1996). Some cytokines regulated immune responses by promoting the differentiation of T cell subsets and Treg cells, which could prevent Th2-biased immune responses during RSV infection (Durant et al. 2013; Yang et al.2020). In our study, the significantly higher expression levels of IL-4, IL-5, IL-10 and TNF-β in lungs of UV-RSV vaccinated mice were observed at four time points; in contrast, cytokines IL-6 and IL-17 were significantly lower in vaccinated mice. Compared to PBS-treated mice, the concentration of Th1 cytokines IFN-γ and IL-2 were significantly higher in vaccinated mice from 1 to 4 days after RSV infection. For the CD4+ T cells, a similar percentage of Treg, Th1 or Th2 among total CD4+ T cells was observed in PBS-treated and vaccinated groups at early time-points (1 and 2 dpi). At 4 and 6 dpi, there was a significantly higher proportion of Th1 or Th2 in lungs of vaccinated mice compared to that of PBS controls, indicative of a mixed Th1- and Th2-type response; but the percentage of Treg cells always kept at a low level in vaccinated mice from 1 to 6 dpi. Previous reports showed that Treg cells played a central role in preventing immunopathology induced by RSV infection by dampening pathological effector T cell responses and limiting Th2- type immune responses (Durant et al. 2013; Li et al. 2016). These results suggested that differentiation and activation of different CD4+ T cell subsets appeared prior to the changes of cytokine secretion. Our results first revealed the dynamic expression characteristic of different cytokines. In addition, we only employed BALB/c mice as an animal model in this study. Other mouse strains such as C57BL/6 (Gueders et al. 2009) should be used to investigate potentially different immune and transcriptome responses.
Dynamic data-driven meta-analysis of vaccinationchallenge mouse model will facilitate the understanding of the molecular pathogenesis of RSV vaccine-enhanced disease. Here, we generated the dynamic transcriptome data of lungs from UV-RSV vaccinated and PBS-treated mice from 1 to 6 dpi. We constructed dynamic networks by integrating DE gene expression data into PPI data and identified eleven high-influential modules in networks using ClusterONE algorithm (Nepusz et al. 2012) and a model-based framework (Li et al. 2015). The specific DE gene expression pattern and differential network characteristics were observed in vaccination-challenge mice. For PBS-treated mice, the minimum number of DE genes was observed at 4 dpi; but in UV-RSV vaccinated mice, the number of DE genes reached peak values at 4 dpi (Fig. 4A). However, the least overlapping DE genes between PBS-treated and UV-RSV vaccinated mice existed at 4 dpi (Fig. 4B).
Transcriptome analyses have been employed to investigate the functions of genes, host response to pathogens, and viral pathogenesis (Liu et al. 2017; Peng et al. 2011; Xue et al. 2014). Analysis of transcriptome profile showed that the maximum number of DE genes was clustered in Cluster 1 (up-regulated expression of both conditions) (Fig. 4C). Interestingly, these up-regulated transcripts were observed at early infection in PBS-treated mice, but at late infection in UV-RSV vaccinated mice (Fig. 4C). The genes were functionally enriched for immune and inflammatory response, apoptotic process, the extracellular matrix, and antigen processing and presentation (Table 2), suggesting that mice vaccinated with inactivated RSV resulted in delayed immune responses to RSV infection.
Network-based approaches are widely used to identify normal and disease states by exploring dynamic and network information of omics data from both animal models and clinical samples (Chen et al. 2012; Jin et al. 2014; Yang et al. 2018). We recognized eleven high-influential modules (HMs) (Table 3 and Supplementary Table S5) by network-based approaches. The genes in the HMs exhibited down-regulated expression in UV-RSV vaccinated mice at early RSV infection (Fig. 5). Our previous studies demonstrated that co-expression of immune regulators resulted in induction of balanced immune response to RSV, alleviating vaccine-enhanced disease (Yang et al. 2020; Zhang et al. 2016). By analyzing regulatory networks of two representative high-influential modules (HM5 and HM8), we identified that for HM5 associated with functions of the extracellular matrix (ECM), hub genes mainly existed at late infection. Dysregulation of the ECM composition and structure was closely related to some human diseases including fibrosis (Bonnans et al. 2014). In contrast, for HM8 associated with immune response and antigen processing and presentation, most of the hub genes encoded classical major histocompatibility complex class II (MHC-II) molecules. MHC-II presents antigens to CD4+ T cells, which is critical for the expansion and function of CD4+ T cells during host immune responses (Takeda et al.1996). The hub genes in HM8 were tightly co-regulated at one dpi in UV-RSV vaccinated groups (Supplementary Fig. S1). These results indicated that the regulatory networks associated with immunopathology functionally activated at late infection in both conditions. Actions of regulatory networks related to immune response initiated at one dpi in both conditions, but it was to a certain extent inhibited at late infection in vaccinated mice.
Taken together, our results provide valuable information to our understanding of immunopathology and antiviral immune responses by inactivated RSV vaccination. These findings could contribute to the development of novel RSV vaccines and the potential therapeutic interventions for RSV infection.
Kinetics of Pulmonary Viral Load and Pathology in RSV Vaccination-Challenge Mouse Model
CD4+ T Cell Subsets and Cytokines Profiles in the Lungs of RSV Vaccination-Challenge Mouse Model
The Global Transcriptional Profiles and GO Functional Enrichments
Co-Expression Networks of DE Genes and HighInfluential Modules (HMs)
Topological Analyses of HM5 and HM8 and Verification of Selected Genes Using RT-qPCR
Discussion
-
This work was supported by the National key R & D program of China (2017YFA0505801), and the National Natural Science Foundation of China (11831015).
-
ZP and YZ designed the experiments. YZ and JY carried out the experiments. CM, YZ and ZP analyzed data. YZ, XZ and ZP wrote the paper. All authors read and approved the final manuscript.
-
The authors declared no conflicts of interests.
-
All animal studies were approved by the Institutional Animal Care and Use Committee of Wuhan University.


 DownLoad: