


HTML
-
Baculovirus has a double-stranded circular DNA genome with the size ranging from 80 to 180 kilo base pairs (kbs) and encodes 89–181 viral proteins (Rohrmann 2019). For most baculoviruses, two different phenotypes of virus particles, budded viruses (BVs) and occlusion-derived viruses (ODVs), were produced during their life cycle. BVs were formed by budding from infected cells and mediate the viral transmission from cell to cell (systemic infection). ODVs were embedded in the occlusion bodies (OBs) and released to environment after the death of the larvae, which initiated midgut epithelial infection (per os infection) when digested by a susceptible host and spread the virus from insect to insect (Rohrmann 2019; Wang and Hu 2020). Baculoviruses had been widely used as vectors to express high level of foreign proteins in insect cells (Chambers et al. 2018; Martinez-Solis et al. 2019), and as biological insecticides to control agricultural/forestry pests (Popham et al. 2016a; Popham et al. 2016b; Sun 2015), they were also potential gene therapy vectors to deliver genes to target cells or tissues (Liu et al. 2017; Ono et al. 2018; Wang et al. 2013).
The genome of baculovirus was large and not easy to manipulate in vivo or in vitro. Initially, homologous recombination between the viral genome and a donor plasmid was performed to generate recombinant Autographa californica multiple nucleopolyhedrovirus (AcMNPV) in insect cells (Pennock et al. 1984; Smith et al. 1983). However, the low efficiency of recombination limited the application of the Baculovirus Expression Vector System (BEVS). To overcome the disadvantage, linearized viral genome was used to recombine with a donor plasmid and the efficiency was improved significantly (Kitts et al. 1990). Another vector with the essential gene orf1629 interrupted during the linearization and the missing sequences would be reverted after recombination between a transfer vector and linearized viral DNAs, this made the generation of recombinant virus at frequencies approaching 100% (Kitts and Possee 1993). Later, a bacmid which contained the baculovirus genome and elements for replication maintained in E.coli was a breakthrough for the BEVS (Luckow et al. 1993). The bacmid could replicate in E. coli cells and the foreign gene could be easily inserted into it by transposition, and it has been commercialized as the Bac-to-Bac system (Luckow et al. 1993). Simplified operation, easy detection, convenient extraction of genome DNA and high recombination efficiency have made Bac-to-Bac system very popular and it has been developed for several other baculovirus species (Choi et al. 1999; Motohashi et al. 2005).
With the development of synthetic biology, we recently synthesized AcMNPV genome by using transformation associated recombination (TAR) in yeast. The synthesized genome contained the complete sequence of AcMNPV except for the hr4a locus that was replaced with the bacterial and yeast artificial chromosomal elements and an egfp gene. The synthetic virus AcMNPV-WIV-Syn1 was successfully rescued from insect cells and showed similar biological characteristics compared to that of the wild-type AcMNPV (Shang et al. 2017). The artificial synthesis platform makes it easy to manipulate the baculovirus genome at multiple sites simultaneously. For example, it has been used to study the components and assembly of per os infectivity factor (PIF) complex (Wang et al. 2019).
Here, we reported the construction and characterization of a novel AcMNPV bacmid, AcBac-Syn, based on the previous synthesized AcMNPV-WIV-syn1. The AcBacSyn contained transposon attaching sites attTn7 for inserting foreign genes, and a red fluorescent gene Dsred was tested by transposition using conventional Bac-to-Bac technique (Luckow et al. 1993). The rescued virus was characterized in comparison with the wild-type virus AcMNPV-WT. The results confirmed AcBac-Syn could be readily used for foreign gene expression. The differences between the AcBac-Syn and the conventional AcMNPV bacmids were discussed.
-
Saccharomyces cerevisiae strain VL6-48N (MAT alpha, his3-Δ200, trp1-Δ1, ura3-Δ1, lys2, ade2-101, met14), E. coli strain EPI300 carrying an inducible trfA gene, and the TAR cloning vector pGF containing a His marker genes and essential elements of yeast artificial chromosome (YAC) and bacterial artificial chromosome (BAC), were obtained from the Laboratory of Virus Biochemistry of the Wuhan Institute of Virology, Chinese Academy of Sciences (Hou et al. 2016). AcMNPV-WT was from Microorganisms & Viruses Culture Collection Center (MVCCC) of the Wuhan Institute of Virology, Chinese Academy of Science, and AcMNPV-WIV-Syn1 was previously synthesized using the AcMNPV-WT as the parental virus (Shang et al. 2017). The synthetic AcMNPVWIV-Syn1, is 145, 299 bp comprising the complete genome of AcMNPV except for the hr4a locus that was replaced with an ~ 11.5 kb cassette of bacterial and yeast artificial chromosomal elements and an egfp gene. AcBac, an AcMNPV bacmid, was from the commercial Bac-to-Bac system (Invitrogen) (Luckow et al. 1993). AcBac-egfp-ph, a previously constructed recombinant AcMNPV containing egfp gene and polyhedrin (ph) gene by Bac-to-Bac system (Shang et al. 2017), was used as a control. The Sf9 insect cell line, originally generated from the fall armyworm Spodoptera frugiperda (Vaughn et al. 1977) was maintained at 27 ℃ in Grace's medium supplemented with 10% fetal bovine serum (Gibco).
-
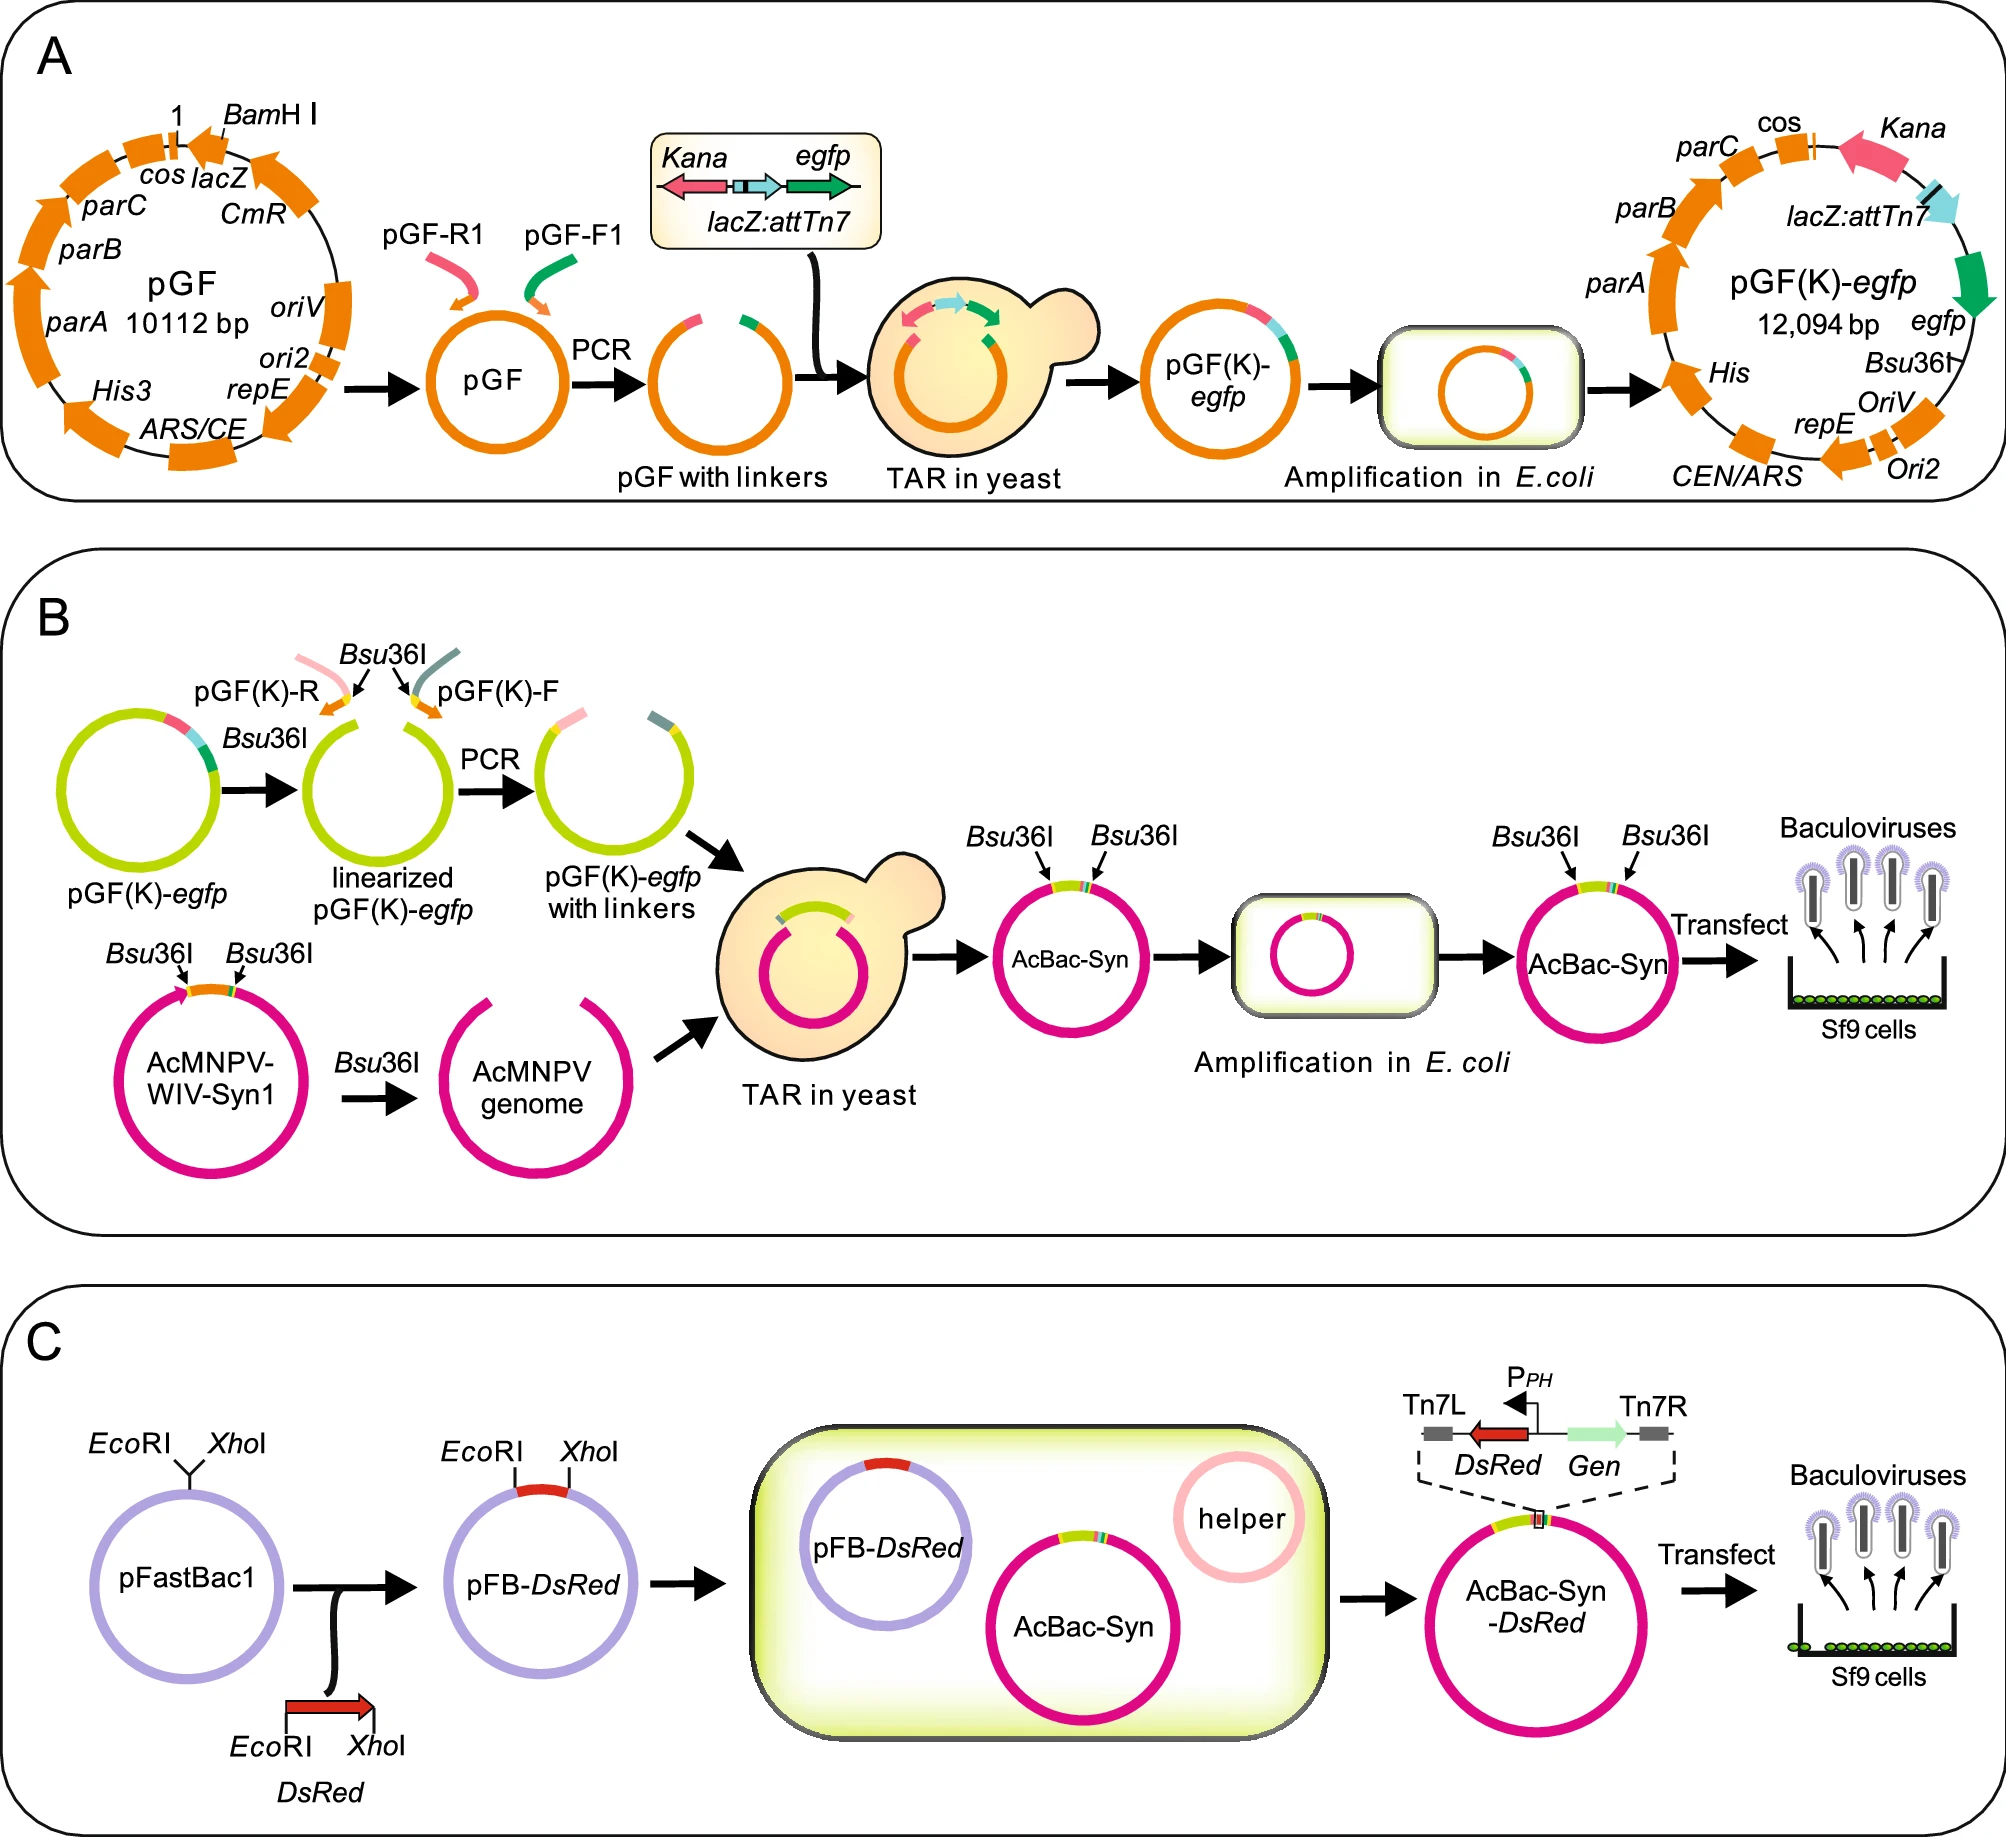
To construct a AcMNPV bacmid, a modified vector pGF(K)-egfp was derived from pGF where the fragment containing LacZ gene and chloramphenicol resistance gene (CmR) of pGF were replaced with a cassette containing a kanamycin resistance gene (KanR), a LacZ:attTn7 gene and an egfp gene. This was realized through TAR in yeast as performed in Fig. 1A. First, the cassette was constructed by overlapping PCR using two PCR fragments, one fragment containing KanR and LacZ:attTn7 was amplified from AcBac, and another fragment containing egfp gene was amplified from AcBac-egfp-ph. In the meantime, the vector pGF was amplified and two ends were added by PCR with primers pGF-F-Bac1 and pGF-R-Bac1 (Supplementary Table S1). The cassette and PCR-generated linearized vector were co-transformed to the protoplast of S. cerevisiae strain VL6-48N as described (Shang et al. 2017). The assembled plasmid was extracted from yeast cells and identified by PCR. Then the positive plasmids were used to transform E. coli EPI300 for further amplification. The plasmids extracted from E. coli EPI300 were confirmed by Sanger sequencing and the correct plasmid was named pGF (K)-egfp.
Figure 1. Construction of pGF(K)-egfp, AcBac-Syn and AcBac-Syn-Dsred. A The flow diagram of construction of plasmid pGF(K)-egfp from plasmid pGF. The vector pGF was linearized and two ends were added by PCR with primers pGF-F-Kan and pGF-R1-egfp. The cassette of KanR, LacZ:attTn7 and egfp was co-transformed with the linearized vector to yeast cells to generate plasmid pGF(K)-egfp. The plasmid was further amplified in E. coli. B The flow diagram of construction of AcBac-Syn genome. The plasmid pGF(K)-egfp was linearized by restriction endonuclease Bsu36I and two end was added by PCR using primers pGF(K)-F-Bac and pGF(K)-R-Bac. Then the linearized vector and the Bsu36I digested AcMNPV-WIV-Syn1 genome were used to co-transform yeast cells to assemble into AcBac-Syn genome. After amplification in E. coli, the AcBac-Syn genome was extracted and transfected to the Sf9 cells to produce progeny baculoviruses. C The flow diagram of construction of AcBac-Syn-Dsred. The open reading frame (ORF) of Dsred was inserted into the downstream of polyhedrin promoter (PPH) of plasmid pFastBac1 through the digestion of restriction endonuclease EcoRI and XhoI and the adapter ligation of T4 DNA ligases. Then the plasmid was transformed to the E. coli cells containing the AcBacSyn genome and the helper plasmid encoding the transposase, to generate recombinant bacmid AcBac-Syn-Dsred. The bacmid DNA was extracted and transfected to the Sf9 cells to produce progeny recombinant baculovirus.
Synthesis of the new bacmid genome was conducted by TAR in S. cerevisiae as outlined in Fig. 1B. First, amplified AcMNPV-WIV-Syn1 DNA extracted from E. coli was digested with Bsu36I to generate the genome fragment, which contained all sequences of AcMNPV-WT except the hr4a sequences (Shang et al. 2017). Simultaneously, the vector pGF(K)-egfp was linearized with Bsu36I, and two "hook" sequences were added to each end of the vector by PCR using primers pGF(K)-F and pGF(K)-R (Supplementary Table S1). Then, the genome fragment and the vector with "hook" sequences were co-transformed to the protoplast of S. cerevisiae as described to assemble the new bacmid, named AcBac-Syn. PCR and sequencing were carried out on the synthetic bacmid AcBac-Syn to ensure that the synthetic genome was correct.
To test if AcBac-Syn can be used as a bacmid for efficient insertion and expression of foreign genes, the Dsred gene encoding a red fluorescent protein was inserted to the AcBac-Syn bacmid using the method as described in Bacto-Bac transposition protocol (Luckow et al. 1993) (Invitrogen) to generate the genome of AcBac-Syn-Dsred (Fig. 1C). Briefly, the Dsred gene was synthesized by BioTransduction Lab Co. Ltd. (Wuhan, China) and inserted into the plasmid pFastBac1 (Invitrogen) at the BamHI and XhoI site to generate the donor plasmid pFastBac-Dsred. the E. coli EPI300 cells were transfected with AcBac-Syn bacmid, helper plasmid and plasmid pFastBac-Dsred, and were cultured on Luria Agar plates containing 50 μg/mL kanamycin, 7 μg/mL gentamicin, 10 μg/mL tetracycline, 100 μg/mL X-gal and 40 μg/mL IPTG for 24–48 h at 37 ℃. The DNA of white colonies from the plate was extracted and the recombinant genome of AcBac-Syn-Dsred was detected.
-
The E. coli EPI300 containing AcBac-Syn or AcBac-egfp-ph was cultured overnight with and without the presence of CopyControl Induction Solution (CopyControl, Epicentre). Three mL of each E. coli culture (OD600 value of 1.8) were collected. Then total DNA was extracted and resuspended in 100 μL of water. Quantitative PCR was performed using the gp64-based primer pairs (50-tgttctccatggtggttatgaggttg- 30 and 50-atctacaaagaagggcgttgggtg-30) as previously described (Li et al. 2018). The standard curve was generated according to the Ct values of series concentration of virus genome (109, 108, 107, 106, 105, 104, 103 and 102 copies/μL). Based on the standard curve, virus genome copies were calculated.
-
The DNAs of AcBac-Syn and AcBac-Syn-Dsred were isolated from E. coli by using the Instruction Manual of Bac-to-BacTM System (Life Technologies). Five μg of each DNA were transfected into Sf9 insect cells by using Cellfectin (Invitrogen). The fluorescence of the cells was observed at different hours post transfection (hpt) and images were taken at 24, 48 and 72 hpt. Supernatant fluids from the transfections were collected at 120 hpt and used to infect Sf9 cells. Progeny viruses in supernatant fluids were collected at 120 h post infection (hpi) and titrated by end-point dilution assay (EPDA).
-
Sf9 cells were infected with BVs of AcBac-Syn, AcBacSyn-Dsred, AcMNPV-WT, AcMNPV-WIV-Syn1, and AcBac-egfp-ph at a multiplicity of infection (MOI) of 5. Progeny viruses in supernatant fluids were collected at 0, 12, 24, 48, 72 and 96 hpi and titrated by EPDA.
-
Purified OBs of AcBac-Syn, AcMNPV-WT and AcBacegfp-ph were used for observation by electron microscopy as previously described (Shang et al. 2017).
-
Sf9 cells (3 × 10⁶) were infected with BVs of AcBac-Syn, AcBac-Syn-Dsred, AcMNPV-WT, AcMNPV-WIV-Syn1, and AcBac-egfp-ph at an MOI of 5. The cells were harvested at 72 hpi, and the samples were separated by sodium dodecyl sulfate polyacrylamide gel (SDS-PAGE) electrophoresis and then transferred onto PVDF membranes (Millipore Corporation, USA). The membranes were incubated with primary antibodies against AcMNPV Polyhedrin (anti-PH) (Wang et al. 2018), ODV-E25 (Wang et al. 2010) or anti-GAPDH (Li et al. 2018), followed by a further incubation with horseradish peroxidase (HRP)- conjugated goat anti-rabbit IgG (Sigma). The protein bands were visualized in the MicroChemi machine (DNR BioImaging Systems) with the SuperSignal West Pico PLUS Chemiluminescent Substrate (Thermo SCIENTIFIC) reagents.
-
The occlusion bodies of AcMNPV-WT and AcBac-Syn purified from the infected larvae were assayed in third instar S. exigua larvae by droplet feeding. Larvae were exposed to 3 × 10⁸, 1 × 10⁸, 3 × 10⁷, 1 × 10⁷, 3 × 10⁶, 1 × 10⁶ OBs/mL. Twenty-four larvae were used for each dilution and checked daily for mortality.
-
For statistical analysis of the genome copy numbers and the growth curves, all the experiments were performed in triplicate. The significance was determined by Student's t test using the SPSS v16 software, and P value of < 0.05 was considered statistically significant (*P < 0.05). For statistical analysis of the median lethal concentration (LC50), two replicates of oral infection assays were carried out for each virus. LC50 values were calculated using the computer program POLO and compared by paired-sample t test (SPSS v16); it was considered statistically significant when the 95% confidence interval (95% CI) of potency ratio value did not include 1.0.
Cells, Virus Strains and Plasmids
Synthesis of AcBac-Syn and AcBac-Syn-Dsred
Comparison of Genome Copy Numbers of AcBacSyn and AcBac-egfp-ph in E. coli
Transfection and Infection Assays
One-Step Growth Curves
Electron Microscopy
Western Blot Assay
Bioassay
Statistical Analysis
-
The bacmid AcBac-Syn was constructed as described in Materials and Methods. Briefly, plasmid pGF(K)-egfp was first constructed by substituting the CmR and lacZ genes of pGF plasmid with a cassette of KanR, lacZ:attTn7, and egfp genes (Fig. 1A). Then the linearized pGF(K)-egfp and Bsu36I digested AcMNPV-WIV-Syn1 were assembled by TAR in yeast to generate AcBac-Syn (Fig. 1B). The AcBac-Syn is 145.9 kb in size and its complete genome sequence is deposited in GenBank with accession number MW893240.
To demonstrate how to use AcBac-Syn for foreign gene insertion and expression, Dsred was inserted into the AcBac-Syn by transposition as described in Materials and Methods using commercially available vector pFastBac and transposase provided by helper plasmid (Fig. 1C). The resulting bacmid AcBac-Syn-Dsred contained Dsred under polyhedrin promoter and gentamicin resistance gene (GenR) at the attTn7 site (Fig. 1C). The original egfp in AcBac-Syn was still retained in AcBac-Syn-Dsred. The correct insertion of AcBac-Syn-Dsred was confirmed by PCR and sequencing (data not shown).
-
One of the major differences between AcBac-Syn and the conventional AcMNPV bacmids is that the former induces high copy number of DNA. The pGF(K)-egfp contains two replication origins, ori2 and oriV, responsible for DNA replication in E. coli cells. In the presence of product of trfA gene, genomic DNA replicates from oriV and produce high-copy number; otherwise, genomic DNA replication starts from ori2 at a single-copy number. The E. coli EPI300 strain cells contain an inducible trfA gene, and by adding inducer the DNA copy number of AcBac-Syn could be significantly increased. We compared the genome copy numbers of AcBac-Syn with that of AcBac-egpf-ph which was constructed based on the commercial Bac-to-Bac system (Luckow et al. 1993). As shown in Fig. 2, without inducer CopyControl, the total copy number of AcBac-Syn and AcBac-egfp-ph DNA were 2.57 × 10⁹ and 3.0 × 10⁹, respectively in 3 mL E. coli culture, and there was no significant difference between them (P>0.05); but in the present of CopyControl, the DNA copies of AcBac-Syn (5.99 × 10⁹) was significantly higher than that of AcBacegfp-ph (1.86 × 10⁹) (P < 0.05). The result confirmed that AcBac-Syn is a copy number inducible bacmid in E. coli EPI300.
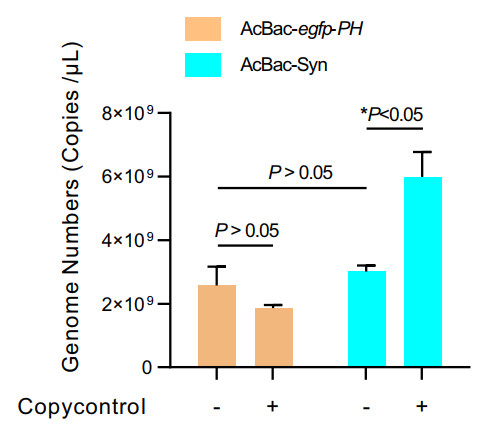
Figure 2. Comparison of DNA copy numbers of AcBac-Syn and AcBacegfp-ph in E. coli. The E. coli EPI300 containing AcBac-Syn or AcBac-egfp-ph was cultured overnight with or without the presence of CopyControl Induction Solution (CopyControl, Epicentre). Total DNAs of 3 mL each E. coli culture (OD600 value 1.8) were extracted and suspended in 100 μL water. Quantitative PCR was performed to detect the AcBac-egfp-ph or AcBac-Syn DNA copy numbers. The copy numbers were the average value from three independent infections. Error bars represent standard deviations. *P < 0.05, P > 0.05 means no significant difference.
-
To rescue viruses from bacmids, transfection and infection assays were performed. At 24 hpt, a few of the Sf9 cells transfected with bacmids of AcBac-Syn and AcBac-Syn-Dsred produced green fluorescence; the green fluorescence increased at 48 hpt and could be observed in most cells at 72 hpt (Fig. 3A). The red fluorescence appeared in the AcBac-Syn-Dsred transfected cells at 48 hpt and increased at 72 hpt (Fig. 3A). The supernatants from the transfections of AcBac-Syn and AcBac-Syn-Dsred were collected at 120 hpt and used to infect the Sf9 cells. A mock infection and infections by the viruses of AcMNPV-WT, AcMNPV-WIV-Syn1 and AcMNPV-egfp-ph (control) were performed. At 72 hpi, almost all the cells infected with AcBac-Syn, AcBac-Syn-Dsred, AcMNPV-WIV-Syn1 and AcMNPV-egfp-ph showed green fluorescence, and the cells infected with AcBac-Syn-Dsred also produced red fluorescence. The typical cytopathic effect of hypertrophied nuclei and OBs appeared in the cells infected with all the viruses (Fig. 3B). These data proved that AcBac-Syn could produce infectious virus, and the inserted foreign gene (e.g. Dsred) could be expressed in Sf9 cells.

Figure 3. Transfection and infection assays and single-step growth curve analysis. A Transfection of Sf9 insect cells with AcBac-Syn and AcBac-Syn-Dsred. The images were taken at 24, 48 and 72 hpt. Scale bars are presented as 200 μm. B Cytopathic effects of Sf9 cell after virus infection. Sf9 Cells were infected with AcBac-Syn, AcBac-Syn-Dsred, AcMNPV-WT, AcMNPV-WIV-Syn1 and AcBac-egfp-ph at an MOI of 5, or mock infected. Images were taken at 72 hpi. Nuclei were stained with DAPI. Scale bars are presented as 20 μm; C Onestep growth curves. The Sf9 cells were infected with AcBac-Syn, AcBac-Syn-Dsred, AcMNPV-WT, AcMNPV-WIV-Syn1 and AcBacegfp-ph at an MOI of 5; the supernatants were collected at 0, 12, 24, 48, 72 and 96 hpi, and titrated by EPDA. The titer, transformed logarithmically, was the average titer from three independent infections. Error bars represent standard deviations.
-
To investigate the proliferation property of AcBac-Syn in Sf9 cells, one step growth curves of AcBac-Syn, AcBacSyn-Dsred, AcMNPV-WT, AcMNPV-WIV-Syn1, and AcBac-egfp-ph were detected. All the viruses had identical kinetics of infection in which a logarithmic phase lasted up to 48 hpi and a stationary phase continued from 48 to 96 hpi (Fig. 3C). Statistical analysis results indicated that there was no significant difference between the titers of the five viruses at each time point (P > 0.05).
To compare the morphology of OBs among AcBac-Syn, AcBac-egfp-ph and AcMNPV-WT, the OBs of all the viruses were purified from the infected S. exigua larvae and observed by scanning electron microscope (SEM) and transmission electron microscopy (TEM). SEM results showed that the OBs of both viruses had smooth surface and polyhedral shape, and the sizes of OBs from different viruses were similar (Fig. 4). TEM results showed that like control viruses, OBs of AcBac-Syn contained multiple matured (enveloped) ODVs (Fig. 4). So morphologically the OBs of AcBac-Syn were similar to that of the control viruses.
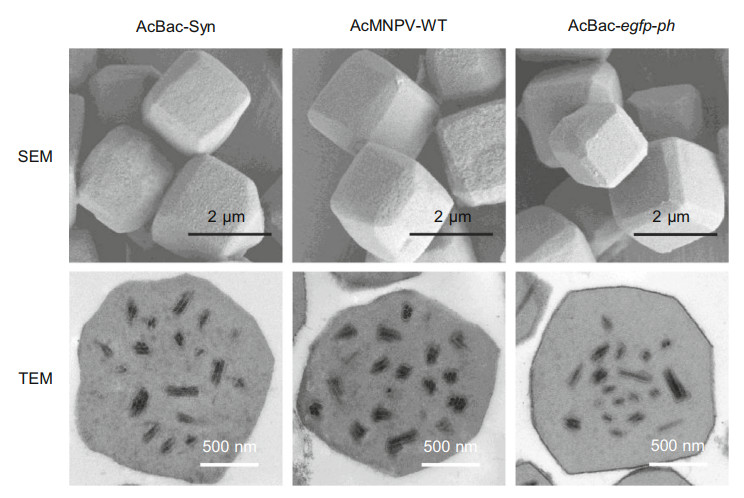
Figure 4. Electron micrographs of OBs of AcBac-Syn, AcMNPVWT and AcBac-egfp-ph. After one round of replication in S. exigua larvae, the OBs of AcBac-Syn, AcMNPV-WT and AcBac-egfp-ph were purified and processed for SEM and TEM observation. Scale bars are presented as 2 μm (SEM) and 500 nm (TEM), respectively.
The oral infection assay of AcBac-Syn and AcMNPVWT was performed in third instar S. exigua larvae. The LC50 for AcBac-Syn and AcMNPV-WT were 8.90 × 10⁶ OBs/mL and 1.69 × 10⁷ OBs/mL, respectively (Table 1). Potency ratio value, performed by dividing the LC50 of the AcBac-Syn by that of AcMNPV-WT, was 1.78 with the 95% confidence interval (95% CI) from 0.93 to 3.66. The 95% CI of potency ratio included 1.0, which indicated that there was no significant biological difference between the two viruses.
Virus LD50(95% CI)
(106 OBs/mL)Slope(95% CI) χ2/d.f Potency ratioa(95% CI) AcMNPV-WT 16.91(9.85–39.86) 0.85(0.58–1.13) 0.64 1.78(0.93–3.66) AcBac-Syn 8.90(5.66–16.20) 0.91(0.65–1.18) 0.39 aPotency ratio was calculated by dividing the LC50 value of the AcBac-Syn by that of AcMNPV-WT. Table 1. Oral infection analysis of AcMNPV-WT and AcBacSyn.
-
To evaluate OBs production of AcBac-Syn, Sf9 cells were infected by the BV of AcBac-Syn, AcBac-Syn-Dsred, AcMNPV-WT, AcMNPV-WIV-Syn1, and AcBac-egfp-ph at the dose of 5 MOI, respectively. The formation of OBs was observed at 72 hpi, and the results showed that almost all cells produced OBs in nuclei when infected by AcBacSyn, AcBac-Syn-Dsred, AcMNPV-WT and AcMNPVWIV-Syn1, however, only a few AcBac-egfp-ph infected cells formed OBs (Fig. 5A). At 96 hpi, the infected cells were harvested and the polyhedrin protein (PH) was detected by Western blot. In agreement with the above observation, the yields of PH in the AcBac-Syn, AcBacSyn-Dsred, AcMNPV-WT and AcMNPV-WIV-Syn1 infected cells were comparable and significantly higher than that in AcBac-egfp-ph infected cells (Fig. 5B). Therefore, in terms of the yields of OB and PH, the AcBacSyn virus was comparable to AcMNPV-WT, and better than AcBac-egfp-ph.
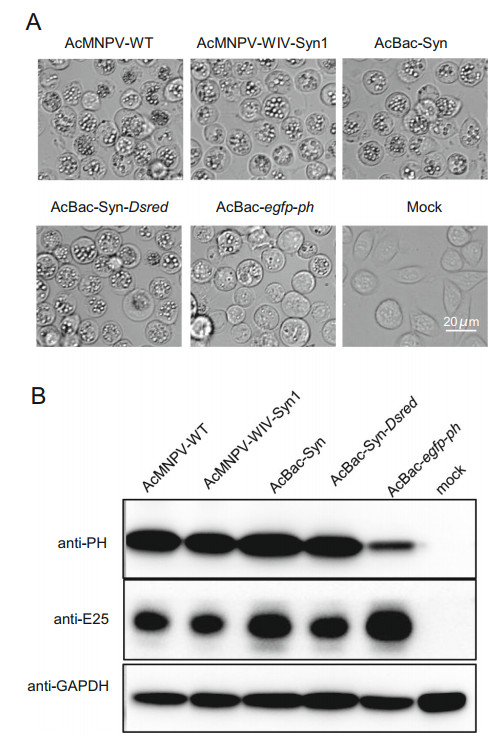
Figure 5. Polyhedrin production in AcBac-Syn, AcBac-Syn-Dsred, AcMNPV-WIV-Syn1, AcMNPV-WT and AcBac-egfp-ph infected Sf9 cells. A Image of cells at 96 hpi. 3 × 10⁶ Sf9 cells were infected with BVs of AcBac-Syn, AcBac-Syn-Dsred, AcMNPV-WT, AcMNPV-WIV-Syn1 and AcBac-egfp-ph at an MOI of 5, or mock infected. Scale bars are presented as 20 μm. B Detection of polyhedrin protein by Western blot analysis. 3 × 10⁶ Sf9 cells were infected with BVs of AcBac-Syn, AcBac-Syn-Dsred, AcMNPV-WT, AcMNPV-WIV-Syn1 and AcBac-egfp-ph at an MOI of 5, or mock uninfected. The cells were harvested at 72 hpi and Western blot assay was performed. Antibodies against AcMNPV Polyhedrin (anti-PH), ODV-E25 (anti-E25) or anti-GAPDH were used as primary antibodies, and horseradish peroxidase (HRP)-conjugated goat anti-rabbit IgG (Sigma) was used as secondary antibody.
Construction of Bacmids AcBac-Syn and AcBacSyn-Dsred
Comparison of Genome Copy Numbers of AcBacSyn and AcBac-egfp-ph in E. coli
Transfection and Infection Assays
The Virus AcBac-Syn has Similar Properties with Wild-Type Virus AcMNPV-WT
The Production of OBs and Polyhedrin Protein of AcBac-Syn is Comparative to Those of AcMNPV-WT, but Significantly Higher Than Those of AcBac-egfp-ph
-
In this study, we described the modification of the synthetic AcMNPV-WIV-Syn1 (Shang et al. 2017) into a novel bacmid AcBac-Syn. The results showed that the recovered virus AcBac-Syn has similar biological properties to AcMNPV-WT in terms of BV production, OB production and oral infectivity. By inserting Dsred using conventional Bac-to-Bac method, it is demonstrated that the AcBac-Syn can be readily used for foreign gene insertion and expression.
The main differences between AcBac-Syn and the commercial bacmid (e.g. AcBac) were as follows. First, the vector cassette of AcBac-Syn contains the elements of YAC and BAC, marker genes KanR, His, egfp and lacZ:attTn7; while the vector cassette of AcBac contains only bacterial replicon miniF, marker genes KanR and lacZ:attTn7 (Luckow et al. 1993). Second, unlike AcBac, the DNA copy number of AcBac-Syn is inducible. Third, in AcBac-Syn, the vector cassette was inserted into the non-coding hr4a locus and retains the native ph; while in the AcBac, the vector cassette was inserted into the ph locus and the bacmids are ph-. These properties provide AcBac-Syn some advantages over the commercial bacmid.
For example, the egfp is already included in AcBac-Syn which provides an indicating marker for transfection and infection assays. The conventional AcMNPV bacmids do not contain such a marker, and normally egfp has to be added by transposition when the bacmids are used for lostof-function studies of target genes.
AcBac-Syn is a DNA copy inducible bacmid, by adding inducer to E. coli EPI300, higher copy numbers of bacmid DNA can be harvested than that from a conventional AcMNPV bacmid as demonstrated in Fig. 2. As the quantity and quality of bacmid DNA is critical for the success of transfection, this provides AcBac-Syn an advantage for rescuing recombinant viruses.
More importantly, by retaining the native ph gene in its genome, AcBac-Syn is more attractive than the traditional AcMNPV bacmids for studying baculovirus gene functions, especially for those genes related to OB assembly, oral infection or function in host insects. For a conventional AcMNPV bacmid, the ph gene was replaced by a cassette containing a MiniF replicon, KanR and LacZ:attTn7 (Luckow et al. 1993). PH forms the protein matrix of OB and when it is deleted, no OB is formed, and the virus lost its ability for oral infection. Therefore, when these bacmids are used for OB related functional study, ph gene is normally re-inserted by transportation. However, as shown in Fig. 5, the re-introduced PH in AcBac-egfp-ph was expressed at a lower level than the native proteins in AcMNPV-WT or AcBac-Syn. The lower expression of reintroduced PH in the conventional bacmids had been commonly noticed (Fig. 5), it is likely due to the impact of the adjacent sequences on the PH expression.
We need to point out that conventional AcMNPV bacmids also have advantages comparing to AcBac-Syn. For example, for high expression of foreign genes in cell culture, the conventional AcMNPV bacmids are expected to have higher yield than AcBac-Syn due to the deletion of ph gene which normally overexpressed at the late stage of the infection.
In summary, a novel bacmid AcBac-Syn was successfully generated, which has different characterizations from the conventional AcMNPV bacmids. The virus derived from the AcBac-Syn had similar biological properties to the wild-type virus. It has obvious advantages in functional research of baculovirus genes, especially for the OB related functions.
-
This work was supported by the grants from the National Science Foundation of China (Grant Nos. 31800143 and 31872640), the Key Research Program of Frontier Sciences of the Chinese Academy of Sciences (Grant No. QYZDJ-SSW-SMC021), and the Hubei Provincial Innovation Center of Agricultural Sciences and Technology (Grant No. 2019-620-000-001-017). The authors thank Ms. Lei Zhang, Ms. Bi-Chao Xu and Ms. An-Na Du of the Core Facility and Technical Support, Wuhan Institute of Virology, CAS for 454 sequencing and technical supports with TEM and SEM. We also thank the National Virus Resource Center for the virus strain.
-
YS, MW and ZH designed the experiments and interpreted the results. YS, HH and XW performed the experiments. HW and FD participated in experiment design and data analysis. YS drafted the manuscript. MW and ZH finalized the article. All authors read and approved the final manuscript.
-
The authors declare that they have no conflicts of interest.
-
This article does not contain any studies with human or animal subjects (excluding insects) performed by any of the authors.


 DownLoad: