HTML
-
Approximately 350 million people are infected with hepatitis B virus(HBV)worldwide, and over 200 million of them are in China(Poynard et al., 2003; El-Serag, 2012). Chronic infection with HBV can progress to cirrhosis, liver failure and hepatocellular carcinoma(HCC)(Poynard et al., 2003; El-Serag, 2012).
The innate immune system provides defense against viral infections. The complement system is critical for innate humoral immunity and contributes to the clearance of viral infections and lysis of enveloped virions(Song et al., 2000; Walport, 2001; Dunkelberger and Song, 2010). This system is also central to the development of inflammatory reactions(Matsushita et al., 1996; Jeong and Gao, 2008). Mannan-binding lectin(MBL) and the recently identified ficolins represent the first component of the lectin branch of the complement system(Endo et al., 1996; Sugimoto et al., 1998; Liu et al., 2005). Ficolin is a type of serum complement lectin with a structure simi-lar to MBL and lung Surfactant Proteins A(SP-A) and D(SP-D)(Matsushita et al., 1996). Both MBL and ficolins are members of the collectin family of proteins that act as pattern recognition molecules or receptors(PRRs). They are soluble oligomeric defense proteins with lectin-like activity that are able to recognize pathogen-associated molecular pattern(PAMP)carbohydrate molecules on the surfaces of pathogens, apoptotic, necrotic and malignant cells(Holmskov et al., 2003; Honore et al., 2010; Ren et al., 2014). Ficolins recognize pathogens and activate the complement system via MBL associated serine proteases(MASPs). Upon binding to their specific PAMPs, ficolins may trigger activation of the immune system either by initiating the activation of the complement system via the lectin pathway, by a primitive opsonophagocytosis or by stimulating secretion of inflammatory cytokine production by macrophages, thus limiting infection and concurrently orchestrating the subsequent adaptive immune response(Ren et al., 2014).
Three ficolins have been identified in human: ficolin-1(M-Ficolin), ficolin-2(L-Ficolin/P35) and ficolin-3(H-Ficolin)(Endo et al., 1996; Sugimoto et al., 1998; Liu et al., 2005). Ficolin-2/P35(with a molecular weight of 35 kDa)was first cloned and described as a type of lectin. Both MBL and ficolin-2 are mainly produced by the liver. Ficolin-2 and ficolin-3 predominantly exist in the serum, while ficolin-1 is produced in the lung and found in secretory granules in neutrophils and monocytes(Liu et al., 2005).
Recently, an increasing number of reports have shown that ficolin-2 can bind to viral glycoproteins and inhibit hepatitis C virus(HCV) and influenza virus infections(Pan et al., 2012; Zhao et al., 2014) and that abnormal ficolin-2 expression plays a crucial role in viral diseases(Hoang et al., 2011; Hu et al., 2013). However, the role of ficolin-2 and its dynamic changes over the course of and in the prognosis of CHB and HCC remain unclear. The aim of this study is to determine the functional roles of ficolin-2 in the pathology of chronic HBV infection, HCC and cirrhosis.
-
Serum samples from 31 CHB patients, 17 HBV carriers and 45 healthy donors were obtained from Zhongnan Hospital of Wuhan University from 2008 to 2013. Patients infected with HCV, hepatitis D virus(HDV), or human immunodeficiency virus(HIV)were excluded. The diagnoses were compiled with the diagnostic criteria of the 2000 Xi'an Viral Hepatitis Management Scheme issued by the Chinese Society of Infectious Diseases and Parasitology and the Chinese Society of Hepatology of the Chinese Medical Association(Liver Failure and Artificial Liver Group et al., 2006). A total of 31 CHB patients with abnormal alanine aminotransferase(ALT)values(> 40 IU/L) and positive HBV DNA(HBV DNA copy number > 500 copies/ml) and 17 HBV carriers with positive HBV DNA and normal ALT(≤ 40 IU/ L)were included in the study. Forty-five samples from healthy donors that had not been infected by HBV and had normal ALT values(≤ 40 IU/L)were obtained from the medical examination center of Zhongnan Hospital of Wuhan University. A total of 60 serum samples from HCC patients, 26 liver tissue specimens from HCC patients, 10 liver tissue samples from cirrhosis patients and 10 adjacent tissue specimens from HCC patients were obtained from Zhongnan Hospital of Wuhan University, Hubei Cancer Hospital and Alenabio Biotechnology Ltd(Xi'an, China)from 2005 to 2013. All subjects belonged to Chinese Han ethnic group.
-
Agents for amelioration of liver function including inosine and glucuronate were routinely given to each patient with elevated ALT until ALT levels decreased to normal. Oral doses of inosine(400 mg three times daily) and glucuronate(300 mg three times daily)were prescribed. None of the patients had received antiviral treatment.
-
A s and wich enzyme-linked immunosorbent assay(ELISA)method was used to measure serum ficolin-2 concentrations according to methods described in previous publications(Liu et al., 2009; Pan et al., 2012; Zhao et al., 2014). Briefly, 96-well ELISA plates were coated with rabbit anti-ficolin-2 polyclonal antibody. After incubation at room temperature(RT)for 1 hour, the plates were washed three times with 0.2% Tween-20 in phosphate buffered saline(PBS)solution. Subsequently, 100 μL of each fresh serum sample was added within 6 hours of harvesting and incubated at 37 ℃ for 2 hours. The plates were washed three times and blocked with 5% bovine serum albumin(BSA)overnight. Mouse monoclonal anti-human ficolin-2(GN5, 1:1000 dilution, HyCult Biotechnology b.v., Uden, Netherlands)was then added to each well and incubated at 37 ℃ for 1 hour. The plates were washed three times and incubated with 100 μL horseradish peroxidase-(HRP)conjugated goat anti-mouse IgG(1:1000 dilution). Color development was achieved by adding 100 μL tetramethylbenzidine(TMB)chromogen-substrate(Sigma, Germany). The reaction was stopped by adding 100 μL 0.5 mol/L H2SO4, and the OD450 nm was measured using an ELISA reader. In addition, a standard ficolin-2 curve was derived using different concentrations of ficolin-2 recombinant protein. Data were generated from at least three independent experiments. All statistical data shown represent the mean ± SD.
-
Measurement of serum HBV DNA levels was performed by PCR-fluorescence probing using a diagnostic kit(Daan Gene, China)for quantification of HBV DNA using an ABI 7300 real time PCR system(Applied Biosystems, USA). All CHB patients were determined to be HBV DNA positive(DNA levels > 500 copies/mL, consistent with previous reports)(Li et al., 2010). HBV DNA levels of the 31 patients in this study were higher than 104 copies/mL at the beginning of the observation period.
-
Serum ALT values were measured using an automatic biochemical analyzer(Prodia Diagnostics, Germany)(Wang et al., 2013).
-
The status of the six serum markers, namely, hepatitis B surface antigen(HBsAg), hepatitis B surface antibody(HBsAb), hepatitis B core antigen(HBcAg), hepatitis B core antibody(HBcAb), hepatitis B e antigen(HBeAg) and hepatitis B e antibody(HBeAb), were evaluated using a radioimmunoassay according to the manufacturer's protocol(Abbott Laboratories, Chicago, USA). HBeAg loss was defined as the disappearance of serum HBeAg in a patient who was previously HBeAg-positive. HBeAg seroconversion was defined as disappearance of HBeAg accompanied by the development of anti-HBe.
-
Paraffin sections of HBV-positive or HBV-negative HCC tissue cells fixed in 4% buffered formalin were either collected at Zhongnan Hospital of Wuhan University or purchased from Alenabio Biotechnology Ltd(Xi'an, China). The slides were deparaffinized and treated with 3% H2O2 solution in methanol for 10 minutes to block endogenous peroxidase activity. After washing with PBS, the slides were pretreated with 10% fetal bovine serum(FBS)at 37 ℃ for 15 minutes. The slides were then stained overnight at 4 ℃ with mouse monoclonal anti-human ficolin-2(GN5, 1:1000 dilution)(HyCult Biotechnology b.v.). After washing with PBS, biotinylated anti-mouse IgG was added and incubated at 37 ℃ for 15 minutes. The slides were subsequently washed and incubated with streptavidin-HRP conjugate at 37 ℃ for 15 minutes and developed using 3, 3'-diaminobenzidine tetrahydrochloride.
-
Data were analyzed using SPSS 17.0 software, oneway ANOVA and Student's t test. Differences were considered statistically significant when p < 0.05.
Clinical specimens
Patient treatment protocol
Measurement of serum ficolin-2 concentrations
Measurement of serum HBV DNA levels
Serum ALT measurements
Measurement of HBV serum markers
Immunohistochemical staining of paraffin-embedded liver tissue
Statistical data analysis
-
The clinical characteristics of the study populations(31 CHB patients, 17 HBV carriers and 45 healthy controls)are described in Table 1. At the beginning of the observation period, we found that serum ficolin-2 concentrations of CHB patients were significantly higher than that of the HBV carriers(*p = 0.018) and healthy donors(**p < 0.0001), but there were no differences in ficolin-2 concentrations between HBV carriers and healthy donors(p = 0.7443, Figure 1). The mean concentration of ficolin-2 was 5.41 μg/mL in the CHB patients, 4.53 μg/mL in the HBV carriers, and 4.58 μg/mL in the healthy controls. Age and gender produced no significant differences between the healthy control group and the HBV group(CHB and HBV carriers)(p > 0.05).
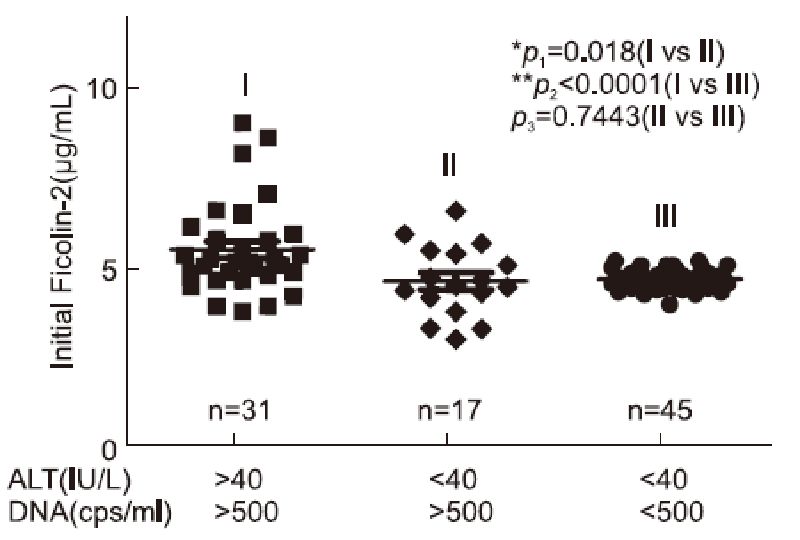
Figure 1. Increased initial ficolin-2 protein concentrations in CHB patients compared with those of the HBV carriers and healthy donors.

Table 1. Characteristic of subjects involved in this study
-
Thirty-one CHB patients were divided into a "favorable outcome group" and an "unfavorable outcome group" based on their ALT, HBV DNA or HBeAg outcome responses according to the clinical practice guidelines published(European Association for the Study of the Liver, 2012)(Table 2). Next, we compared the initial serum ficolin-2 concentrations between the favorable outcome group and the unfavorable outcome group. We found that CHB patients with favorable viral responses, whose HBV DNA copies( > 500 copies/ml)declined after 48 weeks of amelioration liver function treatment(n = 23), had significantly higher levels of ficolin-2 than those in the unfavorable outcome group(n = 8)(Figure 2A, *p = 0.0474). The mean initial ficolin-2 concentration was 5.65 μg/mL in the DNA-decreased favorable group, while the mean ficolin-2 concentration was 4.76 μg/mL in the HBV DNA unfavorable outcome group.
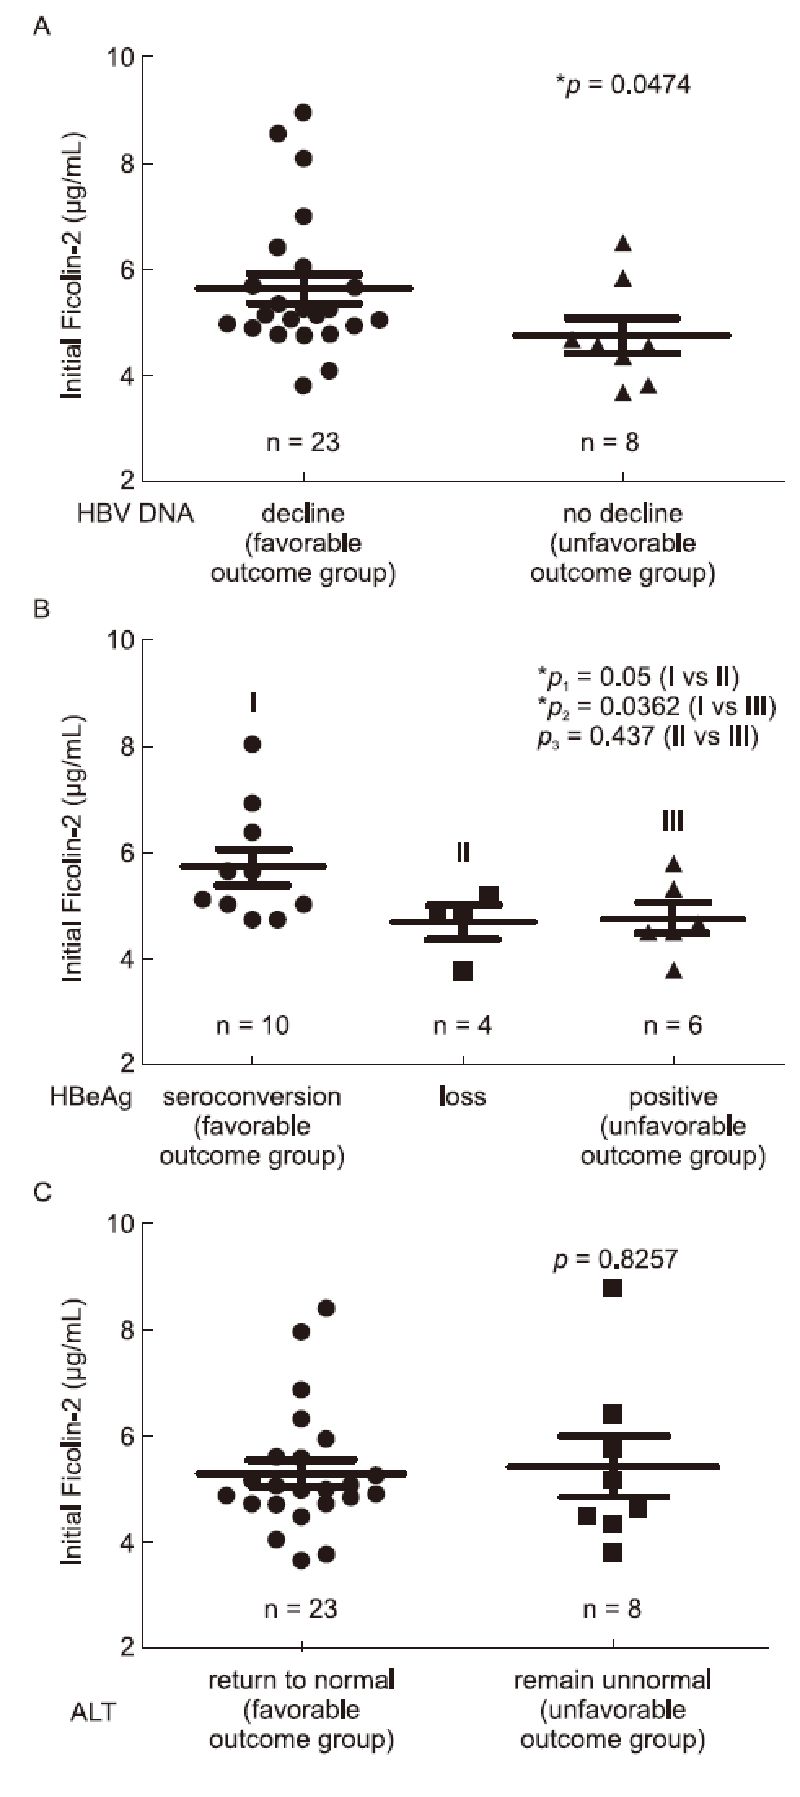
Figure 2. Comparison of initial ficolin-2 concentrations between the favorable group and unfavorable group, according to the outcome responses of their HBV DNA levels (A), HBeAg conversion (B) and ALT levels (C).

Table 2. Clinical parameters of study participants by classification group
At the beginning of our observation, 20 of the 31 CHB patients were HBeAg positive. HBeAg seroconversion and HBeAg loss were defined as described in the Materials and Methods. We found that serum ficolin-2 concentrations in the HBeAg conversion group(n = 10) were significantly higher than that in the HBeAg loss and non-conversion(HBeAg positive)group(Figure 2B; Ⅰ vs Ⅱ, *p = 0.05; Ⅰ vs Ⅲ, *p = 0.036); however, there were no significant differences in ficolin-2 concentrations between those in the HBeAg loss group(n = 4) and HBeAg non-conversion group(n = 6)(Figure 2B, Ⅱ vs Ⅲ, p = 0.437).
However, we did not observe significant differences in the initial serum ficolin-2 concentrations between the favorable outcome ALT group(ALT values > 40 IU/L)where levels returned to normal ALT(≤ 40 IU/L, n = 23) and the unfavorable outcome ALT group(ALT values abnormal, > 40 IU/L, n = 8)(Figure 2C, p = 0.8257).
-
We further compared the correlation between ficolin-2 concentration changes and disease outcome. Ficolin-2 concentrations significantly decreased in the favorable outcome ALT group(ALT values returned to normal, ≤ 40 IU/L)(Figure 3A, *p = 0.0129), but not in the unfavorable outcome ALT group(ALT values abnormal, > 40 IU/L)(Figure 3A, p = 0.4027). Similarly, ficolin-2 concentrations decreased significantly in the HBV DNA favorable outcome group(DNA decreased group, n = 23)(Figure 3B, **p = 0.004), but not in the DNA unfavorable outcome group(no declined group, n = 8)(Figure 3B, p = 0.248).
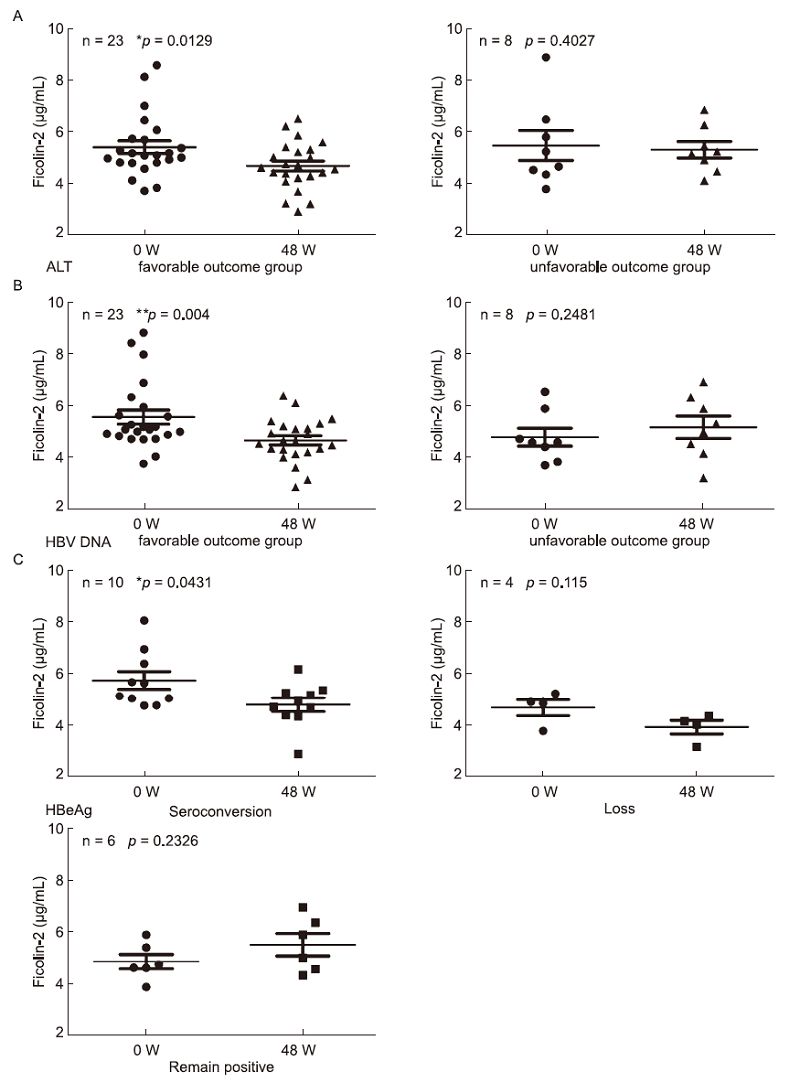
Figure 3. Serum ficolin-2 concentrations were decreased and positively correlated with the favorable ALT, HBV DNA and HBeAg-seroconversion outcome. Analysis of ficolin-2 concentrations between Week 0 and Week 48 of treatment with the favorable and unfavorable ALT (A), HBV DNA (B) and HBeAg-seroconversion outcome (C).
We also found that serum ficolin-2 concentrations decreased significantly in the favorable HBeAg(HBeAg conversion)group(n = 10) after 48 weeks(Figure 3C, *p = 0.043), while levels did not decrease in the HBeAg loss group(n = 4)(Figure 3C, p = 0.115) or HBeAg non-conversion group(n = 6)(Figure 3C, p = 0.2326).
-
We observed that early increased serum ficolin-2 concentrations were dynamically decreased(Figure 4A, Wk 48 vs Wk 0, *p = 0.0312) and were accompanied by decreased ALT values(Figure 4B, Wk 48 vs Wk 0, **p < 0.0001) and HBV DNA levels(Figure 4C, Wk 48 vs Wk 0, **p < 0.0001) in the 31 CHB patients during 48 weeks of treatment. We also observed that hepatic inflammation(by hematoxylin and eosin(H & E)staining)at Week 0 was more serious than that at Week 48(Figure 4D). Liver histological inflammation grades were assessed using a standard Knodell scoring system by experienced pathologists according to previous reports(Desmet et al., 1994; Mannan et al., 2014). Inflammation scores of the Knodell histological activity index(HAI)were displayed by the sum of portal inflammation(from 0 to 4), periportal piecemeal necrosis(from 0 to 10) and intralobular inflammation(from 0 to 4) and total scores were 18(Desmet et al., 1994). Our data showed that inflammation scores of HAI were 4 and 2 at week 0 and week 48, respectively(Figure 4D). This result suggests that the patients' inflammation was alleviated after 48 weeks and was accompanied by decreased ficolin-2 expression and HBV DNA levels.
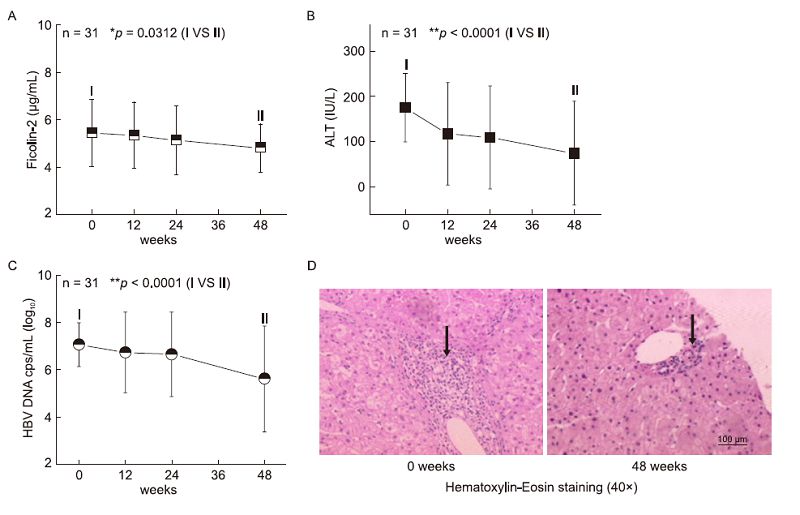
Figure 4. Dynamically decreased serum ficolin-2 concentrations were observed, accompanied by decreased ALT values/HBV DNA levels. Dynamically decreased serum ficolin-2 concentrations (A), ALT values (B) and HBV DNA levels (C) were analyzed during the 48 weeks of treatment in the 31 CHB patients. Data in A–C were expressed as the mean values at each time point. (D) The representative data from liver biopsy sections (n= 4) at Week 0 and Week 48 of treatment were analyzed with H & E reagent and evaluated by light microscope. Arrows represent the infiltration of inflammatory cells.
-
The dynamic changes in ficolin-2 concentrations in HBeAg-positive patients were further analyzed. Ten patients(Patients 1 to 10) with HBeAg seroconversion displayed a significant decrease in serum ficolin-2 concentrations that were accompanied by decreased ALT values and HBV DNA levels(Figure 5A); 4 patients(Patients 11 to 14) with HBeAg loss(HBeAg-, HBeAb-)displayed a slight decrease in ficolin-2 concentrations(Figure 5B); 6 patients(Patients 15 to 20) with HBeAg non-conversion(HBeAg+, HBeAb-)displayed no change in serum ficolin-2 concentrations, HBV DNA levels or ALT values(Figure 5C).
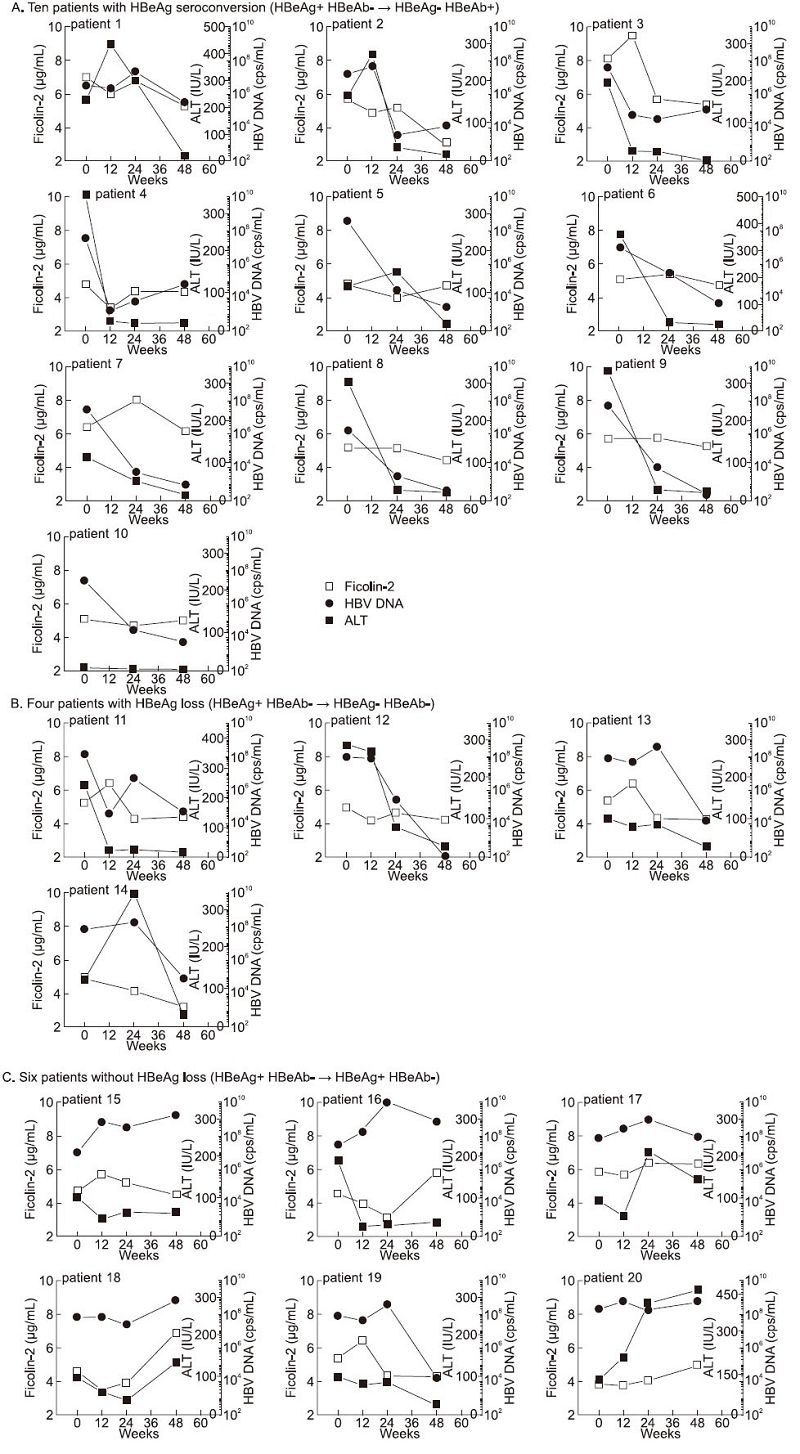
Figure 5. Representative data of ficolin-2, ALT and HBV-DNA after 48 weeks of treatment among 20 positive HBeAg CHB patients. (A) Decreased concentrations of serum ficolin-2 in the 10 individual patients with HBeAg conversion were observed and correlated with the ALT and/or HBV DNA levels during 48 weeks of treatment. (B) Serum ficolin-2 concentrations were slightly decreased in the 4 HBeAg loss patients (Patients 11 to 14) associated with decreased HBV DNA levels and/or ALT values. (C) Six patients (Patients 15 to 20) with non-conversion of HBeAg (HBeAg+, HBeAb-), and unfavorable outcome of both HBV DNA and ALT, displayed no decrease in serum ficolin-2 concentrations.
-
Previous reports have shown that ficolin-2 is mainly produced by liver cells. Little is known about serum and intrahepatic ficolin-2 expression in HCC tissue cells. We examined serum ficolin-2 concentrations in 45 positive HBV(+) and 15 negative HBV(-)HCC patients(Table 3) and found significantly lower serum ficolin-2 concentrations in HCC patients compared to those in 45 healthy donors(Figure 6A). HBV(+)HCC patients had slightly higher mean serum ficolin-2 concentrations than HBV(-)HCC patients(Figure 6A). We also examined intrahepatic ficolin-2 expression in liver biopsy specimens from 26 HCC and 10 cirrhosis patients(Table 3). By using immunohistochemistry, we found that much lower intrahepatic ficolin-2 expression occurred in HCC tissue cells and different stages of HCC tissue cells(from tumor node metastasis(TNM)-Ⅰ to TNM-Ⅳ)compared to adjacent normal tissue cells(Figures 6B–6E). Hepatic cirrhosis also led to less ficolin-2 expression compared to adjacent normal hepatic cells(Figure 6B). These data suggest that liver cell damage in HCC and cirrhosis tissue could cause decreased production of intrahepatic ficolin-2 because, as previously noted, ficolin-2 is mainly produced by liver cells. We also observed that HBV(+)HCC tissue cells showed slightly higher ficolin-2 expression than HBV(-)HCC tissue cells(Figure 6D), which is consistent with the observation of increased serum ficolin-2 levels in CHB patients(Figure 1).
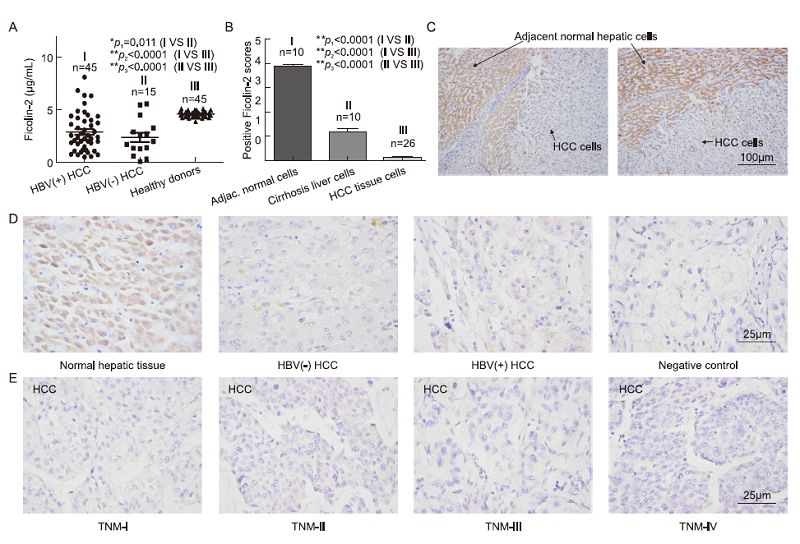
Figure 6. Much lower protein expressions of serum and intrahepatic ficolin-2 in HCC and cirrhosis compared with those of healthy controls. (A) Decreased serum ficolin-2 protein concentrations in HBV (+) HCC and HBV (-) HCC patients compared with those of healthy donors. (B) Statistical analysis of intrahepatic ficolin-2 expression among adjacent normal tissue cells, cirrhosis liver cells and HCC tissue cells. The data shown are means ± SEM of the indicated independent experiments. (C) Representative data of intrahepatic ficolin-2 expression in the HCC tumor tissue cells and adjacent normal tissue cells from HCC patients by immunohistochemistry analysis. (D) Representative data of intrahepatic ficolin-2 expression by immunohistochemistry analysis in the adjacent normal hepatic cells, HBV (+) and HBV (-) tissue cells from HCC patients, and the negative control (without addition of the primary antibody anti-ficolin-2 mAb for the normal hepatic tissue cells). (E) Representative data of intrahepatic ficolin-2 expression by immunohistochemistry analysis in the different stages of HCC tumor tissue cells.

Table 3. Characteristic of HCC and cirrhosis subjects involved in this study
Increased serum ficolin-2 protein concentration in CHB patients
Higher initial serum ficolin-2 concentrations in the favorable outcome group
Serum ficolin-2 concentrations decreased and positively correlated with favorable ALT, HBV DNA and HBeAg-seroconversion outcomes
Dynamically decreased serum ficolin-2 concentration was accompanied by decreased ALT values and HBV DNA levels
Dynamically decreased serum ficolin-2 concentrations were accompanied by HBeAg conversion outcome
Significantly lower serum ficolin-2 and intrahepatic ficolin-2 expression in HCC or cirrhosis cells compared to adjacent normal tissue cells
-
A recent report demonstrated that increased serum ficolin-2 levels influenced acute hepatitis B infection outcome in Vietnamese patients(Hoang et al., 2011). In our studies, we also found that an early increase in ficolin-2 levels was highly correlated with hepatic inflammation and rapid viral response in patients with HCV infection(Hu et al., 2013). In this study, we described for the first time dynamic changes in serum ficolin-2 concentrations in chronic HBV patients after 48 weeks of standard amelioration liver function treatment and intrahepatic ficolin-2 expression in HCC and cirrhosis samples. We found that serum ficolin-2 concentrations in 31 CHB patients were significantly higher than concentrations in 45 healthy controls and 17 HBV carriers(Figure 1). The ficolin-2 concentration detected in healthy donors in this study was similar to that in previous reports where the median concentration of ficolin-2 was 4.7 μg/mL(Liu et al., 2005; Hu et al., 2013; Zhao et al., 2014). After 48 weeks of routine amelioration treatment, ficolin-2 concentrations were reduced and positively correlated with favorable ALT, HBV DNA and HBeAg-seroconversion outcomes(Figures 3–5). We observed that the reduction in ficolin-2 concentration usually occurred after the decrease of ALT and HBV DNA levels and HBeAg conversion(Figure 5A).
Inflammation of hepatic cells results in elevated ALT levels, and serum ALT is a useful risk marker for significant inflammation and fibrosis. Our data showed that CHB patients with abnormally high ALT levels also had higher ficolin-2 concentrations compared to HBV carriers and healthy controls(Figure 1). Interestingly, we found that intrahepatic ficolin-2 expression was reduced in the HCC or cirrhosis liver cells compared to adjacent normal tissue cells(Figure 6). Based on current results and previous reports(Hoang et al., 2011), we propose that the early liver inflammatory response in patients with HBV infection correlates with an increase in ficolin-2 production, but too much damage to liver cells in HCC and cirrhosis tissue cells cause a decrease in serum and intrahepatic ficolin-2 expression because ficolin-2 is mainly produced in liver cells. Therefore, we propose that ficolin-2 might also be an acute-phase inflammation-related indicator.
Ficolin-2 promoter polymorphisms are associated with marked changes in ficolin-2 serum concentrations(Hummelshoj et al., 2005). Large ethnic differences in the ficolin genes also affected the concentration, structure and function of the ficolin-2 molecule(Hummelshoj et al., 2008). However, it is not known whether a relationship exists between HBV genotypes or genetic background and changes in ficolin-2 concentrations in the sera of HBV-infected patients with both pre-and post-standard therapy. Further investigation is needed to determine the relationship between HBV genotype or genetic background and ficolin-2 concentration changes in CHB patients.
Both MBL and ficolins initiate the lectin complement system. MBL has been described as an acutephase protein, and the association of MBL with viral hepatitis has been investigated by many groups(Eisen and Minchinton, 2003; Kilpatrick et al., 2003; Brown et al., 2007; Esmat et al., 2012). Ficolin-2 may also be an acute-phase protein because of its early increased concentrations in CHB patients. An increasing body of data suggests that ficolin is an important aspect of host innate defenses against viral and bacterial diseases, while defective or abnormal expression will cause pathogenic activities of these organisms(Ren et al., 2014). Recently, we demonstrated that ficolin-2 as a pattern recognition receptor(PRR)of innate immune molecule recognized viral N-glycans and blocked HCV and influenza A virus infections(Pan et al., 2012; Zhao et al., 2014). We propose that ficolin-2 activity plays a potential role in hepatic inflammation and disease progression in patients with HBV infection and might have a function similar to MBL in anti-viral hepatitis due to a much higher initial sero-ficolin-2 concentration in the favorable groups compared to the unfavorable groups(Figure 2). Further investigation is also needed to determine the effects of ficolin-2 on HBV infection in vitro and in vivo.
In this study, we came to several conclusions: serum ficolin-2 concentrations are changed in patients with HBV infection and liver diseases; ficolin-2 correlates with hepatic inflammation; CHB patients with higher ficolin-2 concentrations in the early phases of treatment obtain a better outcome; and decreased ficolin-2 expression was observed in HCC and cirrhosis patients. These findings suggest that serum ficolin-2 levels may be considered as one of the indicators for response to CHB infection, HCC and cirrhosis with auxiliary clinical diagnosis.
-
This work was supported by grants from the Natio nal Natural Science Foundation of China(31221061, 31270176 and 31370197), National Outst and ing You th Foundation of China(81025008), the 973 Program of China(2012CB720604), the Program for Changjia ng Scholars and Innovative Research Team in Universi ty(IRT1030), the Hubei Province's Outst and ing Medical Academic Leader Program(523-276003), the Developm ent Fund for Collaborative Innovation Center of Glycosc ience of Shandong University, and the Science and Tech nology Program of Wuhan(201150530141).
-
The authors declare that they have no conflict of interest. The study was approved by the ethics committees of Wuhan University School of Medicine and Hubei Cancer Hospital. All participants provided written informed consent.
-
Xiao-Lian Zhang and Fengling Luo designed the experiments. Tielong Chen, Yilan Hu and Quanquan Ding carried out the experiments. Tielong Chen, Jing Yu and Fubing Wang provided the samples. Tielong Chen and Yilan Hu analyzed the data. Xiao-Lian Zhang and Fengling Luo wrote the paper. All authors read and approved the final manuscript.




 DownLoad: