Citation: Kuan Wu, Wei Chen, Zhaopeng Luo, Bing Wang, Julong Cheng, Zhensheng Kang. Distribution and molecular variability of four tobacco viruses in China .VIROLOGICA SINICA, 2016, 31(6) : 525-527.  http://dx.doi.org/10.1007/s12250-016-3728-2

Distribution and molecular variability of four tobacco viruses in China

  • Corresponding author: Julong Cheng, julongc@126.com, ORCID: 0000-0002-8537-4137
    Zhensheng Kang, Kangzs@nwsuaf.edu.cn, ORCID: 0000-0001-5575-0122
  • Published Date: 29 November 2016
    Available online: 01 December 2016
  • In this study, a total of 409 symptomatic tobacco leaf samples were collected from 12 provinces in China during 2010 and 2011. As shown in Figure 1, those provinces are Anhui, Fujian, Guangxi, Guizhou, Henan, Heilongjiang, Hubei, Hunan, Liaoning, Shandong, Shaanxi, and Yunnan.

  • 加载中
  • 10.1007s12250-016-3728-2.pdf
    1. Chen RT, Zhu XC, Wang ZF, et al. 1997. Chin Toba Sci, 4: 1-7.

    2. Chen W, Liu WT, Jiao HH, et al. 2014. Virol Sin, 29: 1-7.

    3. Dai J, Cheng JL, Huang T, et al. 2012. J Virol Methods, 183: 57-62.

    4. Elena SF, Sanjuan R. 2005. J Virol, 79: 11555-11558.

    5. Legnani R, Gognalons P, Selassie KG, et al. 1996. Plant Dis, 80: 306-309.

    6. Liu P, Li ZN, Song S, et al. 2014. Phytoparasitica, 42: 445-454.

    7. Moury B, Morel C, Johansen E, et al. 2002. J Gen Virol, 83: 2563-2573.

    8. Wang HY, Zhu TS, Cui TT, et al. 2010. J Virol, 155: 293-295.

    9. Zellner W, Frantz J, Leisner S. 2011. J Plant Physiol, 168: 1866-1869.

    10. Zhao L, Hao XA, Wu YF. 2015. Int J Biol Macromol. 75: 474-478.

  • 加载中

Figures(2) / Tables(3)

Article Metrics

Article views(5680) PDF downloads(15) Cited by()

Related
Proportional views

    Distribution and molecular variability of four tobacco viruses in China

      Corresponding author: Julong Cheng, julongc@126.com
      Corresponding author: Zhensheng Kang, Kangzs@nwsuaf.edu.cn
    • 1. State Key Laboratory of Crop Stress Biology for Arid Areas, Northwest A & F University, Yangling 712100, China
    • 2. School of life science, Shanxi Normal University, Linfen 041000, China
    • 3. Zhengzhou Tobacco Research Institute of China National TobaccoCorporation, Zhengzhou 450001, China
    • 4. Shaanxi Tobacco Research Institute, Xi'an 710061, China

    Abstract: In this study, a total of 409 symptomatic tobacco leaf samples were collected from 12 provinces in China during 2010 and 2011. As shown in Figure 1, those provinces are Anhui, Fujian, Guangxi, Guizhou, Henan, Heilongjiang, Hubei, Hunan, Liaoning, Shandong, Shaanxi, and Yunnan.

    • Dear Editor,

      In this study, a total of 409 symptomatic tobacco leaf samples were collected from 12 provinces in China during 2010 and 2011. As shown in Figure 1, those provinces are Anhui, Fujian, Guangxi, Guizhou, Henan, Heilongjiang, Hubei, Hunan, Liaoning, Shandong, Shaanxi, and Yunnan. TMV, CMV, TEV, and PVY are those four plant viruses that are considered the most serious causative agents of diseases in tobacco plants in China (Dai et al., 2012; Chen et al., 2014; Zhao et al., 2015). In China, these tobacco viruses have been found in 16 provinces, including the Yunnan, Hunan, Henan, Fujian, Shaanxi, Shandong, and Liaoning provinces (Chen et al., 1997). These viruses have very high mutation rates during replication because their RNA polymerases lack the proofreading ability. Consequently, these viruses exist as numerous strains and replicate as complex and dynamic mutant clusters (Elena et al., 2005). Therefore, understanding the distribution, genetic diversity, and evolutionary relationships of these viruses is a fundamentally important step in controlling these viruses.

      In this study, a total of 409 symptomatic tobacco leaf samples were collected from 12 provinces in China during 2010 and 2011. As shown in Figure 1, those provinces are Anhui, Fujian, Guangxi, Guizhou, Henan, Heilongjiang, Hubei, Hunan, Liaoning, Shandong, Shaanxi, and Yunnan. Those symptoms were classified into four types: mosaic, leaf malformation, necrotic-spots, and dwarf plant. The mosaic symptom was the most common in the fields. Seventy samples collected in 2010 and 121 collected in 2011 were classified as having the mosaic symptom. Leaf malformation symptoms were found in 134 of 409 samples. Necrotic symptoms were found in 63 samples, and 21 dwarf plant samples were identified (Supplementary Table S1).

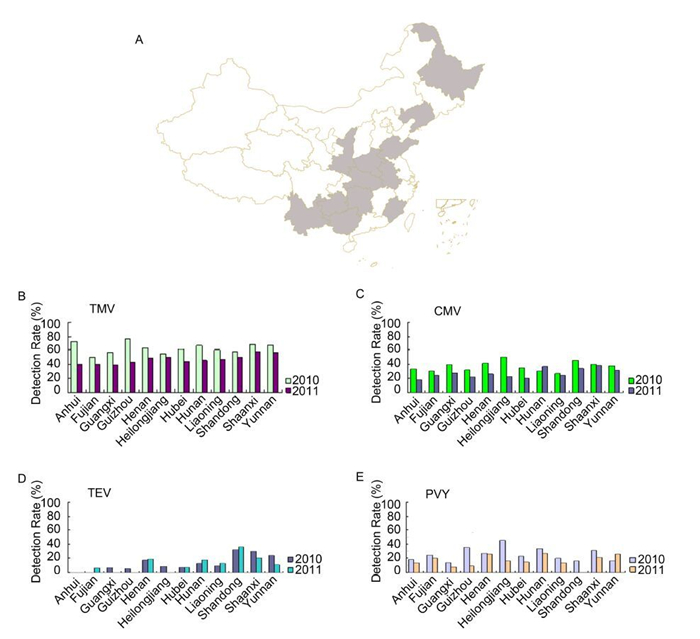
      Figure 1.  (A) A total of 409 symptomatic tobacco leafs were collected from 12 provinces (grey-colored). (B–E) The average detection rates of TMV, CMV, TEV, and PVY in each province. 409 samples (154 in 2010 and 255 in 2011) were examined using RT-PCR, The average detection rate of TMV is shown in (B), CMV in (C), TEV in (D), and PVY in (E). The average detection rate is calculated with the following formula: the incidence (%) = (the number of samples infected by the virus / the number of all the collected samples) × 100.

      To identify the viruses, all samples were tested by reverse transcriptase-polymerase chain reaction (RT-PCR). the complete sequence of the coat protein (CP) genes of TMV, CMV, TEV, and PVY were sequenced, analyzed, and compared with other complete or partially complete CP sequences available in public sequence databases (Liu et al., 2014). Genbank numbers of all complete sequences were listed in Supplementary Table S2.

      A total of 118 out of 154 samples collected in 2010, and 153 out of 255 collected in 2011 were infected by at least one of the four plant viruses studied. Among the 255 samples collected in 2011, we detected TMV, CMV, TEV, and PVY in 123, 72, 40, and 46 samples, respectively. These viruses were distributed widely over the 12 provinces (Figure 1A). For the Shaanxi, Yunnan, Anhui, Guizhou, Hunan, and Henan provinces, the average detection rate for TMV was more than 55% (Figure 1B). The CMV-detection rate ranged from 20% to 42% for the 12 provinces (Figure 1C). The average detection rate of TEV ranged from 0% in the Anhui province to 35% in the Shandong province (Figure 1D). The average detection rate of PVY ranged from 8% in the Shandong province to 31% in the Heilongjiang province (Figure 1E).

      Although disease symptoms were evident in all samples collected, 36 samples in 2010 and 102 samples in 2011 were negative for all four tobacco viruses. Other viruses such as TVBMV and Tobacco necrosis virus (TNV), which are known to infect tobacco plants or other unknown pathogens, could have caused the observed symptoms.

      Samples with mixed infections with more than one virus were very common. Eighty-four of the 118 positive samples tested positive for more than one virus in 2010. Similarly, 112 of 153 positive samples tested positive for more than one virus in 2011. Among the superinfected samples, mixed infection with TMV and CMV was the most common, while that with TEV and PVY was the least common. This may be related with the average detection rate of the virus in the field, since TMV was the most common virus in the field, with the average detection rate of 54.89%, followed by CMV (33.44%), PVY (20.91%), and TEV was the least with the average detection rate of 14.07%. In the field, the most severe mosaic symptoms on leaves were observed in samples with mixed TMV and CMV infection. The most severe necrotic symptoms were generally associated with mixed CMV and PVY infection.

      Cumulatively, 18 TMV, 21 CMV, 15 TEV, and 21 PVY isolates were obtained and compared with available online CP gene sequences (NCBI, http://www.ncbi.nlm.nih.gov/). The genomic sequence and deduced amino acid sequence identities of the CP genes of TMV isolates were 97%-100% and 97%-100%, respectively; for CMV, the respective identities were 78%-100% and 81%-100%; for TEV, the isolates shared 96%-100% and 97%-100% identities; and for PVY the identities were 96%-100% and 97%-100%, respectively.

      These four viruses were present as genetically distinct variants in the field. Genetic variations have been reported in many plant viruses (Moury et al., 2002). In this study, 39 TMV isolates were divided into two evolutionarily divergent groups, Group Ⅰ marked by green and Group Ⅱ marked by red, without correlation with geographical origins (Supplementary Figure S1A). CMV isolates in subgroup Ⅰ marked by green were distributed widely across 12 provinces in China, while the subgroup Ⅱ isolates marked by red were found only in some southern provinces (Fujian, Hubei, Guangxi, and Guizhou) (Supplementary Figure S1B). These results showed that the subgroups of CMV are not evenly distributed in tobacco-growing regions in China and that the distribution of CMV subgroup Ⅱ may be correlated with geographical origins. Twenty-nine TEV isolates (15 in this study and 14 from GenBank) were divided into five evolutionary divergent groups marked respectively by green, red, blue and light green without obvious correlations with geographical origins (Sup plementary Figure S1C). PVY isolates were classified into three main subgroups based on their biological properties and serological characteristics. However, not much information on PVY strains in tobacco is available. In this study, 54 PVY isolates were divided into two phylogenetic groups based on their CP gene sequences marked respectively by green and red (Supplementary Figure S1D). For further study, the mismatch distributions were evaluated to understand the population states of TMV, CMV, TEV, and PVY. Since the shapes of the mismatch distributions were multimodal and ragged, TMV, CMV, TEV, and PVY plausibly existed as molecularly variable populations or stable sub-populations in the field.

      In order to explore the reasons for molecular variable of these four viruses, the recombination was detected among these isolates. For CMV, TEV, and PVY, the phylogenetic network analysis performed using the Neighbor-Net method implemented in the SplitsTree4 software resulted in non-tree-like phylogenetic networks. This suggests that recombination events may be contributing to the evolution of CMV, TEV, and PVY. Based on the recombination detection methods, three putative recombination events were identified. For CMV, one isolate (Guihzou_1) had Fujian_1 as its major parent and Shanxi_1 as its minor parent (Supplementary Table S3). The TEV isolate DQ871331.1 had Hubei_2 as its major parent, and Shanxi_1 as its minor parent (Supplementary Table S3). PVY isolate Anhui_2 had Guizhou_1 as its major parent, and Guizhou_2 as its minor parent (Supplementary Table S3). Since multiple independent clones from a specific RT-PCR product were analyzed, these recombination events were not due to sequencing errors. Recombination naturally existed in the CMV, TEV and PVY populations, which wasan important evolutionary factor. Compared with CMV, TEV and PVY, no recombination was identified in the genetic diversity of the TMV CP gene. Further studies on whole genomes will be required to identify recombination incidents to comprehend the role of recombination in the genetic diversity and evolution of TMV.

      In conclusion, this study indicated that TMV, CMV, TEV and PVY are distributed widely and present as genetically distinct variants in 12 provinces of China. The TMV, CMV, TEV and PVY populations were in a stable condition in this study. Recombination was one of important evolutionary factors shaping the genetic structures of CMV, TEV and PVY populations. The information from this study was useful in understanding the epidemiology of TMV, CMV, TEV, and PVY, and this information should be useful in the design of long-term, sustainable control strategies for these viral diseases.

    • We thank Miss Ruizhen Guo from Shanxi Normal University for editing the manuscript. We also thank Prof. Dr. Ralf T. Vögele from Universität Hohenheim for revising the manuscript. This study was supported by the 111 Project of the Education Ministry of China (No. B07049) and the National High-tech R & D Program of China (No. 2012AA101504). The authors declare that they have no conflict of interests. This article does not contain any studies with human or animal subjects performed by any of the authors.

      Suppementary figures/tables are available on the websites of Virologica Sinica: www.virosin.org; link.springer.com/journal/12250

    • Province TotalMosaicLeaf MalformationNecroticDwarf Plant
      2010201120102011201020112010201120102011
      Anhui111547442311
      Fujian121558443300
      Guangxi141378532101
      Guizhou1721713753201
      Henan11315153102412
      Heilongjiang111264451201
      Hubei1327613482412
      Hunan1522711572311
      Liaoning101555263400
      Shandong121668462200
      Shaanxi16337146122413
      Yunnan12355154122513
      Total1542557012152822637615

      Table S1.  Disease symptoms of 409 tobacco leaf samples from 12 provinces in China

      TMV Anhui_1 2010 Anhui KJ508018
      Fujian_1 2010 Fujian KJ508019
      Guangxi_1 2010 Guangxi KJ508020
      Guangxi_2 2011 Guangxi KJ508021
      Guizhou_1 2010 Guizhou KJ508022
      Guizhou_2 2011 Guizhou KJ508023
      Heilongjiang_1 2010 Heilongjiang KJ508024
      Henan_1 2010 Henan KJ508025
      Henan_2 2011 Henan KJ508026
      Hubei_1 2010 Hubei KJ508027
      Hubei_2 2011 Hubei KJ508028
      Hunan_1 2010 Hunan KJ508029
      Hunan_2 2011 Hunan KJ508030
      Liaoning_1 2010 Liaoning KJ508031
      Shaanxi_1 2010 Shaanxi KJ508032
      Shaanxi_2 2010 Shaanxi KJ508033
      Shandong_1 2010 Shandong KJ508034
      Shandong_2 2011 Shandong KJ508035
      Yunnan_1 2010 Yunnan KJ508018
      Yunnan_2 2011 Yunnan KJ508019
      CMV Anhui_1 2010 Anhui KJ513380
      Fujian_1 2010 Fujian KJ513381
      Fujian_2 2010 Fujian KJ513382
      Guangxi_1 2010 Guangxi KJ513383
      Guizhou_1 2010 Guizhou KJ513384
      Guizhou_2 2010 Guizhou KJ513385
      Heilongjiang_1 2010 Heilongjiang KJ513386
      Henan_1 2010 Henan KJ513387
      Henan_2 2010 Henan KJ513388
      Hubei_1 2010 Hubei KJ513389
      Hubei_2 2011 Hubei KJ513390
      Hunan_1 2010 Hunan KJ513391
      Hunan_2 2011 Hunan KJ513392
      Liaoning_1 2010 Liaoning KJ513393
      Liaoning_1 2010 Liaoning KJ513397
      Shaanxi_1 2010 Shaanxi KJ513400
      Shaanxi_2 2011 Shaanxi KJ513403
      Shandong_1 2010 Shandong KJ513405
      Shandong_2 2011 Shandong KJ513406
      Yunnan_1 2010 Yunnan KJ513409
      Yunnan_2 2011 Yunnan KJ513410
      TEV Fujian_1 2010 Fujian KJ513394
      Fujian_2 2010 Fujian KJ513395
      Heilongjiang_1 2010 Heilongjiang KJ513396
      Henan_1 2010 Henan KJ513398
      Henan_2 2010 Henan KJ513399
      Hubei_1 2010 Hubei KJ513401
      Hubei_2 2011 Hubei KJ513402
      Hunan_1 2010 Hunan KJ513404
      Hunan_2 2011 Hunan KJ513407
      Shaanxi_1 2010 Shaanxi KJ513408
      Shaanxi_2 2011 Shaanxi KJ513411
      Shandong_1 2010 Shandong KJ513412
      Shandong_2 2010 Shandong KJ513413
      Yunnan_1 2010 Yunnan KJ513414
      Yunnan_2 2010 Yunnan KJ513415
      PVY Anhui_1 2010 Anhui KJ513416
      Anhui_2 2010 Anhui KJ513417
      Fujian_1 2010 Fujian KJ513418
      Guangxi_1 2010 Guangxi KJ513419
      Guangxi_2 20110 Guangxi KJ513421
      Guizhou_1 2010 Guizhou KJ513422
      Guizhou_2 2011 Guizhou KJ513423
      Heilongjiang_1 2010 Heilongjiang KJ513425
      Heilongjiang_2 2010 Heilongjiang KJ513426
      Henan_1 2010 Henan KJ513427
      Henan_2 2010 Henan KJ513429
      Hunan_1 2010 Hunan KJ513420
      Hunan_2 2010 Hunan KJ513424
      Liaoning_1 2010 Liaoning KJ513428
      Liaoning_2 2010 Liaoning KJ513433
      Shaanxi_1 2010 Shaanxi KJ513435
      Shaanxi_2 2011 Shaanxi KJ513436
      Shandong_1 2010 Shandong KJ513430
      Shandong_2 2011 Shandong KJ513432
      Yunnan_1 2010 Yunnan KJ513434
      Yunnan_2 2011 Yunnan KJ513416

      Table S2.  The time, geographical origin and accession number of all isolates used in this study

      Virus Breakpoint Recombinanta Parentals Method (Average P value)
      Start End Major Minor R G B M C S 3Seq
      CMV 18 603 Guizhou_1 (KJ513384)b Fujian_1 (KJ51338) 97.4% Shaanxi_1 (KJ513400) 100% 9.46×10⁻¹¹ 1.08×10⁻⁹ - 3.98×10-03 3.75×10-03 - 7.16×10⁻¹⁰
      TEV 261 498 DQ871331.1 (DQ871331.1) Hubei_2 (KJ51340) 99.1% JX512813.1 (JX512813.1) 99% 3.44×10-03 - - 2.03×10-07 1.00×10-07 - 1.43×10-09
      PVY 322 434 Anhui_2 (KJ513417) Guizhou_1 (KJ51342) 98.8% Guangxi_1 (KJ5134T9) 99.5% 1.38×10-03 - 1.38×10-03 2.45×10-03 1.28×10-03 1.39×10-03 1.28×10-03
      Note:a only events supported by at least four of the different RDP3-implemented methods. The support probability for each method is shown.b GenBank accession number.

      Table S3.  Putative recombination events of CP gene in CMV, TEV and PVY populations

      Figure S1.  (A) Neighbor-joining tree of tobacco mosaic virus. (B) Neighbor-joining tree of cucumber mosaic virus. (C) Neighbor-joining tree of tobacco etch virus. (D) Neighbor-joining tree of potato virus Y. Bootstrap analysis was applied using 1, 000 replications. Only bootstrap values (%) higher than 50 are shown. For (A)-(D): Neighbor-joining tree based on the coat protein nucleotide sequences. The strains were marked by green circles were collected in this study, the rest strains were from online databases.

    Figure (2)  Table (3) Reference (10) Relative (20)

    目录

    /

    DownLoad:  Full-Size Img  PowerPoint
    Return
    Return