


HTML
-
Influenza B virus is a negative-stranded RNA virus belonging to the Orthomyxoviridae family. This virus can cause significant morbidity and mortality in humans (Feng et al. 2012), especially in children, who are often disproportionally affected (Tan et al. 2018). Recent studies have shown that approximately 25% of seasonal influenza infections in humans are caused by influenza B viruses (Caini et al. 2018; Tan et al. 2018). Influenza B viruses have even been the predominant virus type in circulation during some influenza seasons (Ambrose and Levin 2012; Heikkinen et al. 2014; Barr et al. 2016). The influenza B viruses are classified into two phylogenetically and antigenically distinct lineages, known as B/Victoria/2/87-like and B/Yamagata/16/88-like (Kanegae et al. 1990; Nerome et al. 1998).
The Yamagata and Victoria lineages have had a complex epidemiological history in China, where they co-circulate and alternate in regional dominance (Bedford et al. 2015). From 2003 to 2008, influenza B viruses circulated widely throughout China, causing more than half of the influenza-associated mortality (Feng et al. 2012). Different B lineages viruses have caused repeated epidemics in turn. The Yamagata lineage viruses were the dominant strains in China in the 2007–2008, 2013–2014, 2014–2015 and 2017–2018 seasons (WHO, 2018; Yang et al. 2018). The influenza B Yamagata lineage viruses infected mostly older people in Jiangsu Province during the 2017–2018 season (Cui et al. 2018). The Victoria lineage viruses were the dominant strains in China during the 2009–2012 and 2015–2016 seasons (Huang et al. 2013; Tan et al. 2013; Li et al. 2014; Yang et al. 2018). Influenza B viruses were the major cause of seasonal influenza epidemics every 2 years in Jincheng from 2009 to 2017 (Wang et al. 2018). Many studies have been recently conducted to explore the genetic and epidemiological characteristics and evolutionary dynamics of influenza B viruses (Roy et al. 2011; Oong et al. 2015; Kuo et al. 2016; Langat et al. 2017).
In general, few studies have focused on the spatial, temporal and genetic dynamics of influenza B viruses in China. Here, we examine the distribution, evolution and transmission of influenza B viruses in China from a phylogeographic perspective.
-
HA gene sequences of the influenza B viruses were obtained from GISAID (http://gisaid.org) and GenBank (http://www.ncbi.nlm.nih.gov/genomes/FLU/). Duplicate strains and those determined to be overly divergent by TempEst (http://tree.bio.ed.ac.uk/software/tempest) were removed from the database. In total, 438 Victoria HA1 (alignment length of 1020 nucleotides) sequences and 507 Yamagata HA1 (alignment length of 1014 nucleotides) sequences that circulated between 1973 and 2018 were selected (Supplementary Tables S1 and S2). All Chinese HA1 sequences contained 238-939 base pairs of coding sequence. These data were then used to analyze the migration patterns of the virus.
-
We divided mainland China into nine climate zones based on the temperature and humidity conditions (Zheng et al. 2013). Each influenza B sequence was assigned a geographic area according to its province/city of isolation. The latitude and longitude of each province/city center were obtained from the geographic information system (GIS) Basic Data of China.
China was divided into the following nine climate zones: The North temperate zone, Mid temperate zone, South temperate zone, North subtropical zone, Mid subtropical zone, South subtropical zone, North tropical zone, Mid tropical zone and Plateau climate zone. We did not consider the Mid temperate zone of the Xinjiang region, the North temperate zone and the Mid tropical zone due to the lack of virus sequence data for southern Xinjiang, the North temperate zone and the Mid tropical zone.
A digital map was obtained from the Institute of Geographic Sciences and Natural Resources Research (resource and environment data cloud platform http://www.resdc.cn/data.aspx?dataid=243) and is shown in Fig. 1.
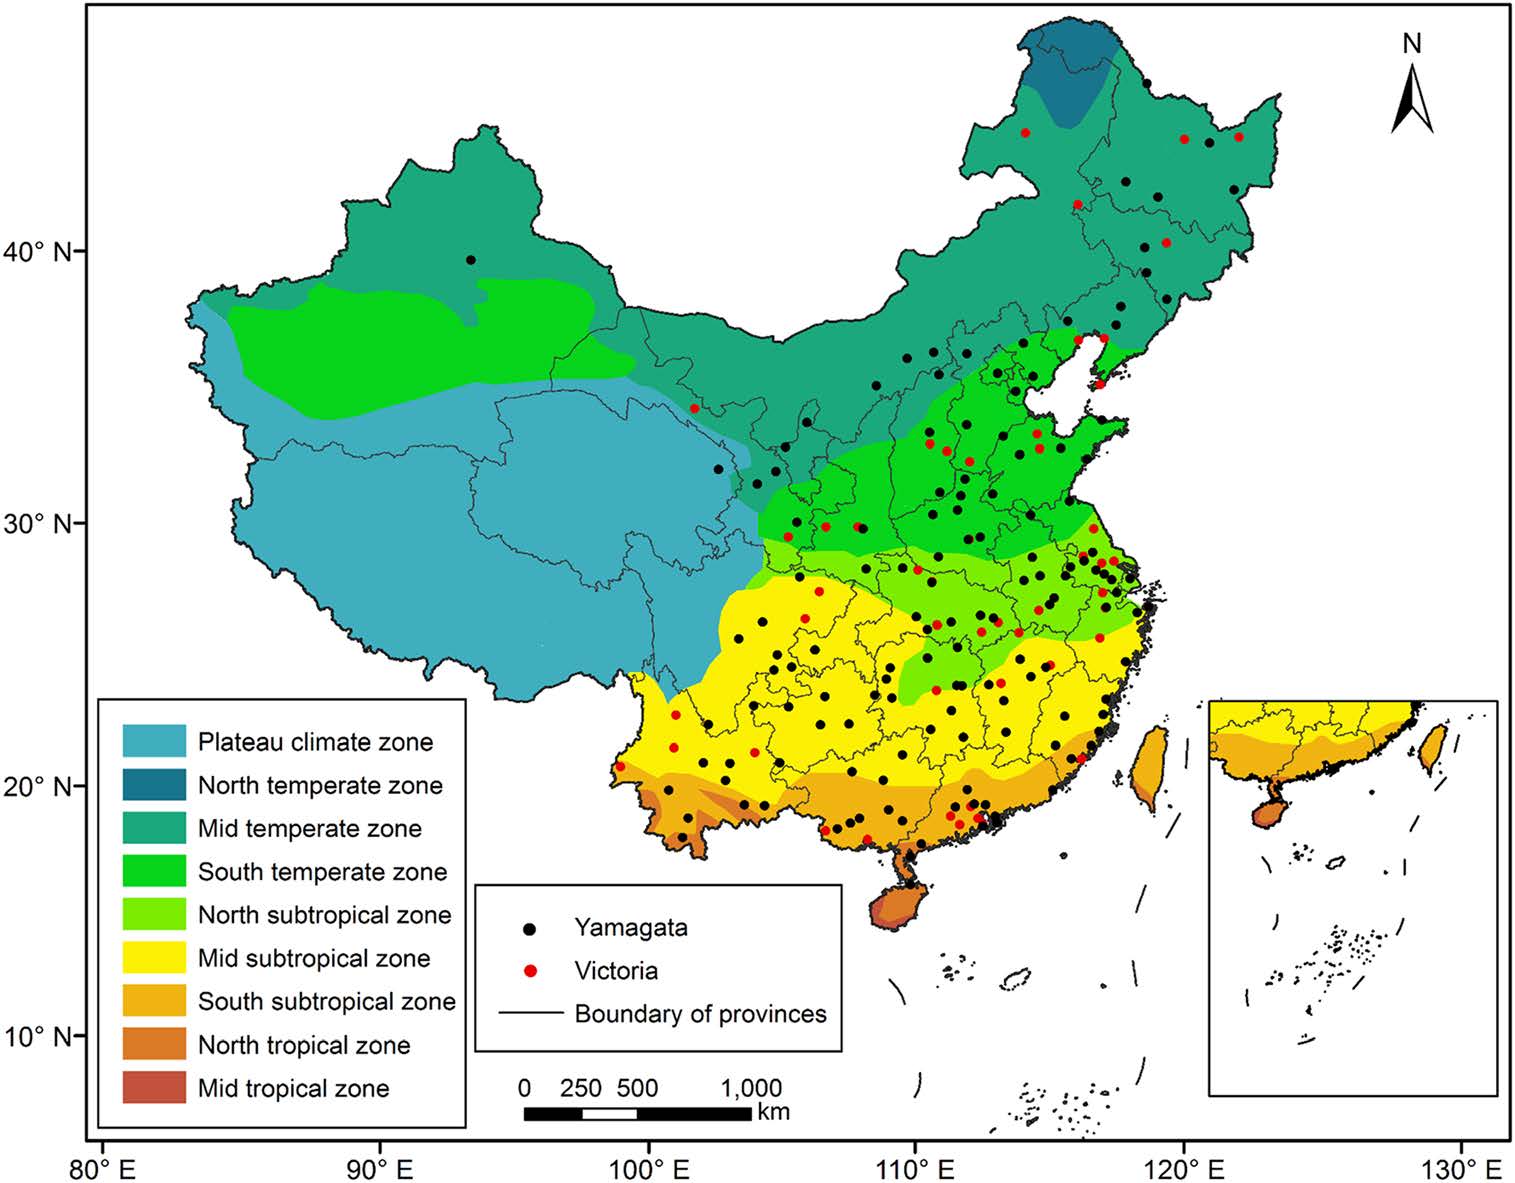
Figure 1. Map of China and the nine geographic regions used in our study.
-
We aligned the influenza B virus HA nucleotide sequences using the MEGA v7 software (https://www.megasoftware.net/). A phylogenetic tree of influenza B viruses was inferred in the BEAST 1.8.1 software (Drummond et al. 2012). The trees were color coded based on the seven geographical regions where the viruses were collected.
The Markov chain Monte Carlo (MCMC) method was used to estimate the time-resolved phylogenetic trees. In this analysis, the SRD06 nucleotide substitution model (Shapiro et al. 2006), Gaussian Markov random field (GMRF) Bayesian Skyride coalescent prior (Minin et al. 2008) and a strict molecular clock were used. A strict molecular clock was chosen based on the evolutionary distance in each data set, as estimated by TempEst (http://tree.bio.ed.ac.uk/software/tempest). The MCMC chain was run for at least 500 million generations, allowing 10% burn-in and sub-sampling every 5 million steps. The maximum clade credibility (MCC) trees were summarized by TreeAnnotator v1.8.4 in the BEAST package. The GMRF Bayesian Skyride analysis was used to elucidate the population dynamics of influenza B viruses. FigTree software (http://tree.bio.ed.ac.uk/software/figtree/) was used to visualize and annotate the phylogenetic trees and datadriven documents.
The discrete-state continuous time Markov chain (CTMC) method was used to estimate the migration rates of the Victoria and Yamagata lineages across different regions. A symmetric substitution model of a Bayesian stochastic search variable selection (BSSVS) was used to estimate the geographic transition rate. The pairwise migration rate was estimated in Tracer v1.6 software with a minimum effective sample size (ESS) of 200, and most had an ESS greater than 500 (Rambaut et al. 2018). SPREA D3 software version 0.9.7.1 (Bielejec et al. 2016) was used to visualize the geographic transition routes and conduct Bayes factor (BF) tests. A BF test provides statistical support for geographic transition routes (Lemey et al. 2009).
Virus Sequence Data
Study Area
Phylogenetic Analysis
-
The GMRF Bayesian Skyride analysis showed the effective population size slightly increase and decrease from the 1970s to the 1990s in both the Yamagata and Victoria lineage. After 2000, the effective population size severely increase and decrease in both the Yamagata and Victoria lineages (Figs. 2, 3).
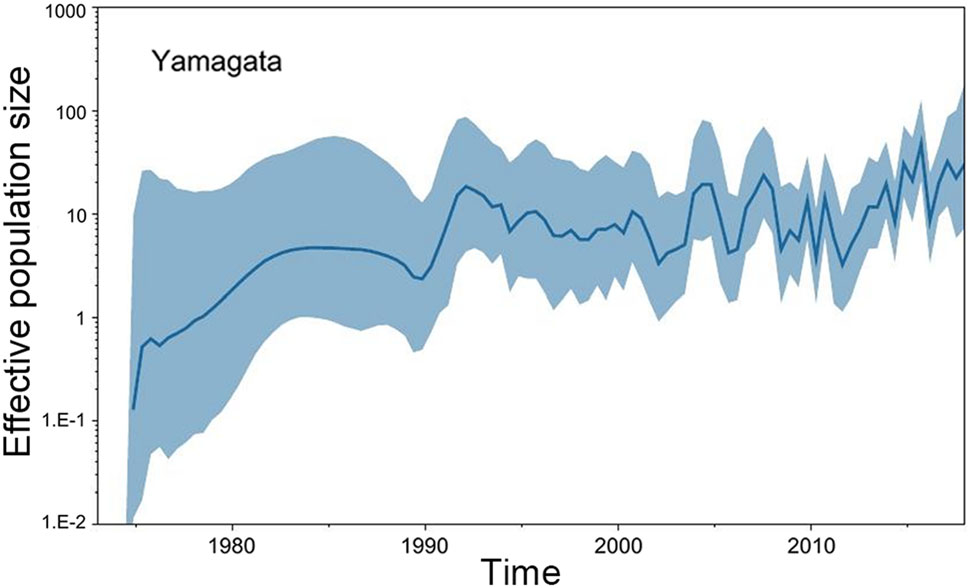
Figure 2. GMRF Bayesian Skyride plot of Yamagata lineage viruses in China estimated from HA. A GMRF Bayesian Skyride plot of HA genes showing the change in the effective population size over time. The solid blue line indicates the median value, and the blue area is the 95% highest posterior density (HPD) of the genetic diversity estimates.
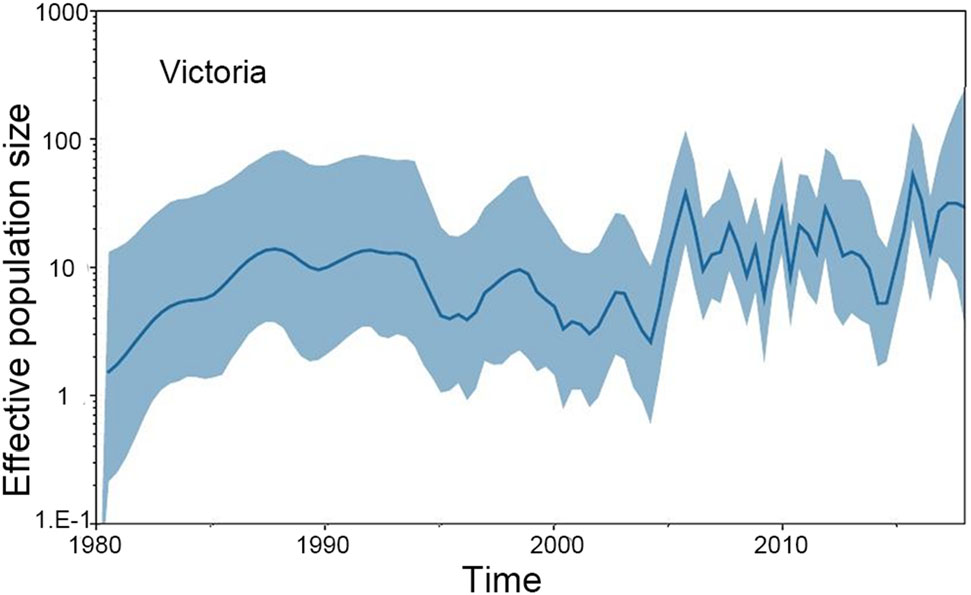
Figure 3. GMRF Bayesian Skyride plot of Victoria lineage viruses in China estimated from HA. A GMRF Bayesian Skyride plot of HA genes showing the change in the effective population size over time. The solid blue line indicates the median value, and the blue area is the 95% highest posterior density (HPD) of the genetic diversity estimates.
-
We constructed MCC trees of Yamagata and Victoria lineage viruses through their HA sequences, and the results are shown in Figs. 4 and 5. Figure 4 shows that Yamagata lineage viruses were first isolated in the South subtropical zone in 1973. Until 1990, the viruses were detected only in the South temperate zone, Mid subtropical zone and South subtropical zone. In the following 10 years, namely, 1991–2000, Yamagata lineage viruses spread slowly. In addition to the previous areas, the viruses were also detected in the Mid temperate zone, and North subtropical zone. However, after 2000, the Yamagata lineage viruses spread quickly and appeared in all regions of China.
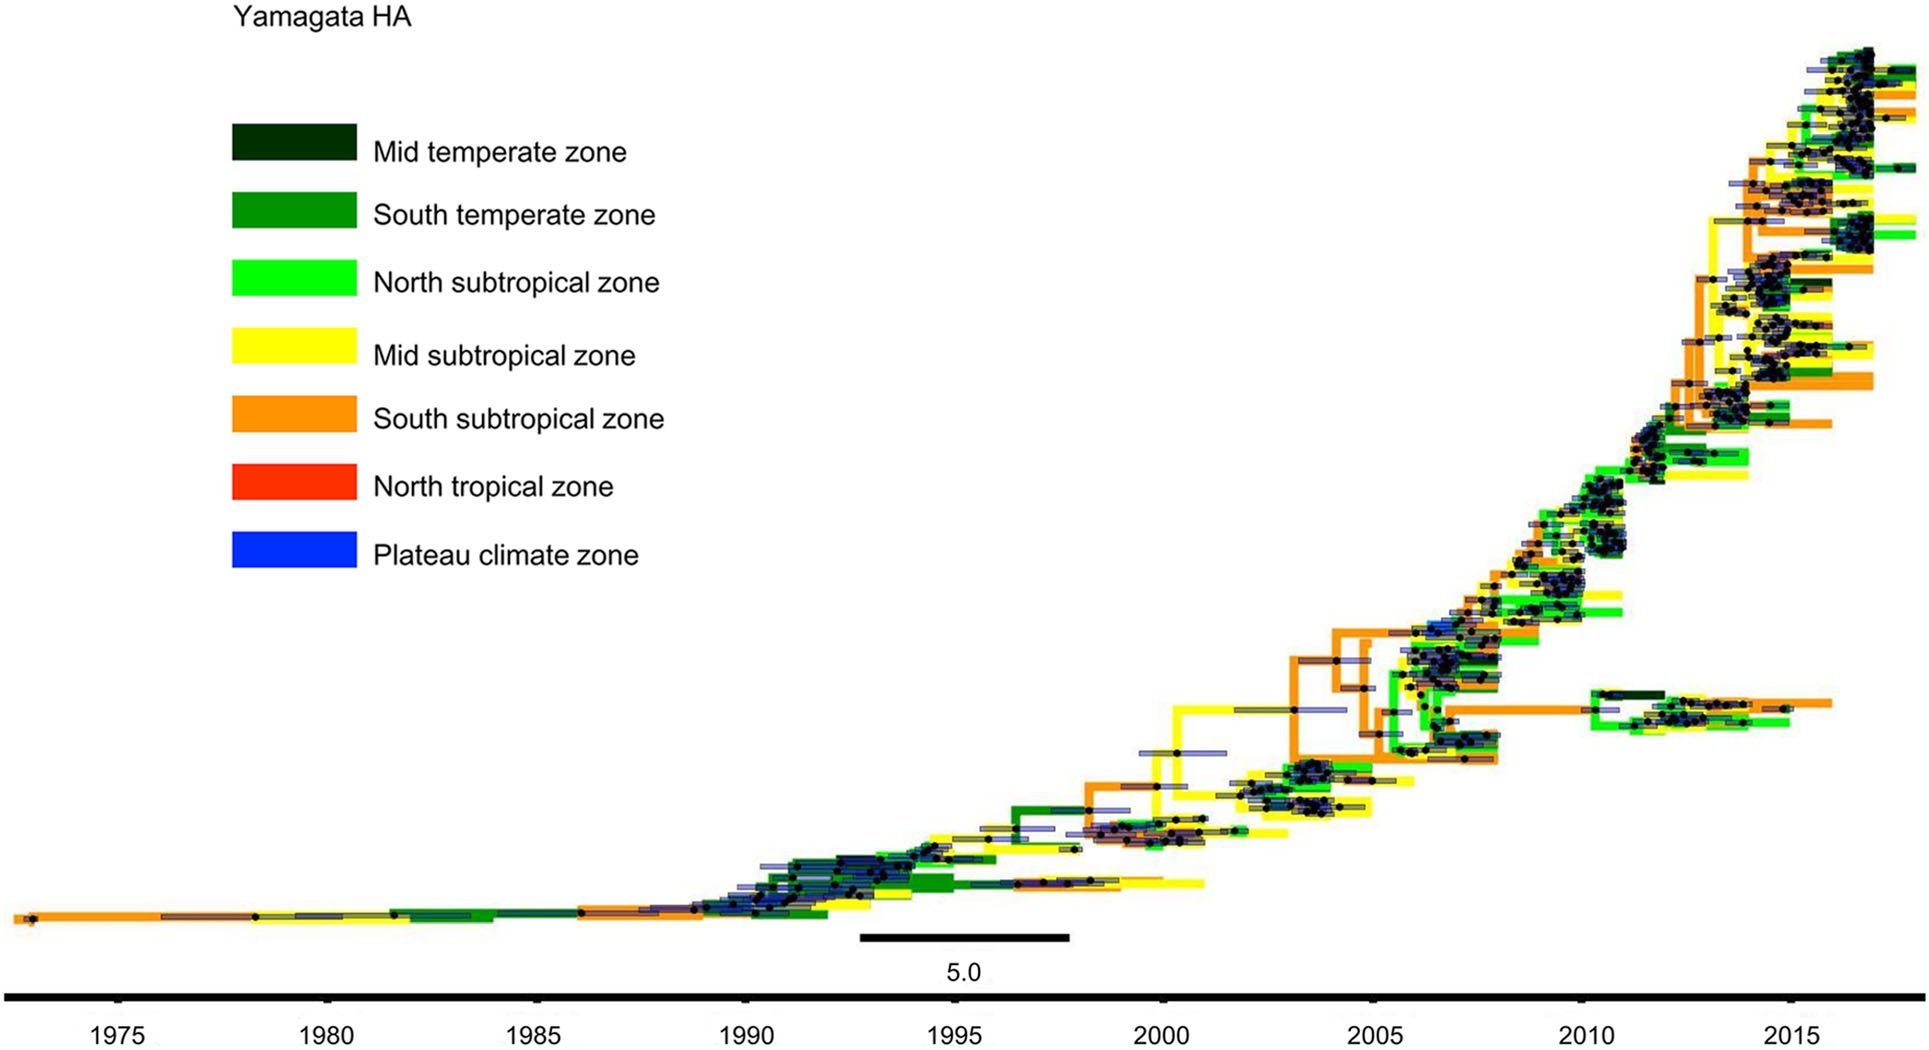
Figure 4. Phylogenetic tree of influenza B Yamagata HA gene sequences. The tree is coloured based on the seven geographical regions where the virus were collected. The black point represents the nodes, and the horizontal bar indicates the 95% highest posterior density (HPD) of each node.
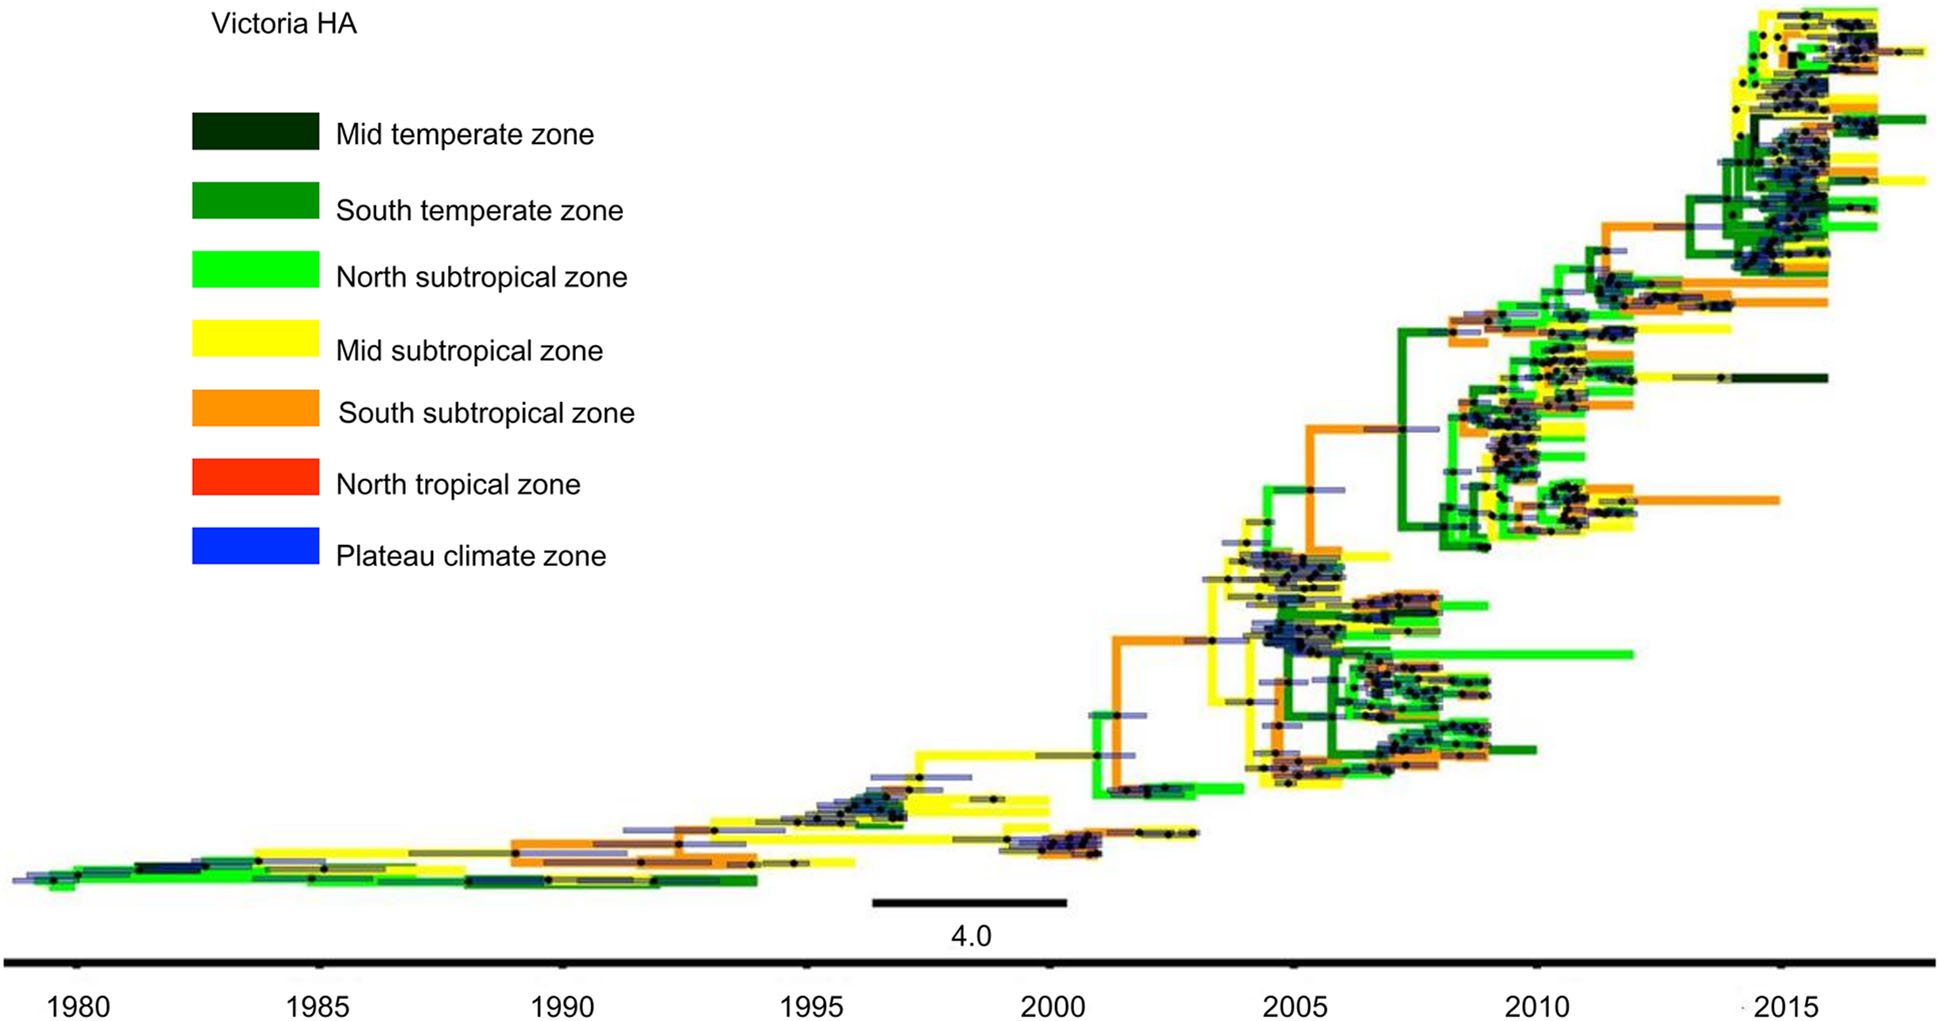
Figure 5. Phylogenetic tree of influenza B Victoria HA gene sequences. The tree is coloured based on the seven geographical regions where the virus were collected. The black points represent the nodes, and the horizontal bars indicate the 95% highest posterior density (HPD) of each node.
The MCC tree of Victoria lineage viruses was slightly different from the Yamagata lineage viruses. Figure 5 shows that in China, Victoria lineage viruses were first isolated in the North subtropical zone in 1980. Over the following 20 years, namely, 1981–2000, Victoria lineage viruses also spread slowly. They were detected in the Mid temperate, South temperate, North subtropical, Mid subtropical and South subtropical zones. However, after 2000, the Victoria lineage viruses spread quickly and appeared in all regions of China.
-
We reconstructed spatial dispersion patterns of Victoria and Yamagata lineage viruses in China between 1973 and 2018. Figure 6 shows the major migration links of the Yamagata lineage viruses. Generally, they spread between the north and south. The first transmission route was between the Mid temperate and North tropical zones, which is strongly supported (BF > 10). The second transmission route was between the Mid temperate and North subtropical zones, which is strongly supported (BF > 10).The third transmission route was between North subtropical and North tropical zones, which is decisively supported (BF > 100). The fourth transmission route was between the North subtropical and Mid subtropical zones, which is decisively supported (BF > 100). The fifth transmission route was between the Mid subtropical and North tropical zones, which isdecisively supported(BF > 100). Two other main pathways were between the east and west, which were also decisively supported (BF > 100). The first transmission route was between the North subtropical and Plateau climate zones, and the other route was between the Mid subtropical and Plateau climate zones. The North subtropical zone and Mid subtropical zone acted as transition nodes in the Yamagata lineage virus dispersion network in China.
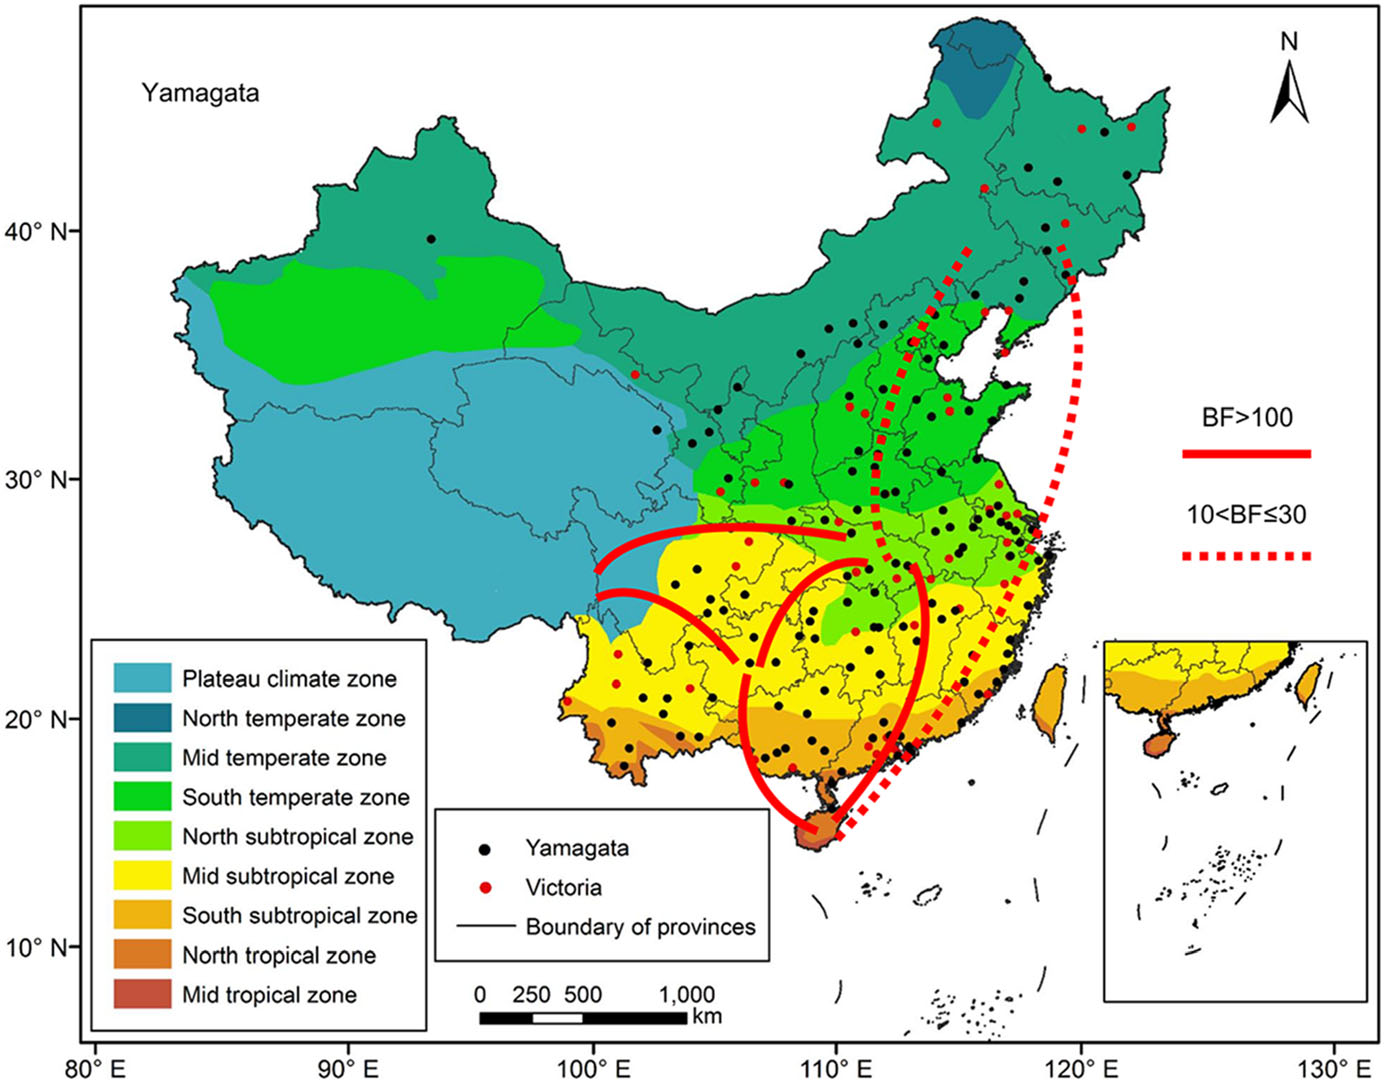
Figure 6. Migration of influenza B Yamagata virus amongst the nine geographic regions in China, 1973–2018. The red lines indicate the reconstructed spatial dispersion patterns of influenza B viruses circulating in China. The BF test provides statistical support for geographic transition routes. BF values greater than 100 indicate statistically decisive support. BF values greater than 10 and less than or equal to 30 indicate strong support.
Figure 7 shows the major migration links of the Victoria lineages, which were slightly different from those of the Yamagata lineage viruses. Five gene flow predominant pathways were between the north and south. The first virus transmission route was between the Mid temperate and South temperate zones, which is strongly supported (BF > 10). The second transmission route was between the South temperate and Mid subtropical zones, which is very strongly supported (BF > 30). The third virus transmission route was between the South temperate and South subtropical zones, which is decisively supported (BF > 100). The fourth decisively supported pathway was virus transmission between the South temperate and North subtropical zones. The fifth transmission route was between the North subtropical and South subtropical zones. Two other decisively supported pathways included viral transmission between eastern China and the west. The first virus transmission route was between the South temperate and Plateau climate zones, and the second virus transmission route was between the North subtropical and Plateau climate zones. The South temperate zone and the North subtropical zone acted as transition nodes in the Victoria lineage virus dispersion network in China.
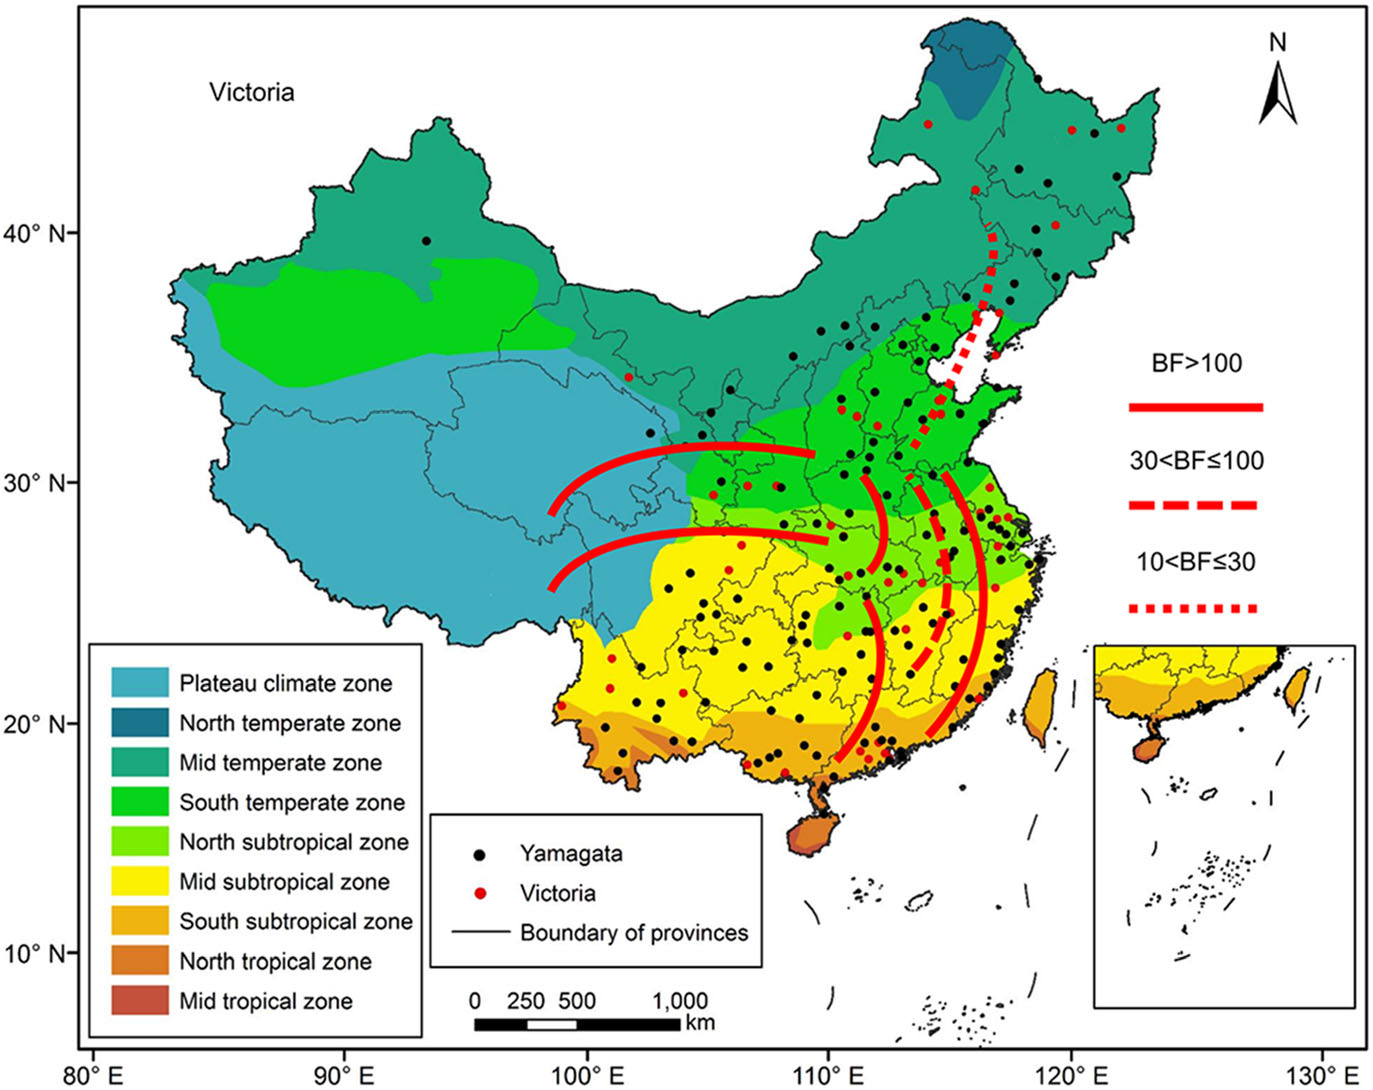
Figure 7. Migration of influenza B Victoria virus amongst the nine geographic regions in China, 1980–2018. The red lines indicate the reconstructed spatial dispersion patterns of influenza B viruses circulating in China. The BF test can provide statistical support for geographic transition routes. BF values greater than 100 indicate statistically decisive support. BF values greater than 30 and less than or equal to 100 indicate very strong support. BF values greater than 10 and less than or equal to 30 indicate strong support.
Effective Population Size
Local Persistence of Influenza B Viruses in China
Spatial Dispersion of Influenza B Viruses in China
-
In this study, we investigated the evolution and spatial dispersion patterns of the Victoria and Yamagata lineage viruses in China. The Bayesian phylogeographic analyses of influenza B viruses shows that the North subtropical zone and the South subtropical zone were the origins of the Victoria and Yamagata lineage viruses, respectively. The South temperate zone and the North subtropical zone acted as transition nodes in the Victoria lineage virus dispersion network, and the North subtropical zone and Mid subtropical zone acted as transition nodes in the Yamagata lineage virus dispersion network in China. From the 1970s to the 1990s, the Yamagata and Victoria lineage viruses spread slowly and only appeared in parts of China. After 2000, the Yamagata and Victoria lineage viruses spread quickly and appeared in all regions of China. This finding is supported by the GMRF Bayesian Skyride analysis of the effective population size changes during this period (Figs. 2, 3).
The Mid temperate and South temperate zones are in the northernlatitudes.The climates in these areas are characterized by cold and dry winters. During the winter season (November to March), influenza viruses circulate in this area (Viboud et al. 2006) and the cold, dry weather increases the odds of seasonal influenza transmission in the population (Lowen et al. 2007). As shown in the map, three migration links were established in the Mid temperate zone, and five migration links were established in the South temperate zone(Figs. 6, 7).Hence, northern China, especially the South temperate zone, may have acted as transition nodes for the Victoria lineage virus dispersion network in China. The North subtropical zone and Mid subtropical zone are in the middle latitudes, where the climate is characterized by abundant rainfall during the rainy season. Influenza viruses may circulate in these areas throughout the year. The relatively high humidity and rainy weather increase the odds of seasonal influenza transmission in the population (Shek and Lee 2003; Lowen and Steel 2014). As shown in the map, seven migration links were established in the North subtropical zone, and four migration links were established in the Mid subtropical zone (Figs. 6, 7). Hence, southern China, the North subtropical zone and the Mid subtropical zone may have acted as transition nodes for the Yamagata lineage virus dispersion network in China.
As influenza B viruses continue to move through susceptible populations in China, the demographic inference suggests that the genetic diversity of Victoria and Yamagata lineage viruses severely changed after 2000. Before 2000, China's detection technology and transportation methods were limited. With the development of China's economy, disease detection technology and transportation methods have been rapidly developing. After 2000, the surveillance capacity of the local Chinese Centre for Disease Control and Prevention (China CDC) improved, and the number of reported cases of influenza viruses infection increased. Both Victoria and Yamagata lineage viruses generally co-circulate during each year at varying levels. Influenza B viruses represent the major cause of seasonal influenza epidemics every 2–4 years (Belshe 2010). Due to their complex migration dynamics and co-circulation, influenza B viruses are a notable threat to public health (Reed et al. 2012). Understanding the spatial, temporal and genetic dynamics of influenza B viruses in China is a key step for establishing effective epidemic prevention and control strategies.
This research study also has a few limitations. First, this study only used sequences from China and did not consider sequences from other countries; thus, the mechanism by which influenza B virus was introduced into China could not be determined. Second, the sequence data we used was collected from online databases. Although the number of people infected is large, according to the China CDC, there was no one-to-one correspondence between reported cases and sequences data. The difference between the online sample size and outbreak data size is very small (Supplementary Table S3) (http://www.chinaivdc.cn/cnic/) and did not affect the results of the analysis. Third, this study did not consider neuraminidase evolution and reassortment of internal influenza B genes. Future studies should focus on genome-wide evolutionary dynamics of influenza B viruses.
-
We would like to thank Professor Huaiyu Tian and Doctor Jing Yang (at Beijing Normal University) for their constructive comments. This research study was partially supported by the National Research Program of the Ministry of Science and Technology of the People'sRepublicofChina(2016YFA0600104) and donations from Delos Living LLC and the Cyrus Tang Foundation to Tsinghua University.
-
XL and Bing Xu conceived and designed the research. XL and KKYC performed the experiments. Bo Xu, JY, and ML provided helpful suggestion about the study. XL and Bing Xu wrote the manuscript.
-
The authors declare that they have no conflict of interest.
-
This article does not contain any studies with human or animal subjects performed by any of the authors.

 DownLoad: