


-
Hepatitis C virus (HCV) is a blood-borne pathogen with a positive-sense single-stranded RNA genome and belongs to the Flaviviridae family (Rakela J, et al., 2002). HCV usually causes chronic infection and leads to chronic hepatitis, liver cirrhosis, and hepatocellular carcinoma. The current treatments for HCV infection are IFN-α (alpha interferon) or its polyethylene glycol-modified form in combination with ribavirin, but the sustained virological response (SVR) rate, a measure of the effectiveness of HCV treatment, varies from 80% for genotype 2a to only 41% for genotype 1b, and the side effects decrease the treatment compliance (Manns M P, et al., 2001).
The human hepatoma cell line Huh7 has been shown to be the only cell line highly permissive for HCV subgenomic RNA replication and HCV infection. Several Huh7-derived cell lines, such as Huh7.5, Huh7.5.1, and Huh7-Lunet (Lunet), which were generated by prolonged IFN or other specific drug treatment of Huh7 cells harboring HCV replicons, have been found to be more permissive for HCV RNA replication (Blight K J, et al., 2002; Friebe P, et al., 2005; Zhong J, et al., 2005). Furthermore, Huh7.5, Huh7.5.1, and Lunet cells with ectopic CD81 expression have been shown to be highly permissive for HCV infection and infectious virion production (Koutsoudakis G, et al., 2007; Lindenbach B D, et al., 2005; Zhong J, et al., 2005). The exact mechanism of the higher permissiveness of these cells is still unknown. It was hypothesized that a favorable cellular environment exists within these cells (Blight K J, et al., 2002). A point mutation in the dsRNA sensor retinoic acid-inducible gene-I (RIG-I) of Huh7.5 cells (Sumpter R, et al., 2005) and a lower expression of the exogenous dsRNA sensor Toll-like receptor 3 in Huh-7 cells (Li K, et al., 2005) could explain the robust replication of HCV in these cell lines (Bartenschlager R, et al., 2005).
HCV has been thought to be noncytopathic in vivo. The liver injury associated with HCV infection is assumed to be an immune-mediated process. However, a direct cytopathic effect in hepatoma-derived cell lines has been reported by some groups (Zhong J, et al., 2006; Zhu H, et al., 2007). A transcriptome analysis performed in Huh7.5 cells indicated that modification of cell-cycle-related genes was responsible for cell death induced by HCV infection (Walters K-A, et al., 2009). Experiments in an uPASCID-mouse model provided evidence that endoplasmic reticulum stress combined with lower NF-κB and BCL-xL levels induced by HCV infection sensitized hepatocytes to apoptosis (Joyce M A, et al., 2009).
In this report, we compare the replication of HCV and the response of cells to infection in Huh7.5.1 cells and Lunet-CD81 cells. A slightly higher replication level of HCV was found in Huh7.5.1 cells than in Lunet-CD81 cells, but the viability of Huh7.5.1 cells was reduced significantly after long-term HCV infection. Further analysis showed that the G1/S transition was blocked by HCV infection in Huh7.5.1 cells. Thus, we found that, although both are derived from Huh7 cells, Huh7.5.1, and Lunet-CD81 cells responded differently to HCV infection and that Lunet-CD81 cells might survive long-term HCV infection and be suitable for studies of persistent infection.
HTML
-
Huh7.5.1 cells were cultured in Dulbecco's minimal essential medium supplemented with 10% fetal bovine serum (Gibco) and 1×antibiotic-antimycotic (Gibco). Lunet-CD81 cells were cultured in Dulbecco's minimal essential medium supplemented with 10% fetal bovine serum and 500 µg/mL G418 (Gibco). All cells were cultured under humidified conditions with 5% CO2 at 37 ℃.
Mouse CD81 antibody was purchased from Chemicon. Propidium iodide (PI) was purchased from Sigma Aldrich.
-
The HCV J399EM strain was derived from the JFH-1 virus by insertion of enhanced green fluorescent protein (GFP) into the HCV NS5A region (Han Q, et al., 2009) and amplified and titrated according to the standard protocols.
-
Cells were collected by trypsinization and washed with phosphate buffered saline (PBS) three times, then resuspended in PBS containing 5% normal goat serum for 1 h. Cells were then incubated with anti-CD81 antibody (1:100) at 37 ℃ for 1 h and fluorescein isothiocyante-conjugated anti-mouse IgG secondary antibody (1:100) at 37 ℃ for 1 h sequentially. Samples were subjected to flow cytometry (BD Accuri C6 Flow Cytometer) after washing.
-
For cell cycle analysis, cells were harvested at the chosen time point and incubated in PBS containing 20 μg/mL PI, 200 μg/mL RNase A, and 0.1% Triton X-100 at 37 ℃ for 20 min. The stained cells were then analyzed for cell cycle distribution by flow cytometry (BD Accuri C6 Flow Cytometer).
Cell cycle synchronization analysis was performed as previously described (Pei R, et al., 2011). Briefly, cells were treated with 10 ng/mL aphidicolin for 24 h for cell cycle synchronization and then washed three times with PBS to release cell cycle arrest. Then cells were harvested every 4 h thereafter and the cell cycle was analyzed by PI staining.
-
Total RNA was extracted with the TRIzol or TRIzol-LS reagent (Invitrogen). The first-strand cDNA was prepared by using the oligo (dT) 15 primer (Promega) or random primer and the M-MLV reverse transcriptase (Promega), according to the manufacturer's instructions. qRT-PCR was performed using the SYBR Green PCR Master Mix (Toyobo) on the ABI StepOne Real-Time PCR System (ABI). Primers are listed in Table 1. The copy numbers of specific mRNAs were normalized to the mRNA level of GAPDH (glyceraldehyde 3-phosphate dehydrogenase). All experiments were performed in triplicate and repeated at least three times.
Primer Accession Sequence GAPDH-F NM_002046.4 5'-180-GAAGGTGAAGGTCGGAGTC-3' GAPDH-R 5'-405-GAAGATGGTGATGGGATTTC-3' HCV-F 5'-TCTGCGGAACCGGTGAGTA-3' HCV-R 5'-TCAGGCAGTACCACAAGGC-3' Table 1. The primers listed in this paper
-
Microarray experiments were performed in triplicate. Total RNA was extracted from mock-or J399EM-infected Huh7.5.1 cells and subjected to microarray analysis by Whole Human Genome Microarray Kit, 4x44K (Agilent). Genes with changes ≥ 2-fold and P value Log Ratio < 0.05 were considered as statistically altered by HCV infection.
-
The statistical significance of the obtained data was analyzed by two-tail unpaired t-test in GraphPad Prism (GraphPad Software, San Diego, USA). A P-value less than 0.05 were considered as statistically significant. Data were presented as the means ± standard deviations.
Cell lines and reagents
Virus
CD81 expression analysis by flow cytometry analysis
Cell cycle analysis by PI staining
Quantitative real time reverse transcription PCR (qRT-PCR)
Gene array assay
Statistical analysis
-
It had been demonstrated that Lunet cells are highly permissive for the replication of HCV subgenomic replicons, and ectopic expression of CD81 enables the cells to be permissive for HCV infection (Koutsoudakis G, et al., 2007; Pokrovskii M V, et al., 2011). Here we established a Lunet-CD81 cell line stably expressing CD81 and compared the response of Huh7.5.1 cells and Lunet-CD81 cells to HCV infection. Firstly, the expression of CD81 was determined by flow cytometry analysis. As shown in Fig. 1A, the expression level of CD81 on the cell surface of Lunet-CD81 cells was a little higher than on the surface of Huh7.5.1 cells, but the percentage of CD81-positive cells of both cell lines was similar. The replication dynamics of HCV in Huh7.5.1 cells and Lunet-CD81 cells was then compared. The intracellular HCV RNA level and HCV RNA in the supernatant were measured by qRT-PCR respectively at different time points post J399EM (at multiplicity of infection (MOI) of 1) infection (Fig. 1B and C). The intracellular HCV RNA levels were boosted significantly at 48 h post infection (hpi) and increased gradually thereafter in both cell lines, though the HCV RNA level in Huh7.5.1 cells was about 2-fold higher than in Lunet-CD81 cells (Fig. 1B). The HCV RNA copy number in the supernatant also increased gradually and peaked at 72 hpi in both cell lines; a lower level of HCV RNA and virus titer in supernatant were found in Lunet-CD81 cells, consistent with the intracellular HCV RNA level (Fig. 1C and D). Thus, Lunet-CD81 cells support HCV infection but have lower efficiency than Huh7.5.1. The assembly efficiency and the specific infectivity at 96 hpi were calculated by the ratio of HCV RNA copy number in the supernatant to the intracellular HCV RNA copy number and the ratio of HCV titer to HCV RNA copy number in the supernatant, respectively (Fig. 1E). The virion assembly efficiency in Lunet-CD81 cells was about 2 logs less than that in Huh7.5.1 cells indicating a deficiency of Lunet-CD81 cells in virion assembly.

Figure 1. The construction and verification of Lunet-CD81 stable cell line. A: CD81 expression level in indicated cell lines. Huh7.5.1 and Lunet-CD81 cells were grown for 24 h and harvested for CD81 staining. B–D: The growth of HCV in Huh7.5.1 and Lunet-CD81 cells. Huh7.5.1 and Lunet-CD81 cells were infected with J399EM at MOI of 1 and incubated for the indicated period. B: Total RNA was collected and submitted to real-time RT-PCR to determine the intracellular HCV RNA level. GAPDH was calculated and served as internal control. C: HCV RNA in the supernatant was extracted by Trizol-LS reagent and determined by realtime RT-PCR. D: The HCV titer in the supernatant was detected by end-point dilution assay. E: The assembly efficiency and the specific infectivity at 96 hpi were calculated. The assembly efficiency was shown by the ratio of HCV RNA copy number in the supernatant to the intracellular HCV RNA copy number. The specific infectivity was calculated by the ratio of HCV titer to HCV RNA copy number in the supernatant. F: Huh7.5.1 and Lunet-CD81 cells were infected with J399EM at MOI of 1 and incubated for 6 days. The cell morphology is shown by the bright field microscopy image. HCV infection was indicated by the GFP expression in the cells (Scale Bar=200 µm)
It is interesting that a cytopathic effect was observed in Huh7.5.1 cells but not in Lunet-CD81 cells infected with HCV. Huh7.5.1 cells underwent cell death at 6 days post infection (dpi) while Lunet-CD81 cells still proliferated (Fig. 1F), though both cells were 100% infected as indicated by GFP fluorescence.
-
Since the proliferation of Huh7.5.1 cells, but not Lunet-CD81 cells, was reduced upon infection, the cell cycle distribution of the two cell lines post HCV infection was analyzed. Huh7.5.1 and Lunet-CD81 cells were infected with J399EM at MOI of 1 and incubated for 96 h, by which time most of the cells were infected. The distribution of cells in different cell cycle phases was analyzed by flow cytometry and is summarized in Fig. 2. The percentage of cells in G1, S, and G2/M phases of mock infected Huh7.5.1 cells were 48.5%, 38.7% and 12.8%, respectively. After HCV infection the percentage of cells in G1 increased to 60.6%, while the percentage of S phase decreased to 14.9% (Fig. 2A). Compare to uninfected cells, the cell cycle of Lunet-CD81 cells did not change significantly after HCV infection (Fig. 2B). Thus, HCV infection changed the cell cycle in Huh7.5.1 cells but not Lunet-CD81 cells.

Figure 2. Cell cycle distributions of Huh7.5.1 and Lunet-CD81 cells with mock or HCV infection. Huh7.5.1 (A) and Lunet-CD81 cells (B) were infected with J399EM at MOI of 1 and incubated for 96 h. Cells were trypsinized and collected in tubes followed by fixation and PI staining. Flow cytometry analysis was performed to determine the cell cycle phase.
The cell cycle of Huh7.5.1 cells was then analyzed daily from 2 to 6 dpi (Table 2). To exclude the influence of cell confluence on the cell cycle distribution, cells were passaged once at 72 hpi. A significant increase of cells in G1 phase and a decrease of cells in S phase were found from 48 hpi; meanwhile, an increase of cells in G2/M phase was observed.
Passage No. Hours post infection (h) mock infected G1 S G2/M G1 S G2/M 1 48 48.5 34.1 17.45 51.2 23.1 25.75 1 72 51.65 34.15 14.2 60.9 22.4 16.75 1 96 48.95 35.6 15.45 71.5 0 28.5 2 120 55.65 28.35 16 68.25 10.35 21.4 2 144 53.9 23.7 22.35 73.2 6.2 20.6 Huh7.5.1 cells were infected with J399EM at 1 MOI and incubated for indicated period. Cells were passaged once at 72 h post infection. Cells were trypsinized and collected in tubes followed by fixation and PI staining. Flow cytometry analysis was performed to determine the cell cycle phase of the cells. The percentage of cells in each phase were listed. Table 2. The changes of cell cycle distribution of Huh7.5.1 cells induced by HCV infection
To further analyze the cell cycle processes, Huh7.5.1 cells were treated with aphidicolin for 24 h after HCV infection, which caused cell cycle synchronization at G1 phase. After release from inhibition, uninfected cells could pass through G1 phase to S and G2/M phase sequentially (Fig. 3 upper). However, cells infected with HCV retained at G1 phase and could not get through S phase after release from aphidicolin (Fig. 3 lower). Taken together, these results indicated that HCV infection perturbed the G1/S transition and caused cell cycle blocking at G1 phase.
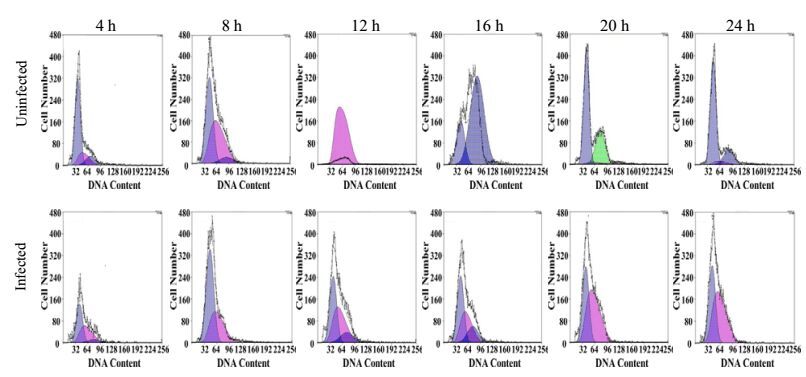
Figure 3. Blockage of G1/S transition of Huh7.5.1 cells by HCV infection. Uninfected (upper) or J399EM-infected cells (lower) were treated with aphidicolin for 24 h. Cells were collected at indicated time points after aphidicolin removal. After fixation and PI staining, cells were analyzed by flow cytometry to determine the cell cycle phase. The blue area indicates the G1 phase, the pink indicates the S phase and the green indicates the G2/M phase.
-
Three pairs of gene array analysis were performed to compare the mRNA levels in uninfected and HCV-infected Huh7.5.1 cells, and to identify genes modified by. HCV infection. By gene ontology analysis, 120 genes related to the cell cycle were grouped among thousands of genes changed during HCV infection, indicating a potential role of HCV infection in cell cycle perturbation. These genes were further analyzed by gene interaction analysis in GeneSpring GX in Direct Interactions mode and 31 genes that directly interact with each other are listed in Fig. 4, showing that not only individual genes but also the entire networks are impacted. Among the genes with most interactions, CDC25, which was down-regulated 3-fold, is required for progression from G1 to S phase of the cell cycle. CCNA2, which was down-regulated 2.5-fold, promotes cell cycle G1/S and G2/M transition, CCNB1 (down-regulated 2-fold) is a regulatory protein involved in mitosis, and BUB1B and MAD2L1 (both were down-regulated 2.1-fold) are involved in spindle checkpoint function indicating that HCV infection might influence both G1/S and G2/M transition in Huh7.5.1 cells. Detailed information on these genes is listed in Supplemental Table 1.

Figure 4. Gene interaction analysis of genes related to cell cycle in a gene array data. Gene interaction analysis in GeneSpring GX in Direct Interactions mode highlights 31 genes that have direct interactions with each other. Genes with the highest number of interactions were shown in extended size.
The HCV infection in Huh7.5.1 cells and Lunet-CD81 cells
Cell cycle arrest caused by HCV infection in Huh7.5.1 cells
Genes related to cell cycle progress in a gene array analysis
-
Establishment of the HCV culture system using JFH-1 virus and Huh7-derived cell lines has allowed the generation of infectious HCV particles. In the present study, we restored the CD81 expression in Lunet cell line. The infection and replication level of HCV in Huh7.5.1 was slightly higher than in Lunet-CD81 cells. However, Lunet-CD81 cells survived long-term HCV infection, while HCV infection in Huh7.5.1 cells caused cell cycle arrest and a cytopathic effect.
Although both Lunet-CD81 and Huh7.5.1 cells were generated from the Huh7 cell line and both were highly permissive for HCV genomic replicon, the infection and replication level of HCV and the response of these two cell lines to HCV infection were different. Consistent with previous results (Koutsoudakis G, et al., 2007), the ectopic expression of CD81 molecular in Lunet cells allowed the cells to be permissive for the infection and production of infectious HCV particles. The RIG-I gene defect in Huh7.5.1 cells (Sumpter R, et al., 2005) somehow explained the higher replication level of HCV. The difference between Huh7.5.1 and Lunet-CD81 cells could also be explained by the heterogeneity of Huh7 cells and by the fact that Huh7 cell lines maintained in various laboratories exhibit distinct morphological, cell growth, and HCV susceptibility properties (Sainz B, Jr., et al., 2009).
Cell cycle arrest of HCV infected cells has been reported by several groups. Walters et al. reported a reduction of the presence of cells in S-phase in J6/JFH1 infected Huh7.5 cells, and assumed that HCV infection is associated with delayed cell cycle progression (Walters K A, et al., 2009). An increase in G1 and G2/M phase and reduction in S phase was observed in Huh7.5 cells infected with JFH1; it was suggested that HCV-infected cells are impaired for mitotic entry and progression through mitosis and accumulate at the interface of G2 and M phases (Kannan R P, et al., 2011). In our experiments, we observed a decrease of cells in S phase and an increase in G1 and G2/M phase after HCV infection of Huh7.5.1 cells. Furthermore, by synchronizing the cell cycle with aphidicolin, we demonstrated that HCV-infected Huh7.5.1 cells could not pass the G1/S transition, and a gene array analysis suggested that both G1/S and G2/M transitions were impaired by HCV infection, which is consistent with previous reports (Kannan R P, et al., 2011; Walters K A, et al., 2009).
Regarding the effect of HCV proteins on the cell cycle process, controversial results had been reported (Alisi A, et al., 2005; Liu J, et al., 2011; Wang Y, et al., 2011; Yang X J, et al., 2006). Similar to our finding that HCV induced cell cycle arrest in Huh7.5.1 cells, but not in Lunet-CD81 cells, Murayama et al. reported a cell line Huh-7T1 that was resistant to cell cycle arrest by HCV replication (Murayama A, et al., 2012). Since the exact mechanism of HCV-induced cell cycle arrest remains unclear, these cell lines, Lunet-CD81, Huh-7T1, and Huh7.5.1 might be a useful tool in further analysis.
The cytopathic effect of HCV infection in cell culture has been reported recently (Zhong J, et al., 2006; Zhu H, et al., 2007). JFH-1 can induce cytopathic effects in Huh-7.5.1 cells and, to a lesser degree, in Huh-7 cells (Zhong J, et al., 2006). A transcriptome analysis performed in Huh7.5 cells (Joyce M A, et al., 2009) suggested that the modification of cell cycle related genes are responsible for the cell death induced by HCV infection (Walters K-A, et al., 2009). HCV also induced apoptosis in infected cells (Deng L, et al., 2008), and HCV induced mitochondrial dysfunction and endoplasmic reticulum stress could contribute to the cell death associated with HCV infection (Brault C, et al., 2013; Ke P Y, et al., 2012). We also observed a cytopathic effect of HCV in Min6 cells, a pancreatic beta cell line (Wang Q, et al., 2012). In the present study, we found that Lunet-CD81 cells were somehow resistant to HCV-induced cell death; this could be explained by the finding that the cell cycle progress of Lunet-CD81 was not perturbed by HCV infection.
In conclusion, we found that Lunet-CD81 cells and Huh7.5.1 cells respond differently to HCV infection, and that Lunet-CD81 cells might be suitable for persistent infection of HCV. A comparison of Lunet-CD81 and Huh7.5.1 cells might provide more evidence during the study of host-cell interaction.
-
We are grateful to Ms. Yuan Zhou and Ms. Xue Hu for their helpful work in the cell culture. This work was supported partly by grants of National Nature Science Foundation of China (grant 31200135)
-
XW Chen and RJ Pei designed the experiments. HH Chen performed the experiments. HH Chen and RJ Pei analyzed the data and wrote the paper.

 DownLoad: