


-
Transmissible spongiform encephalopathies (TSEs), or prion diseases, are fatal neurodegenerative diseases, including scrapie in sheep and goats, bovine spongiform encephalopathy (BSE or mad cow disease), human Creutzfeldt–Jakob disease (CJD), and chronic wasting disease (CWD) of deer and elk. Prions are transmis-sible particles that are devoid of nucleic acids and seem to be composed exclusively of a modified protein (PrPSc), which is converted from a normal cellular prion protein (PrPC) [17, 18]. Prions are insoluble in non-denaturing detergent and resistant to protease. Spongiform vacuolation, accumulation of abnormal PrPSc, neuronal loss, astrocytic gliosis and microglial activation are the prominent pathological features of prion diseases in the centre nervous system (CNS) [1, 19]. The presence of microglia was necessary for the neurotoxcity of PrPSc and microglial activation was detected early in the incubation period of scrapie stain-infected mice in vivo [11]. Six brains from cases of sporadic (Creutzfeldt-Jakob disease, CJD) showed by immunohistochenical labeling that microglial activation occurred in grey matter where PrPSc was deposited, and activated microglia surrounded the outer rim of spongy vacuoles [14]. An early microglial activation preceded obvious deposits of prion protein (PrP) amyloid in CJD infected rats [2].
The synthetic human prion protein fragment PrP 106-126 showed the same properties as prions, like protease resistance, polymerization into amyoid-like fibrils in vitro, secondary structure composing largely of β-sheets and neurotoxicity [10, 16]. PrP 106-126 was found to be neurotoxic to primary rat hippocampal neuron cultures and mouse neuroblastoma N2a cells [3]. PrP 106-126 has now become a universal prion model for study of prion diseases. A previous study revealed that PrP 106-126 was found to be able to induce microglial activation and to elicit an increase of intracellular calcium levels [15].
PrPC, encoded by PRNP gene, is normally present in glial cells [13] and is the basic molecule responsible for prion pathogenesis. Prnp0/0 mice showed resistance to scrapie and could not develop prion disease [5, 20]. In vitro, high levels of expression of PrP mRNA were detected in cultured microglial cells isolated from both scrapie-infected and uninfected mouse brain [8]. Microglia are immune cells for the brain and microglial activation occurs in prion disease, however, the role of microglial activation in the development of prion pathogenesis is unclear, and it remains to be determined whether activated microglia cells contribute to neuronal damage or participate in clearance of prion agent around neurons. To explore the role of microglia cells for prion disease, we have investigated the effect of PrP 106-126 on PrP mRNA expression in mouse microglia cell line BV-2 cells.
HTML
-
A BV-2 mouse microglial cell line was obtained from the Cell Centre for the School of Basic Medicine, Peking Union Medical College, Chinese Academy of Medical Sciences. The human sequence of the prion protein fragment PrP 106-126 (KTNMKHMAGAA AAGAVVGGLG) and the scrambled sequence (SCR) were synthesized by Shanghai Sangon (China). SCR was used as a negative control for all experiments. Lyophilized peptides were dissolved in PBS (pH 7.4). A SYBR Green I qPCR kit was purchased from Tiangen Bio-Tech (Beijing, China), Trizol RNA Extraction Kit was purchased from Invitrogen (USA) and the cDNA Synthesis Kit was purchased from Promega (USA). MTT and DMSO were both from Sigma (USA).
-
Mouse microglial cells BV-2 were cultured in DMEM/F12 medium (GIBCO) supplemented with 10% Fetal Bovine Serum (FBS)(Gibco, USA) and standard antibiotics (100 U/mL penicillin, and 100 μg/mL streptomycin) at 37℃ in 5% CO2. After BV -2 cells had attached to the surface of culturing plate and proliferated for 12 h, the culture medium was replaced with fresh DMEM/F12 medium containing 5% FBS and standard antibiotics. Then, freshly prepared PrP106-126 or SCR (both at final concentration of 25 μmol/L) were added into the cultures
-
BV-2 Cells were seeded at a density of 4×10⁴ cells/well. After culturing with complete medium containing 5% FBS for 24 h, the cultured BV-2 cells were randomly divided into 3 groups: 25 μmol/L, PrP 106-126 group, 25 μmol/L SCR group and a untreated control group, and PrP 106-126 and SCR were added into the corresponding cultures. After 18 h or 24 h treatments, each group of cells (about 6×10⁶ cells) was colleted, and total RNA was extracted and purified from cell samples following the protocol of the Trizol RNA Extraction Kit. Concentration of each RNA sample was quantified with a value of 1μg/L, and RNA samples were reverse-transcribed to cDNA with an oligo(dT) primer. PCR primer sequences and the optimal PCR program used in this study are shown in Table 1. β-actin was used as a housekeeping gene and PCR was performed in a final reaction volume of 20 μL. The purified PrP gene product was cloned into pGEM-T-easy vector and the recombinant plasmid was constructed and sequenced. The sequenced results showed 100% homology with the sequence published in GenBank. The confirmed recombinant plasmid was subjected to 10-fold serial of dilution, from 10-1 to 10-6, which was used as cDNA standards for real-time qPCR of PrP gene. The cDNA standards for the β-actin gene were also obtained with the same method as PrP gene. Equal cDNA amounts of sample together with PrP cDNA standards or β-actin cDNA standards were subjected to real-time qPCR using the standard curve assay. The data of expression level of PrP mRNA was determined by normalizing the copies of PrP to that of β-actin using therelative standard curve method.

Table 1. Primer sequences and PCR parameters used for Real-time qPCR
-
Cell proliferation was determined by MTT assay by seeding 1× 10³ cells into 96-well plates. Groups were set as defined above. After experimental treatment for 18 h or 24 h, each group of cells was incubated with MTT with a final concentration of 0.5 mg/mL at 37℃ for 4 h. Then supernatant were removed and 150 μL of DMSO were subsequently added into each well. Absorbance values were measured at 490 nm using a microplate reader (BIO-RAD, USA). The value of cell proliferation was plotted as percent of the value measured for the control.
-
The data were expressed as means ±SD of 3 replications per experiment. Data were analyzed by t-test by SPSS 11.5 software. Differences with P < 0.05 were considered statistically significant.
Materials
Cell Culture
Purification of RNA and Real –time Quantitative PCR of PrP gene
Cell Proliferation Assay
Statistical analysis
-
The primers for PrP and β-actin both showed high specificity (Fig. 1) and standard curves were demons-trated high linearity, with r2 = 1.000 for PrP (Fig. 2A), and r2 = 0.999 for β-actin (Fig. 2B). The expression of the PrP gene was increased in a time-dependent manner after BV-2 cells were exposed to PrP 106-126 (Fig. 2C). Compared with the untreated control, PrP mRNA expression levels was significantly increased after 18 h treatment, with about a 3-fold increase for the 18 h treatment (P < 0.05), and about a 4.5-fold increase for the 24 h treatment (P < 0.01). No significant changes were observed in the SCR-treated group.
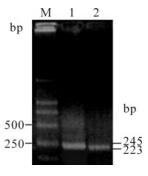
Figure 1. PCR amplication for PrP gene and β-actin of BV-2 cells. Lane 1, 245 bp of PrP; lane 2, 223 bp of β-actin; M, DNA marker (DL2000).
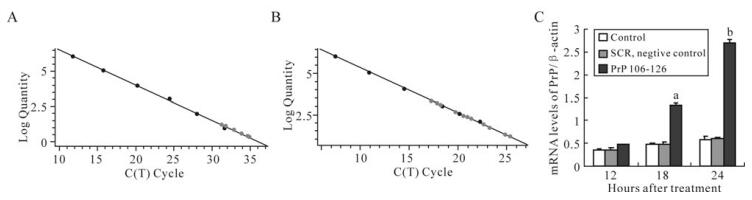
Figure 2. Effect of PrP106-126 on PrP mRNA expression of BV-cells by Real-time qPCR. A: Real-time qPCR standard curve for PrP gene. B: Real-time qPCR standard curve for β-actin gene. C: The alteration of PrP mRNA expression level after treatment with PrP106-126. Values are relative and obtained by normalizing the copies of PrP to that of β-actin using arelative standard curve method. The values are indicated as means ± S.D. of triplicate experiments. aP < 0.05 and bP < 0.01 mean statistically significant differences between PrP106-126-treated groups and untreated control.
-
MTT results showed that BV-2 cell proliferation was increased after 18 h of treatment by PrP 106-126 (Fig. 3), with a 31.8% increase over the standard control (100%) for 18 h, and a 64.6% increase for 24 h. SCR had no effect on BV-2 cell proliferation.
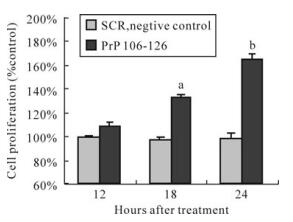
Figure 3. Effect of PrP106-126 on cell proliferation of BV-2 cells. The data are indicated as mean ± S.D. of triplicate experiments and plotted as percent of control. aP < 0.05 and bP < 0.01 mean statistically significant differences between treated groups and untreated control.
Increased expression of PrP mRNA gene
Increased cell proliferation
-
Brown et al detected high levels of PrP mRNA in cultured microglial cells isolated both from scrapie-infected mouse brain [8], but they didn't report the PrP mRNA expression difference between scrapie-infected and uninfected brain microglial cells. We found that PrP mRNA expression level was greatly increased by the prion protein PrP 106-126 in BV-2 microglial cells. PrP 106-126 inclusions were detected in murine microglial cells in vitro [12], and previous reports showed that PrP 106-126 was internalized into microglial cells via formyl-peptide-receptor-like-1 (FPLR1) [6], and here we could speculate that PrPC was involved in the internalization of PrP 106-126 in microglial cells.
Microglial activation precedes neurotoxicity in prion disease. Although many studies have shown the presence of microglial activation in prion disease, the role of microglial activation is still a mystery. Possible explanations are that microglial activation contributes to neuronal damage by PrPSc [7, 9, 11], activated microglial cells act as a reservoir for PrPSc deposition [4], or microglial activation is a response to abnormal PrP deposition rather than neuronal loss [21]. In our study, the cell proliferation was increased after BV-2 cells exposure to PrP 106-126. The altered PrP mRNA expression and cell proliferation might reflect BV-2 cells activation by PrP 106-126, and this finding revealed that microglial cells were activated in response to amyloid-like PrP 106-126.
In conclusion, PrP 106-126 increased PrP mRNA expression of mouse microglial BV-2 cells and raised cell proliferation, and this could partially account for the role of microglial activation in prion diseases.


 DownLoad: