


-
Human cytomegalovirus (HCMV) infections are prevalent worldwide. It is the leading cause of congenital infection, nervous system injury being the major complication. About 5-10% of infected neonates show severe neurological injury, such as microcephaly or cerebral edema, while ~10% of children surviving congenital infection have permanent mental retardation, deafness and other manifestations of delayed injury [4, 17]. However, the mechanisms by which HCMV infection lead to malformations are not yet well understood as they are limited by species specificity.
Rat cytomegalovirus (RCMV) has high homology with the HCMV genome, both of which have similar timing in gene transcription and expression, similar immediate early genes, and vertical transmission to the fetus through the placenta. Based on these factors, it is important to establish RCMV infection in a rat embryo model as an aid to understanding the mechanism of HCMV-induced malformations and brain damage.
In this study, we inoculated pregnant Wistar rats with RCMV to explore its effects on the morphological development of the embryonic nervous system. Primary cultured embryonic hippocampus neural stem cells (NSCs) were subjected to RT-PCR and Western blot analysis to assay the mRNA expression of Frz1, β-catenin, GSK-3, LEF1 and Ngn1, and to assess the effects of RCMV infection on NSC proliferation, differentiation and development.
HTML
-
This study was carried out in strict accordance with the recommendations in the Guide for the Care and Use of Laboratory Animals of the National Institutes of Health. The protocol was approved by the Committee on the Ethics of Animal Experiments of Weifang Medical University. All surgery was performed under sodium pentobarbital anesthesia, and all efforts were made to minimize suffering.
-
RCMV was kindly gifted by Professor Dr. Bruggeman CA, Maastricht University Medical Centre. Fifty adult nulliparous female and 10 adult male Wistar rats (230±10 g) were purchased from the Zhejiang University School of Medicine Animal Center and kept at room temperature. Tail vein blood was taken from all experiment animals to test for the RCMV pp65 gene by PCR.
-
DEME/F12 was from Hyclone; B27, basic fibroblast growth factor, and epidermal growth factor were from Gibco; fetal bovine serum was purchased from Hangzhou Sijiqing Biological Engineering Materials Co.; rabbit-anti-rat nestin (1:200), rabbit-anti-rat MAP2 (1:200) and rabbit-anti-rat glial fibrillary acidic protein (GFAP) (1:200) were purchased from Chemicon; β-catenin goat antibody was purchased from Santa Cruz. The primers in RT-PCR were based on sequences downloaded from Genbank, designed by Primer 5, and synthesized by the Shanghai Sangon Biotech Co. The sequences of the primers are given in Table 1.

Table 1. Primers used in the study
-
Two females were mated with each male overnight from 20:00. Next morning, vaginal smears were examined. The day a positive result with sperm was found was set as day 1 or E1, i.e., the first day of gestation. Forty pregnant rats were randomly divided into 2 groups: infection and control. In the infection group, at E1, pregnant rats were inoculated with 1 mL intraperitoneally. A RCMV viral suspension was used with a MOI=4, based on preliminary experiments. (The pregnant rat and fetal infection rates were ~90%). After 5 days, rats were tested by RCMV-pp65 PCR in tail blood and RCMV-positive rats were set as the infection group. In the control group, 1 mL of cell culture supernatant was injected instead of RCMV with the same treatment and time points.
-
From both experimental and control groups, 5 pregnant rats were taken at E20 and sacrificed for fetuses to evaluate the RCMV teratogenic risk. Fetal survival was noted and the number of embryos implanted, the number of live births, and the number of stillbirths was counted to calculate the stillbirth rate (number of stillbirths/number of implants×100%) and the malformation rate (number of defects/number of implants× 100%). The fetal body weights and placental weights were recorded and body and tail length were measured.
-
The Morris water maze was used to study the learning and memory of four week old rats. The process was as follows: Before the experiment, a rat was placed on the platform hidden below the water for 10 seconds to adapt and then was placed at four different initial sites in the pool and facing the wall of the pool. The time period from the rat being released to reaching the platform was recorded as the escape latency. The longest time for the test was set at 120 seconds. If the rat could not reach the platform, it would be placed on platform for a further 10 seconds to adapt. After each experiment, the rat was dried by wiping and placed back into its cage. Four experiments were performed each day with an interval of 1 hour [14].
-
Rat embryonic cerebral cortex at E13 was gently cut into pieces with ophthalmic scissors After mixing well, trypan blue staining was carried out for cell counting, and 5×10⁵ cells/mL were placed in 25-cm3 culture flasks at 37 ℃ in a 5% CO2 incubator. NSC proliferation was calculated for each group. Third passage neurospheres in good condition were collected and centrifuged at 1000 rpm for 5 min. Then the supernatant was removed and a small amount of culture medium added to make a single cell suspension. NSCs were seeded at 1×10⁴ cells/well of 24-well-plates (6 wells/group). Each well contained 1 mL whole culture medium. After incubation under 5% CO2 for 7 days, the total number of cloned neurospheres, of size exceeding 100 µL, in each well was counted under an inverted microscope. Cloning efficiency (%) = total number of neurospheres/number of inoculated cells ×100%.
-
In each group, neurospheres in good condition were centrifuged at 1000 rpm for 5 min. Then the supernatant was removed and a small amount of differentiation medium was added to seed the cells in 24-well plates to assess differentiation. Half of the neurospheres were stained for nestin immune fluorescence after adhering to the dish, and the other half were continuously cultured for differentiation over 5 days. An inverted microscope (LEICA DMIRE2) was used to observe the differentiation status. Immune fluorescence staining for rabbit anti-rat neuronal MAP2 (1:200) and GFAP was performed and the numbers of positive cells in 10 randomly-selected fields were counted to calculate the ratio of neurons and glial cells.
-
Differentiated NSCs from each group were collected after stimulation for 1, 2 and 3 d. Trizol was used to extract total NSC RNAs. Reverse transcription and PCR were performed according to the standard protocol. The host gene was GAPDH as internal control and negative control was deionized water instead of cDNA templates.
-
NSCs differentiated at day 1, 2 and 3 were collected and the nuclear protein was extracted according to the Nucleoprotein Extraction Kit protocol (Shanghai Sangon Biotech, China). For each sample, 20 μg was denatured in a boiling water bath for 5 min. Proteins were resolved by electrophoresis on an SDS-containing polyacrylamide gel, transferred to a polyvinylidene difluoride (PVDF) membrane at 15 V for 60 min, and then blocked with 50 g/L skimmed milk powder for 1 h at room temperature. The primary monoclonal antibody rabbit anti-rat β-catenin was added at 1:2000. PVDF membranes were incubated at 4 ℃ overnight and reacted with the HRP-conjugated secondary antibody goat anti-rabbit IgG, (1:1000) for 1 h, then visualized by SuperSignal West Pico chemiluminescent substrate (Thermo Scientific). The absorbance was assayed and β-actin was set at 1.
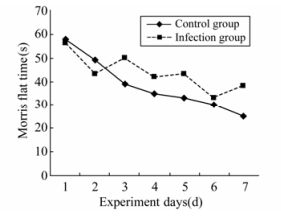
Figure 1. Four-week-old pup rats water maze latency stage experiment.
-
The SPSS 12.0 package was used for statistical analysis. Embryo development and the neurosphere formation rate in each group were compared using the R×C table χ2 test. Morris water maze escape latency was determined using analysis of variance. Quantity One was used to scan band density in RT-PCR and Western blots. The OD values and PCR results are given as mean ± standard deviation and differences between groups were assessed using the unpaired t-test. P < 0.05 was taken to indicate a statistically significant difference.
Ethics statement
Virus and Laboratory Animals
Reagents
Experimental groups
Embryonic observations and numbers of RCMV-infected rats
Functional assessment of the nervous system in young rats
Cloning of NSCs
Differentiation of NSCs
RT-PCR detection of Frz1, beta-catenin, GSK-3beta, LEF1 and downstream target gene Ngn1 in NSCs
Use of Western blotting to detect β-catenin expression
Statistical analysis
-
In the control group, embryonic development was normal and without malformation; stillbirth rate was low at 2.90% (67 survivals and 2 deaths). No deformity was found. In the infection group, both the malformation rate (4.23%) and stillbirth rate were high (30.99%) (Table 2). (71 survivals and 22 deaths). Three types of nervous system malformation were found in the embryos. Compared with the control, the malformation and stillbirth rates were significantly different (P < 0.01) (Table 2). The indexes of length, tail length, body weight and placental weight in infection group were all lower than those of the control group although not significantly different (Table 3).

Table 2. Developmental status of embryo rats in each group

Table 3. Developmental status of fetal survivals in each group
The escape latencies of 4-week-old rats in the Morris water maze test over 7 days were measured. Repeated measurements showed no difference between days (ANOVA test F=1.217, p=0.894); however, the infection and control groups did differ (F=5.513, P < 0.0001) (Fig. 1).
-
Cells isolated from embryonic cerebral cortex at E13 were round and suspended, without neurite outgrowth. After culture in NSC-conditioned medium for 1-2 days, a few cells were dividing. After 3 days, small round suspended cell masses were found without neurite outgrowth. After 5-7 days, the suspended masses grew to hundreds of mulberry-like neurospheres. In contrast, in the infection group, the cell division, small cell mass formation and large neurosphere formation were all delayed for 48 h compared to control (Fig. 2).
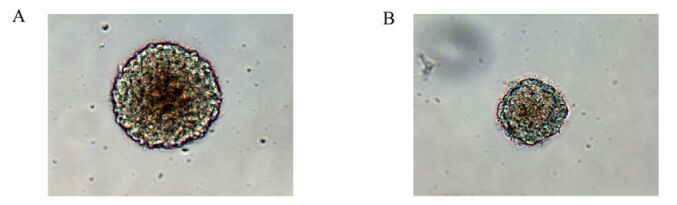
Figure 2. Rat neurospheres cultured for 7 days in the control group (A) were larger than those in the infection groups (B).(×200)
Under 5% CO2 and 37 ℃ the cells grew well and the number and size of neurospheres in the control were greater than those in the RCMV infection group. The clone formation rate in control was 16.5±0.4%, while in the infection group, it was 8.3±0.4% (n=6, P < 0.05) (Fig. 3).
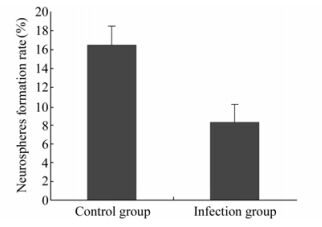
Figure 3. Neurospheres formation rate after NSCs cultured for 7 days.
-
Neurospheres in each group were cultured in differentiation medium for 4 h. Then adherent cells were fixed with cold acetone for 10 min for nestin immunofluorescence staining. Nestin-positive cells were seen in the neurospheres with cytoplasmic staining (Fig. 4), providing evidence that the cultured cells formed neurospheres with NSCs.
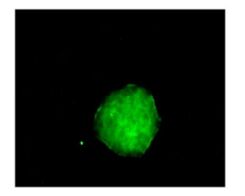
Figure 4. Immunofluorescence staining showed that the cytoplasm of neural stem cells was nestin positive.
Differentiating cells were fixed in cold acetone for 10 min before MAP2 and GFAP immunofluorescence staining. Cells staining positive for MAP2 were identified as neurons, the cytoplasm was GFP-positive, and the cells had a small cell body and a long neurite (Fig. 5). Cells staining positive for GFAP were glial cells with GFP-positive cytoplasm and a large cell body with thick processes (Fig. 6). For Hoechst 33285 staining, all nuclei were stained blue. The results showed that cells in the neurospheres were able to differentiate into neurons and glial cells. Under the microscope (×100), numbers of neurons and glial cells were calculated with 10 random views. In the control group, 11.1% of the cells were neurons and 44.5% of the cells were glial cells. In contrast, in the infection group only 6.0% of the cells were differentiated into neurons and 58.7% to glial cells. These ratios showed that glial differentiation was significantly increased in the latter group (P < 0.01).
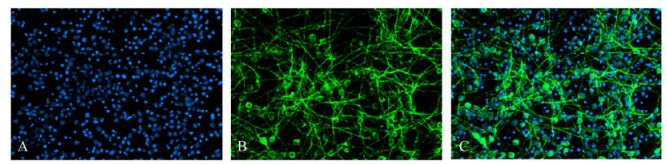
Figure 5. The Immunofluorescence staining showed that partly neural stem cells differentiate for 7 days into cells with cytoplasm expressing MAP2, confirming the cells were neurons. 11.1% of cells were neurons in non-infected group and 6.0% of cells were neurons in infected group. (A: Hoechst33258-positive nuclei; B: cytoplasmic MAP2-positive; C: merged A and B).
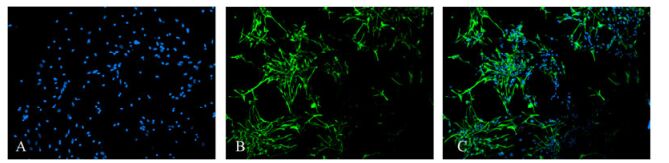
Figure 6. The Immunofluorescence staining showed that some neural stem cells differentiated for 7 days into cells whose cytoplasm expressed GFAP, confirming the cells were glial cells. 44.5% of the cells were glial cells in the non-infected group and 58.7% of the cells were glial cells in the infected group. (A: Hoechst33258-positive nuclei; B: cytoplasmic GFAP-positive; C: merged A and B).
-
For NSC differentiation at days 1, 2 and 3, key Wnt signaling pathway mRNA molecules were detectable both in the control group and the infection group. These were Frz1 (542 bp), β-catenin (290 bp), GSK-3β (251 bp) and LEF1 (844 bp), indicating that fetal rat hippocampal NSCs have the ability to respond to Wnt signals (Fig. 7). On day 1, both NSCs Ngn1 mRNA had lower expression, increased on day 2, and then were reduced on day 3. Note that lane 5 (Fig. 8A) mRNA is weaker than lane 2, showing the mRNA on day 2 is lower on the same day of the control. The difference was significant compared to the control group (Fig. 8A) (P < 0.05 vs control).
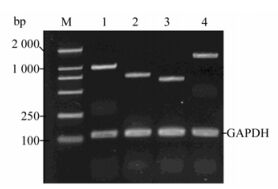
Figure 7. RT-PCR reaction on day 2 proves Wnt/β-catenin signaling pathway messenger RNA expression. M: DL2000 DNA marker; 1, Frz1(991 bp); 2, β-catenin (1627 bp); 3, GSK-3β (646 bp); 4, LEF1 (753 bp); Lane 1-4 also shows GAPDH internal control (122 bp).
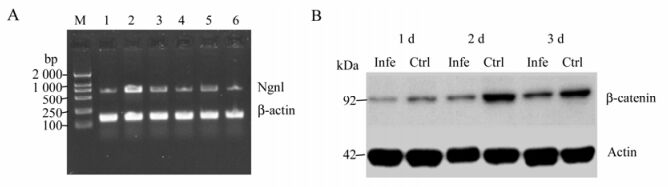
Figure 8. A: RT-PCR reaction on day 1, 2, and 3 to detect Ngn1 mRNA expression. M, DL2000 marker; Lane 1-3, NSCs Ngn1 mRNA expression on day 1, 2 and 3 in the control group; Lane 4-6, NSCs Ngn1 mRNA expression on day 1, 2 and 3 in the infection group; Ngn1 714 bp; β-actin 141 bp. B: Western blot analysis of the nuclear β-catenin protein in NSCs. Lysates were run in duplicate. Actin was used as a loading control.
-
Western blot showed that in both groups, β-catenin in the nucleus after differentiation was strong on day 2, but weak on days 1 & 3. However, the control group was stronger overall (Fig. 8B) (P < 0.05 vs control).
Embryonic development status and nervous system function in embryonic rats
Rat embryo NSC proliferation in vitro
NSC differentiation
Wnt/β-catenin signaling pathway messenger RNA expression
Effect of RCMV on β-catenin expression in NSCs
-
In this study, we chose 1 d after the initiation of pregnancy for RCMV inoculation. At this stage, the neural plate emerges, the neural folds form, and both neural folds move close to the midline to form the neural tube. At this key stage, RCMV appeared to inhibit the process.
Since the nervous system is mainly derived from NSCs which differentiate into neurons and glia, we further determined whether RCMV affected the proliferation and differentiation of NSCs. Our results showed that this effect was observable in early infection. We used NSCs from embryonic rat hippocampus at E13, when neuronal differentiation and development are maximal. Shinmura [19] found that CMV-infected cells are mainly distributed in the cerebral cortex and hippocampus, suggesting that the hippocampus is a CMV-sensitive area and leading us to choose parts of the hippocampus as our experimental target. In this study, NSCs were grown in suspension, forming neurospheres. The NSC-specific marker Nestin was strongly expressed, and NSCs further differentiated into neurons (positive for MAP-2) and astrocytes (positive for GFAP), suggesting that the NSCs we isolated had the characteristics of proliferation and differentiation. In vitro, the single infected cells began to divide, and formed small spherical cell masses and large neurospheres 2 days later than normal, and the number and volume of spheres were less than control.
The differentiation rate of NSCs from infected rat embryos into neurons was lower than the control, but the differentiation rate into glia was significantly higher. This indicated that RCMV infection significantly reduced NSC proliferation, so sufficient NSCs could not form. In addition, RCMV inhibited NSC differentiation, resulting in fewer neurons and more glial cell types, and caused developmental defects of the nervous system.
Wnt signaling is a classic and key regulatory link in NSC proliferation and differentiation. In the absence of Wnt signaling, cytoplasmic β-catenin and GSK-3β, APC, Axin and casein kinase 1α (CK-1α) together constitute the degradation complex [7], inside which GSK-3β and CK-1α contribute to phosphorylation, subsequent ubiquitination and ultimately degradation by the proteasome. Thus, the free β-catenin is kept at a very low level [5].When the Wnt pathway is activated, the binding of Wnt protein to the membrane receptor frizzle protein (Frz) inhibits the activity of GSK-3β, preventing β-catenin phosphorylation. Consequently, β-catenin accumulates in the cytoplasm and more β-catenin enters the nucleus, where it combines with lymphoid enhancer factor (LEF) and initiates the transcription of target genes [9, 18]. Lie found that adult hippocampal stem cells or precursor cells express the Wnt receptor protein and modulatory elements in Wnt-related signaling pathways [11].More recent in vivo studies have shown that NSCs are subject to Wnt signaling regulation [13, 22]. These findings indicate a close relationship between the Wnt signaling pathway and NSC proliferation and differentiation.
To further investigate the inhibition of NSC proliferation and differentiation, we detected the Wnt/β-catenin pathway signals associated with NSC proliferation and differentiation by RT-PCR. The results showed that after the initiation of NSC differentiation, the Wnt/β-catenin-associated molecules Frz1, β-catenin, GSK-3β and LEF1 were detected in the control group, indicating a response of the fetal rat hippocampal NSCs to Wnt signaling.
Because the key step in Wnt signaling is whether the concentration of free β-catenin in the cytoplasm increases sufficiently to enter the nucleus and activate the target genes related to signal downstream transcription, we assessed β-catenin proteins in the nucleus to test our hypothesis.
The Western blotting results showed that the β-catenin protein expression during the differentiation of the NSCs follows a certain pattern: These results showed that in the control after 1 day differentiation, β-catenin was expressed in the NSC nucleus, was higher on day 2 but lower on day 3. In the infection group, the β-catenin protein showed the same pattern as the control but the protein density was lower than the control group on day 2. When considered with the preliminary data, the proliferation and differentiation of NSCs in the infection group were clearly inhibited. Therefore, we believe that β-catenin protein expression in the nucleus affected NSCs proliferation and differentiation. Findings from other work show that in the brain, β-catenin controls the growth of neural precursor cells and the balance of neuron proliferation and differentiation. When β-catenin is blocked in mice, the number of neural precursors are significantly reduced and brain and spinal cord development is delayed [21], which is consistent with our results.
In nervous system development, besides β-catenin, the basic helix-loop-helix (bHLH) family member gene Ngn1 also plays an important role. The bHLH is a protein structural motif that characterizes a family of transcription factors; it is grouped into two types [12]: type 1 bHLH or E proteins are widely expressed, including E47, E2A, E222, and HEB and daughterless; type 2 bHLH are tissue-specific bHLH proteins, including Ngn1, MyoD, Myogenin and Atonal [15]. The bHLH family members contribute to neural development and muscle generation [8]. During nervous system development, Ngn1 is induced in neuronal precursors. Ngn1 promotes neuronal differentiation and inhibits glial differentiation [3, 16, 20], playing a key role in neuronal differentiation. In this study, we used RT-PCR to detect Ngn1 mRNA expression was consistent with that of β-catenin. After NSCs differentiated for 1 day, the mRNA in Ngn1 was expressed at low levels but increased strongly on day 2, then decreased on day 3.
Combined with our experimental results, we believe that during the normal process of NSCs differentiation, the Wnt pathway was activated and Wnt bound with frizzled protein (Frz) to inhibit the activity of GSK-3β, so as to prevent the β-catenin phosphorylation. Therefore, the increased cytoplasmic β-catenin levels permitted more β-catenin go into the nucleus, where β-catenin and lymphoid enhancer factor (LEF) combined, to initiate the downstream target gene Ngn1 transcription. Moreover, after RCMV infection, the concentration of free β-catenin in the cytoplasm decreased and the entry into the nucleus also decreased, causing the downstream target gene Ngn1 mRNA transcripts to similarly decrease. Thus, neuronal differentiation was inhibited and glial differentiation promoted. Because both β-catenin and Ngn1 play a decisive role in NSC differentiation, RCMV apparently inhibited their expression. These findings showed that by inhibiting the Wnt/β-catenin pathway, RCMV down-regulated β-catenin expression both in the cytoplasm and in the nucleus, thus inhibiting Ngn1 and thereby inhibiting the proliferation and differentiation of NSCs, resulting in embryonic nervous system abnormalities. As Ngn1 is a downstream gene of Wnt/β-catenin, we found that infection caused down-regulated expression of Ngn1, or the reduction may be inhibited directly by viral infection. The specific mechanisms remain to be further understood. Fang Feng and her colleagues found that MCMV infection down-regulates Wnt-1 and Ngn-1 expression [23], consistent with our results and conclusions.
It should be noted that this study has examined only the Wnt signaling pathway and its key proteins. It is possible that RCMV affects many other signaling pathways that are important for neurogenesis. Our future studies will focus on these signaling pathways, e.g., the Notch signaling pathway and the fibroblast growth factor (FGF) signaling pathway. Notwithstanding certain limitations, our study nevertheless suggests that RCMV influenced downstream genes of Wnt signaling pathway by specific mechanisms.
To sum up, our findings show that RCMV significantly inhibits NSC differentiation into mature neurons and leads to a reduction of the number of terminally differentiated cells. In addition, RCMV affects the key gene expression in the Wnt signaling pathway. It should be noted that only the key genes, mRNA and proteins expression were investigated in this study. The mechanism may be more complicated and needs further exploration. Other studies have shown that the MCMV M122 gene is a key initiating factor and an essential component in viral replication [1, 6], and its promoter is nerve tissue-specific [2, 10]. These findings suggest that similar genes in RCMV (R122 or R-MIE) or other early genes are likely to affect NSC differentiation and development.


 DownLoad: